Sunspot update: After going through the roof last month, sunspots drop into the attic this month

With the start of another month NOAA this week updated its graph that tracks the number of sunspots on the Sun’s Earth-facing hemisphere. As I do every month, I have posted that updated graph below, adding some additional details to provide some context.

Last month the number of sunspots rocketed upward to the highest seen since 2014, and only the second time since November 2002 that the Sun was that active. In February those high numbers dropped, though the sunspot activity during the month remained well above the 2020 prediction by NOAA’s panel of solar scientists.

» Read more

Sunspot update: Sunspots in January went through the roof!

NOAA this week updated its monthly graph that tracks the number of sunspots on the Sun’s Earth-facing hemisphere. Below is that updated graph, with January’s numbers added to the timeline. As I have done monthly for the past dozen years here on Behind the Black, I have added some additional details to that graph to provide context.

Just as in December, the number of sunspots in January 2023 shot up to the highest amount since September 2014, which was during the previous solar maximum. Unlike December, however, January’s numbers came only a hairs-breath from topping that 2014 number. In fact, except for that one 2014 month, January 2023 saw the most sunspots on the Sun since November 2002, twenty years ago. In 2002 the Sun was ramping down from what had been a relatively strong double-peaked solar maximum, and was about to begin an extremely long period of little or no activity, followed by a very weak double-peaked solar maximum in 2013.

That period of little activity also corresponded with a long twenty-year period in which the Earth’s climate appeared to stop warming.
» Read more

Sunspot update: The most sunspots since 2014

Time for my monthly sunspot update, based on NOAA’s monthly graph that tracks the number of sunspots on the Sun’s Earth-facing hemisphere. The newest graph, with December’s numbers added to the timeline, is below. As always, I have added some additional details to provide context.

In December the half-year pause in the ramp up to solar maximum ceased, with the Sun seeing the most sunspots since September 2014. This high activity far exceeded the predicted sunspot count for December 2023, almost doubling it. In fact, December’s sunspot count almost equaled the predicted peak for the upcoming solar maximum, which is not supposed to happen until sometime in 2025.

» Read more

NASA loses contact with one hurricane satellite in constellation of eight

NASA has lost contact with one of the eight CYGNSS satellites it uses to track and measure hurricanes worldwide.

The remaining seven satellites that comprise the CYGNSS constellation remain operational and have continued collecting scientific data since FM06 went incommunicado last month, according to NASA’s primary statement about the incident. The constellation’s science work can continue without FM06, but if the team can’t reconnect with the spacecraft, the loss will reduce the spatial coverage of CYGNSS, which until November provided nearly gap-free coverage of Earth.

At the moment engineers do not know why contact was lost, or if they can regain it.

SpaceX launches oceanography satellite

SpaceX early this morning used its Falcon 9 rocket to successfully launch an oceanography satellite, dubbed SWOT, for both NASA and France’s space agency CNES.

The satellite it designed to measure the height of water on 90% of the Earth’s surface.

The first stage was making its sixth flight, and successfully returned to Earth, touching down on its landing pad at Vandenberg Space Force Base.

The leaders in the 2022 launch race:

59 China
57 SpaceX
21 Russia
9 Rocket Lab
8 ULA

The U.S. now leads China 81 to 59 in the national rankings, but trails the entire world combined 91 to 81.

These numbers however should change again later today, as SpaceX has another launch scheduled.

NOAA once again over-predicts the hurricane count

As it has done repeatedly in recent years, NOAA in 2022 once again over-predicted the hurricane count for this past hurricane season, predicting an above-normal season when it actually ended up to be well below-normal.

In late May and again in early August 2022 NOAA predicted that the year 2022 Atlantic Hurricane Season (between June to end November calendar period) would be an “above normal” season with 14-21 named storms, between 6-10 hurricanes including 3-6 major hurricanes (Category 3,4 and 5) as shown in NOAA’s diagram below.

Colorado State University’s Department of Atmospheric Science/Tropical Meteorology Project has compiled the year 2022 tropical storm data, establishing that, compared to its 30 year North Atlantic data records covering the Climatological period 1991-2020, the year 2022 hurricane season was below average in Named Storms, Named Storm Days, Hurricane Days, Major Hurricanes, Major Hurricane Days and Accumulated Cyclone Energy (ACE).

The many graphs at the link also demonstrate that the predictions that there will be an increase in extreme weather events due to increased use of fossil fuels is also proving false.

Sunspot update: The Sun’s unprecedented pause to maximum continues

It is the beginning of the month, and NOAA has once again published its update of its monthly graph that tracks the number of sunspots on the Sun’s Earth-facing hemisphere. Below is the newest graph, adding November’s numbers to the timeline and annotated by me with some additional details added to provide context.

Sunspot activity dropped in November, though still remained significantly higher than the prediction, a sunspot number of 77.6 compared to the predicted number of 57.4. At 77.6, the Sun continues the pause that began in June in the ramp up to solar maximum. For the past half year the Sun’s sunspot output has essentially stalled at approximately the same level.

» Read more

Not one climate model predicts global temperature; all predict too much warming

Climate models versus actual observations for the past 50 years

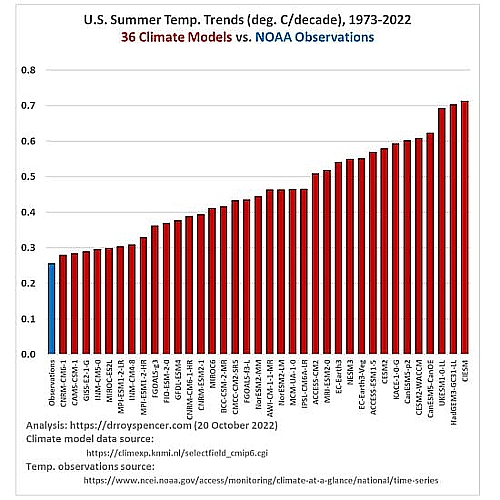
Even as we wait for the final results in numerous elections yesterday, I thought I would throw the chart to the right out for my readers to digest.

The chart was created by climate scientist Roy Spencer of the University of Alabama, who has also been one of the principal investigators for one of NASA climate satellites.

As seen in the accompanying plot, 50-year (1973-2022) summer (June/July/August) temperature trends for the contiguous 48 U.S. states from 36 CMIP-6 climate model experiments average nearly twice the warming rate as observed by the NOAA climate division dataset.

…The official NOAA observations produce a 50-year summer temperature trend of +0.26 C/decade for the U.S., while the model trends range from +0.28 to +0.71 C/decade.

Not one climate model predicted the actual global temperature for the past half century. All predicted too much warming, with about half the models predicting twice as much warming as actually occurred.

In other words, the models continue to express opinion, not science. To rely on any model for establishing climate policy is not only foolish, it is downright irresponsible.

But don’t worry. Joe Biden and the Democrats are on their game, and will shut down all fossil fuel energy sources, because it simply feels right to them.

Meanwhile, on a related side note, the fact that it is no longer possible to finish counting the votes on election day — something that Americans did routinely for more than two centuries long before computers — either is another sign that serious election tampering is going on, or is a clear demonstration that we have entered the new dark age, where it will no longer be possible to accomplish some of the most basic tasks of a true civilization.

In either case, the barbarians rule, and we all suffer because of it.

Sunspot update: The pause in the ramp up to solar maximum continues

NOAA has once again published its monthly update of its monthly graph that tracks the number of sunspots on the Sun’s Earth-facing hemisphere. Below is that November graph, annotated by me with some additional details added to provide context.

Though sunspot number continued to be much higher than the prediction (almost double), October saw almost exactly the same number of sunspots as seen in September, which is why this new graph seems almost identical to last month’s.

In other words, the pause in the ramp up to solar maximum, first noted in August, continues.
» Read more

Sunspot update: Activity again exceeds prediction but ramp up pauses

NOAA this weekend published, as it does at the start of every month, its October update of its monthly graph that tracks the number of sunspots on the Sun’s Earth-facing hemisphere. As I have done since I started this website in 2011, I have published that graph below, with some additional details added to provide context.

An increase in sunspot activity in September wiped out the decline seen in August, so that the sunspot number in September once again matched or exceeded the numbers seen during the middle of the previous solar maximum from 2012 to 2014, a low period of activity between that maximum’s two peaks. Activity also continued to exceed the predictions of the panel of government solar scientists put together by NOAA.

At the same time, since May the ramp up to maximum has stalled, something I noted last month and has now become more evident.
» Read more

Sunspot update: Solar activity continues to exceed sunspot predictions

It is the beginning of September and time to post another update on the Sun’s ongoing solar cycle. Below is NOAA’s monthly graph tracking the number of sunspots on the Sun’s Earth-facing hemisphere, with the activity in August now added. I have also added some additional details to the graph to give the numbers a larger context.

Though sunspot activity dropped in August it remained significantly above the predictions of the panel of government solar scientists put together by NOAA. The predicted sunspot number for August, as indicated by the red curve, was supposed to be about 48. The actual number was 75.

» Read more

Sunspot update: Activity recovers mostly from last month’s decline

It is the start of the month, and thus time to post NOAA’s monthly update of its graph tracking the number of sunspots on the Sun’s Earth-facing hemisphere. That graph is below, with some additional details added by me to provide a larger context.

After the first real decline in sunspot activity in June, the Sun recovered that decline almost completely in July. Though the ramp up to solar maximum has stalled somewhat in the last two months, the trend continues to point to a very active maximum, much higher than predicted as well as much stronger than the last very weak maximum in 2020.

» Read more

Sunspot update: For the first time in 2022, sunspot activity eases

With the year half over, the Sun in June did something it had not done since the start of the year: The number of sunspots seen daily on the Sun’s visible hemisphere actually declined from the month before.

I know this because, as I do every month, I have posted below NOAA’s monthly update of its graph tracking the number of sunspots on the Sun’s Earth-facing hemisphere, with some addition details added to provide a larger context.

» Read more

Scientists claim rocket launches are going to damage ozone layer

Junk science: This week NOAA government scientists published a paper claiming that the upcoming increase in rocket launches worldwide is a threat to the ozone layer and will also — my heart be still — promote climate change!

The study found that a tenfold increase in the amount of soot injected into the stratosphere every year would after 50 years lead to an annual temperature increase in that layer of 1 to 4 degrees Fahrenheit (0.5 to 2 degrees Celsius). The stratosphere is the layer of the atmosphere just above the lowest troposphere. The study found that the projected warming would slow down subtropical jet streams, bands of strong wind circling the planet at the lower edge of the stratosphere that influence the African and Indian summer monsoons.

Warmer temperatures in the stratosphere would also degrade the protective ozone layer, which blocks harmful ultraviolet radiation from the sun from reaching the planet’s surface.

The paper’s abstract also said this:

We show that the rocket black carbon increases stratospheric temperatures and changes the global circulation, both of which cause a reduction in the total ozone column, mainly in the northern high latitudes. Comparing the amplitude of the atmospheric response using different emission rates provides insight into stratospheric adjustment and feedback mechanisms. Our results show that the stratosphere is sensitive to relatively modest black carbon injections.

This is garbage science, and I wouldn’t bother posting a link to it if other news sources weren’t promoting it. These predictions — based on a very simple computer model — are nothing more than guesses, and are apparently designed to both attack the growing space industry as well as garner funding for more such junk science, as illustrated by this quote from the NOAA press release:

“We need to learn more about the potential impact of hydrocarbon-burning engines on the stratosphere and on the climate at the surface of the Earth,” said lead author Christopher Maloney, a CIRES research scientist working in NOAA’s Chemical Sciences Laboratory. “With further research, we should be able to better understand the relative impacts of different rocket types on climate and ozone.”

For almost a half century climate scientists — many working for government agencies like NASA and NOAA — have been publishing junk papers like this, predicting climate doom in only a few decades unless we do as they say, while funneling boatloads of cash into their pockets. Almost none of those predictions have turned out to be correct.

This report is equally suspect, especially because it touts the false statistic that “launch rates have tripled in recent decades.” The number of launches has not tripled from its long-term average since Sputnik. The only way you can get manufacture that fake statistic is if you compare last year’s total (134) with the launch numbers from the early 1960s, before the space race had even begun. And while the launch numbers are likely to rise dramatically in the coming years, the numbers will still be infinitesimal compared to other industries. Going from 50-100 launches to 200-500 launches is hardly the end of the world.

It really is far past time for the press and the general public to stop listening to these fake papers.

The oppressive and ignorant blacklisting culture that now dominates politics

Most of all beware this boy.’
As noted by the Spirit of Christmas Present in Dickens’
The Christmas Carol, ‘This boy is ignorance, this girl is want.
Beware them both, but most of all beware this boy.’

While today’s blacklisting essay is mostly about one specific story, what it really does is illustrate starkly the overall ugliness and ignorance that fuels the blackballing, and how that ugliness and ignorance has seeped into every aspect of our political and cultural lives.

In a story that is hardly unique or surprising, the Los Angeles City Council last week passed a new regulation that bans the use of any gas appliances in new construction, both residential and commercial.

The council’s reasons for imposing this ban — as is usual for such bans — was based not on any actual documented problem that presently exists but on a fear that one might someday occur. From the opening paragraph of the actual motion:

As the gravity and urgency of the climate emergency become more apparent with each passing year of rising temperatures, dangerous wildfires, and more severe droughts—all of which disproportionately impact communities of color and the most vulnerable Angelenos—the City of Los Angeles must do all in its power to reduce its carbon emissions and move toward a sustainable, zero-carbon economy. [emphasis mine]

Note the highlighted words. » Read more

Sunspot update: In May we had sunspots, sunspots, and more sunspots!

It is time for another sunspot update! On June 1 NOAA released its monthly update of its graph tracking the number of sunspots on the Sun’s Earth-facing hemisphere. As I do every month, I have posted it below, having added some addition details to provide a larger context.

In May the sunspot activity on the Sun almost literally exploded, producing some of the strongest solar flares in years as well as the most sunspots since the previous solar maximum in 2014. On several days there were as many as eight sunspot groups on the Sun, with one so large that it was visible to the naked eye on Earth (if viewed properly with a protective filter).
» Read more

Environmentalists sue local Boca Chica officials for closing beaches for SpaceX

Muskhate: The Sierra Club and other environmental groups have now sued a variety of local Boca Chica government agencies for periodically closing the beaches during hazardous SpaceX operations.

The Sierra Club, the Carrizo/Comecrudo Tribe of Texas and non-profit Save RGV have joined together in a lawsuit against the Texas General Land Office, Texas land commissioner George P. Bush and Cameron County in Texas for closing Boca Chica Beach periodically for SpaceX operations during Starship tests, the Sierra Club stated May 5. The Boca Chica beach is near SpaceX’s Starbase facility, where it is building Starship rocket prototypes and their massive Super Heavy boosters.

“Restricting access to a public beach, as the defendants have done, violates the Texas constitution,” the Sierra Club said in a statement. None of the allegations have been proven in court, and the statement does not name SpaceX among the entities pursued in the lawsuit.

These are the same groups that have been lobbying government officials for the past few years to shut SpaceX down. They claim that a change to the state’s laws allowing these closures that was passed in 2013 violates the state’s constitution, and want the courts to agree.

Of course, we all know these organizations really have no interest in keeping the beaches open for public use. What they really want is to shut down SpaceX in Boca Chica, because that company is actually doing something exciting and innovative while bringing billions of investment capital to the Rio Grand Valley, including tens of thousands of new jobs. (The group called “Save RGV” is especially ironic and dishonest, since RGV stands for Rio Grand Valley. If their effort succeeded, they would not save RGV, but destroy it. All those jobs and billions would vanish, leaving the area as depressed and as poor as it has been now for decades.)

These groups also wish to destroy Elon Musk, because he has recently made it clear that he no longer is a knee-jerk supporter of all leftist causes.

Nor will their effort cease should they lose this case in court. They will do what environmental groups have done now for decades, find another minor legal issue and sue again, and again, and again, and again.

Pushback: Professor fired for having opinions wins total victory

University of Central Florida: Hostile to free speech

Bring a gun to a knife fight: In January 2021 (in one of my first blacklist columns and just after Biden assumed power), I described how professor Charles Negy was fired from the teaching job he had had at the University of Central Florida for 22 years, merely because he had stated some obvious facts about BLM and affirmative action on his twitter feed.

The school claimed it did not fire him for these tweets (an obvious lie based on the events), but because of a supposed pattern of inappropriate classroom behavior obtained through anonymous tips, tips instigated by Negy’s tweets that by the way did not match any of the school’s previous assessments of his teaching.

Negy fought back, demanding his case be reviewed by an independent arbitrator, and has now won his case.

In the ruling on Monday, the arbitrator, Ben Falcigno, found that the university had failed to show “just cause” when it fired Dr. Negy because it had not given him a chance to change his conduct in the classroom or, alternatively, to show that he was incapable of changing his behavior.
» Read more

Today’s blacklisted Americans: Conservative Supreme Court justices doxed and threatened by pro-abortion protesters

The left goes after the conservatives on the Supreme Court

Persecution is now cool! The leaked draft opinion by Supreme Court Justice Samuel Alito that suggested that Roe vs Wade will be overturned this year has resulted in another wave of persecution by pro-abortion activists, almost all of which are Democrats and leftists.

The first indication that the threats and hate were real was revealed two days after Alito’s draft was leaked when his office canceled a scheduled public appearance by him at judicial conference this week.

Though the office provided no explanation for the cancellation, the reasons soon became obvious when two different radical left organizations partnered to publish the home addresses of all six conservative Supreme Court justices, encouraging protesters to go there and use “a diversity of tactics” to “force accountability.”

In collaboration with Vigil for Democracy, Ruth Sent Us generated and posted a Google Maps graphic pinning what it claims are the home addresses of Justices Barrett, Kavanaugh, Thomas, Alito, Gorsuch, and Roberts, where they presumably reside with their families. Vigil for Democracy titled the map, “Extremist Justices,” adding, “Where the six Christian fundamentalist Justices issue their shadow docket rulings.” The map has 3,185 views so far.

In Virginia, where three of the six justices live, protesting outside a private home is illegal.

» Read more

Sunspot update: The Sun rages on

Time for my monthly sunspot cycle update, where I take NOAA’s monthly graph showing the long term trends in the Sun’s sunspot activity, and annotate it with additional data to provide some context.

The trend of sunspot activity exceeding the predictions continued in February. While the increase in activity from January still left it less than the activity in December, the total number of sunspots is still far above the number predicted by NOAA’s panel of solar scientists in 2020, with the rise towards a solar maximum also much steeper and far faster than predicted.
» Read more

Sierra Club official arrested for vandalizing Brownsville public mural with anti-SpaceX graffiti

Brownsville police today arrested Rebekah Lyn Hinojosa, a Sierra Club official, for spraying anti-SpaceX graffiti on the downtown mural painted by LA artist Teddy Kelly.

Hinojosa was taken into custody for spray painting the words “gentrified stop SpaceX” on a mural in downtown Brownsville. Hinojosa is the Senior Gulf Coast Campaign Representative for the Beyond Dirty Fuels Campaign, according to the Sierra Club website.

The level of ignorance illustrated by Hinojosa is difficult to measure. First, how can she think destroying art is no worse than “dirty fuels”?

Second, her belief that gentrification is somehow evil illustrates a truly profound close-mindedness and a refusal to notice that the prosperity that SpaceX is bringing Brownsville is helping everyone, poor and rich alike. She would be hard-pressed to find anyone who lives in Brownsville unhappy with SpaceX, if she made the slightest effort to ask — which she obviously does not wish to do.

Third, it appears she assumes her a short meaningless slogan constitutes a reasoned argument that will certainly change minds. And if she is right, we are truly doomed.

Hinojosa’s act however reveals the rising level of mindless hate against SpaceX’s achievements among the wine-and-cheese Democratic Party suburban crowd, the only people who really support leftist environmental organizations like the Sierra Club. They are beginning to marshal their forces to destroy the company, and sadly, their allies in the Democratic Party now control much of the government. At a minimum, expect serious delays at Boca Chica and with Starship due to this anti-capitalism campaign.

Hat tip to Robert Pratt of Pratt on Texas for letting me know about this story.

Sunspot Update: The Sun quiets down, but just a little

With the posting yesterday by NOAA of its monthly update to its graph showing the long term trends in the Sun’s sunspot activity, it is time for me to do my own update, showing this graph below with annotations in order to provide some context.

While sunspot activity dropped slightly in January, the activity still remained well above the prediction made by NOAA’s panel of solar scientists in 2020, with the upward trend towards a solar maximum much steeper than predicted as well.
» Read more

Sunspot update: The Sun blasts off!

Over the weekend NOAA posted its monthly update to its graph showing the long term trends in the Sun’s sunspot activity. As I do every month, I have posted that graph below, annotated to show the previous solar cycle predictions and thus provide context.

In December the Sun’s sunspot activity not only continued the pattern of the past two years — whereby sunspot activity has consistently exceeded the prediction of NOAA’s solar scientist panel — the amount of activity shot up like a rocket. December 2021 saw the most sunspots in a single month since September 2015, when the Sun was about a third of the way into its ramp down from the solar maximum in 2014.

» Read more

FAA’s approval of SpaceX’s Starship operations delayed at least a month

The FAA has now had to delay the final approval of its environmental reassessment of SpaceX’s Starship facility and operations at Boca Chica for at least one month because NOAA has refused to approve the plan.

That puts NOAA’s generic review of Rocket Landing and Launches back to at least the end of January, with the much more complex and contentious USFWS [Fish and Wildlife] review also pending (this one is habitat and species review of impacts to bird and wildlife populations specific to Boca Chica).

The earliest approval by the FAA (which again, is far from a sure thing) should be projected into February. And the actual launch license process can’t be started until then. March is absolutely the earliest even the giddiest optimist could expect for Starship’s Maiden Orbital Flight.

It appears that the bureaucrats in NOAA are hostile to the launch site, and are looking for reasons, mostly environmental, to either block it or slow it down.

It also appears that a second Department of the Interior agency must sign off, and it is also hostile.

Based on this story, it looks like Starship’s first orbital flight will not happen until the latter half of ’22, if then. Nor can we expect any help from the Biden administration. Unlike Trump, the Democrats now running the executive branch of government do not like private enterprise and business, and generally look for excuses to regulate and even block it, especially if they think there is the slightest chance it might harm some formerly unknown species somewhere.

This is America today, no longer free. Rather than you making the decision freely, as an American citizen, un-elected federal government officials now decide whether you can do anything, or not.

Sunspot update: Sun continues to be more active than predicted

Time for our monthly sunspot update, using NOAA’s most recent monthly graph of sunspot activity. That graph is below, annotated to show the previous solar cycle predictions and thus provide context. It covers all activity through the month of November.

The pattern for the past two years since the end of the solar minimum continues, with sunspot activity consistently exceeding the prediction of NOAA’s panel of solar scientists, as indicated by the red curve. The activity in November dropped very slightly from October, but remained more active than the prediction.

» Read more

Sunspot update: Sun continues its higher than predicted activity

With the beginning of a new month comes my monthly sunspot update, based on NOAA’s most recent monthly graph of sunspot activity. That graph is below, annotated to show the previous solar cycle predictions and thus provide context. It has now been extended from last month to include the Sun’s sunspot activity in October.

Sunspot activity in October continued to be higher than predicted, though the month saw a slight drop from September. Even so, the number of sunspots seen on the Sun’s facing hemisphere in October were the most since August of 2016, when the Sun was ramping down to solar minimum.

» Read more

Drop in aviation during COVID lockdowns caused no change in high cirrus clouds, contrary to predictions of climate models

The uncertainty of climate science: In the twenty-five years since I became a science journalist, I cannot count the number of high profile press releases and scientific papers that I’ve read claiming that the increase in aviation and the resulting contrails from airplanes was going to be a major contributor to human-caused global warming. According to the models, the increase in contrails was increasing the high altitude cirrus cover, and thus in a variety of ways acting to warm the planet.

Well, a paper just published in Geophysical Research Letters took a look at the effect the sudden and almost complete cessation of aviation during the 2020 COVID lockdowns had on high altitude cirrus clouds. If the models were right, the lack of air traffic should have caused a reduction in cirrus clouds, thus demonstrating the models were correct.

The models were wrong, once again. From the abstract:

We find that, despite the very large reduction in air traffic, neither cirrus cover nor temperature ranges changed by enough to be detectable relative to the year-to-year variability of natural cirrus. Comparing the satellite observations to previous model-simulated aviation cirrus, we determine that any aviation-induced change in cirrus would have a much smaller magnitude than would be inferred from climate model simulations. These results suggest that the warming effect of cirrus clouds produced by aircraft may be smaller than previously believed. [emphasis mine]

In other words, air traffic apparently has no impact on the high altitude cloud cover. The models that said this traffic was a contributor to global warming were 100% wrong. It apparently is not.

Of course, there remains some uncertainty even with this result, as it is for only one year. The effect of air traffic on clouds could have been disguised in 2020 by the natural fluctuations normally seen from year to year, though the paper’s authors think not.

Assuming this data is confirmed, the authors also concede that the plans to mitigate contrails by rerouting planes so that they do not all fly along the same routes could be very counter-productive. It will cause those detours to burn more fossil fuels, while changing nothing in the cloud cover in the upper atmosphere.

Ah, the law or unintended consequences once again rears its ugly head. Too bad global warming activists never seem to admit it exists, even though it constantly bites them in the rear, time after time after time after time after time….

California environment overregulation sole cause of shipping backup

California environment regulations that ban the use of any truck more than three years old, essentially banning half of all fleet trucks and practically all small private truck companies, is the real cause of the shipping backlog that is piling up outside the ports of Los Angles and Long Beach.

This banning was established by a deal the EPA made with California in October 2020, when Trump was still president.

In effect, what this 2020 determination and settlement created was an inability of half the nation’s truckers from picking up anything from the Port of LA or Port of Long Beach. Virtually all private owner operator trucks and half of the fleet trucks that are used for moving containers across the nation were shut out.

In an effort to offset the problem, transportation companies started using compliant trucks (low emission) to take the products to the California state line, where they could be transferred to non-compliant trucks who cannot enter California. However, the scale of the problem creates an immediate bottleneck that builds over time. It doesn’t matter if the ports start working 24/7, they are only going to end up with even more containers waiting on a limited amount of available trucks.

Essentially, California is now holding the entire nation hostage. The backlog is only going to get worse. Moreover, the deal as designed favored big operations, such as Amazon, Walmart, UPS, FedEx, Samsung, The Home Depot and Target, because they can afford the extra costs of shipping to alternative ports. The small companies are essentially shut out.

So much for protecting the little guy, Mr. Trump. This highlights again Trump’s primary failure. He did not clean house when in office, and thus allowed the bureaucracy — clearly operating as agents of the Democratic Party — to double cross and stymie him at every opportunity.

Sunspot update: The boom in sunspots returns!

It is time for my monthly sunspot update, based on the most recent NOAA monthly graph, showing the changes in the Sun’s sunspot activity during September. That graph is below, annotated to show the previous solar cycle predictions and thus provide context.

In September sunspot activity boomed once again, producing the most sunspots in a month since 2016 and ending the slight drop in activity in August to return to the pattern the Sun has exhibited since the end of solar minimum. Consistently the number of sunspots on the visible hemisphere of the Sun since 2020 has exceeded the April 2020 prediction of the NOAA scientist panel, as indicated by the red curve in the graph.

» Read more

1 2 3 4 31