Scientists: The solar cycle was only 8 years long during the Maunder Minimum in the 1600s

Using archival records gathered in Korea during the 1600s when the Sun was undergoing a long period of almost no sunspots — called the Maunder Minimum — scientists have discovered evidence that the solar cycle during that time was only 8 years long.

You can read their paper here. Since almost no sunspots were visible at that time, the scientists used reports of aurora in Korea to determine periods when the Sun was more active. From their abstract:

By analyzing the variations in solar activity-related equatorial auroras recorded in Korean historical books in the vicinity of a low-intensity paleo-West Pacific geomagnetic anomaly, we find clear evidence of an 8-year solar cycle rather than the normal 11-year cycle during the Maunder Minimum.

This 8-year cycle is shorter than the 9-year cycle that other researchers had estimated based on the few sunspots that did appear during this grand minimum. Both conclusions however challenge what is known of the Sun. Since the 11-year cycle resumed in the 1700s, short cycles have generally been associated with very active periods, the opposite of what has been found during Maunder.

In other words, we know better what happened, but have no understanding of why. Since the Maunder Minimum appears associated with the Little Ice Age of the 1600s, and fits other data that says the climate cools when the Sun produces few sunspots, gaining some understanding of this process is important for understanding past and future changes to the global climate.

Astronomers discover a solar twin whose sunspot cycle changed into a grand minimum

Astronomers studying the sunspot cycle of several dozen stars that are twins of our Sun have identified for the first time a star whose 17-year cycle suddenly ceased, going into an extended grand minimum.

Comparing these stars to the Sun enables astronomers to better determine how typical – or not – the Sun is as a star. The Sun’s magnetic activity is defined by its 11-year sunspot cycle. Of the 59 stars that Baum’s team surveyed, 29 appeared to also have starspot cycles, and the period of those cycles could be measured for 14 of them.

“Of these 14 stars, the average length of their cycle is just under 10 years, which is similar to the Sun’s 11-year cycle,” Baum tells Physics World. However, not all the stars adhered to this time frame. One star that was surveyed has a cycle lasting less than four years, while another star, HD 166620, had a cycle 17 years long.

Note the past tense. Sometime between 1995 and 2004, HD 166620’s starspot cycle simply stopped.

When or if the star’s sunspot activity resume is unknown. The Sun’s last grand minimum, dubbed the Maunder Minimum, lasted 70 years during the 1600s.

No one yet understands why stars do this. This discovery however now shows that the Sun is not unique in this behavior.

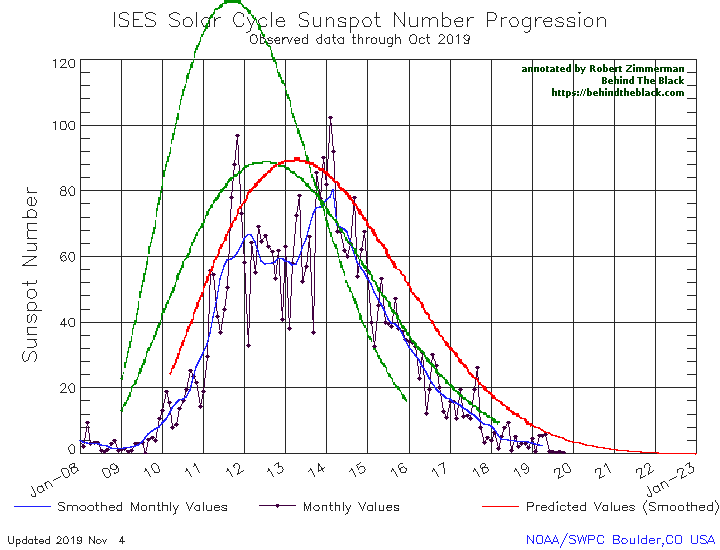
Sunspot update Nov 2019: The longest flatline in centuries

The Sun is now in what appears to be the longest stretch ever recorded, since the 11-year solar sunspot cycle reactivated in the 1700s after the last grand minimum, of sunspot inactivity. This record-setting dearth of practically no sunspots has now stretched to six months in a row.

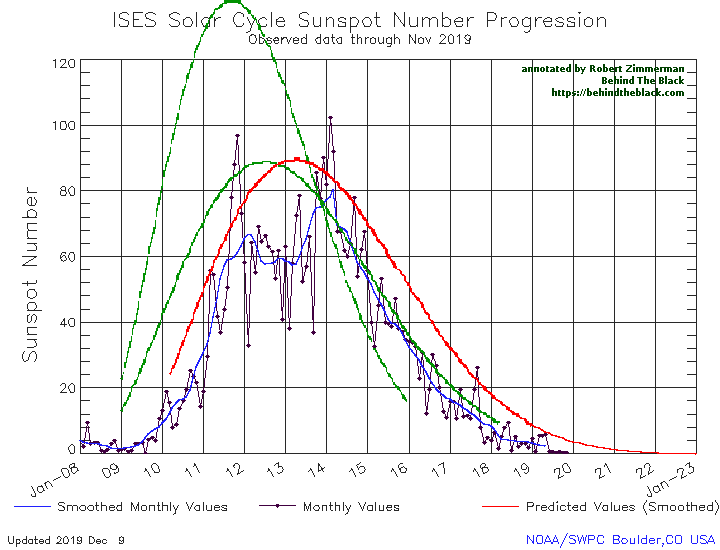
On December 8 NOAA released its November update of its graph showing the long term sunspot activity of the Sun. As I have done now every month since this webpage began in 2011, I have posted it below, with annotations:

November 2019 sunspot activity
The graph above has been modified to show the predictions of the solar science community for the previous solar maximum. The green curves show the community’s two original predictions from April 2007, with half the scientists predicting a very strong maximum and half predicting a weak one. The red curve is their revised May 2009 prediction, extended in November 2018 four years into the future.

In November the Sun saw two official sunspots (here and here) and one active area that never received an official sunspot number, with two of these three weak events having a polarity linking them to the next solar maximum.
» Read more

Sunspot update October 2019: Sunspot activity continues to flatline

For the fifth month in a row the Sun has produced practically no sunspots, possibly the longest such stretch since astronomers began recording the sunspot cycle in the 1700s.

This flatlining is very obvious in NOAA’s October update of its graph showing the long term sunspot activity of the Sun, released yesterday, and posted below, with annotations:

October 2019 sunspot activity
The graph above has been modified to show the predictions of the solar science community for the previous solar maximum. The green curves show the community’s two original predictions from April 2007, with half the scientists predicting a very strong maximum and half predicting a weak one. The red curve is their revised May 2009 prediction, extended in November 2018 four years into the future.

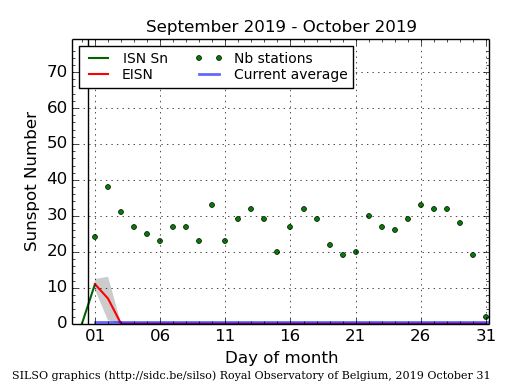
SILSO October graph

As it has done in previous four months, in October the Sun produced practically no sunspots. The graph on the right, produced by Sunspot Index and Long-term Solar Observations (SILSO), shows only one weak sunspot at the beginning of October.

Even though the previous 2008-2009 solar minimum was one of the deepest and longest ever recorded, the lack of sunspots in the past five months has significantly beaten it for inactivity, as shown on the first graph above. That previous minimum never had a period of even two months with so few sunspots. Furthermore, the Sun has now been blank 74% of the time in 2019, a record of blankness that beats the yearly record of either 2008 or 2009. If the Sun continues to be as blank as it has been for the next two months, 2019 will easily set the record for the year with the fewest sunspots ever recorded.

The big question remains: Are we heading for a grand minimum with no sunspots for decades? We still do not know. Even these unprecedented trends prove nothing, as we really do not yet have a clear understanding of why the Sun undergoes these various cycles of sunspot activity/inactivity. The Sun could still come back to life in the coming years. We can only wait and see. As I noted however in last month’s sunspot update, the arrival of a new grand minumum, the first since the 1600s, could have important consequences:

During past grand minimums there is evidence that the Earth also cooled, though the link between the two phenomenon remains circumstantial and unproven. If we see another grand minimum, and the Earth once again cools, then we might be able to finally tie these two phenomenon together.

It is essential that climate scientists pursue this question. Answering it might very well defuse the fears presently expressed by leftist politicians and the leftist press of an oncoming period of global warming.

At the same time, it might also present us with the possibility of an oncoming period of significant global cooling, during which it will be so cold that we might face crop failures (as happened in the previous grand minimum in the 1600s).

We need to know what is going on with the Sun, and its consequences for Earth, as soon as possible. Whether we can find out this solar cycle is unlikely, but a cold hard look at the data would do much to answer the question.

I wonder however if there any climate scientists around willing to do so. Questioning human-caused global warming carries great career risks. In fact, taking any position counter to the prevailing wisdom on any scientific issue appears to carry risks, as demonstrated by the experience recently when a journal decided to publish a paper that questioned modern gender politics:
» Read more

Sunspot update Sept 2019:
The blankest Sun in decades

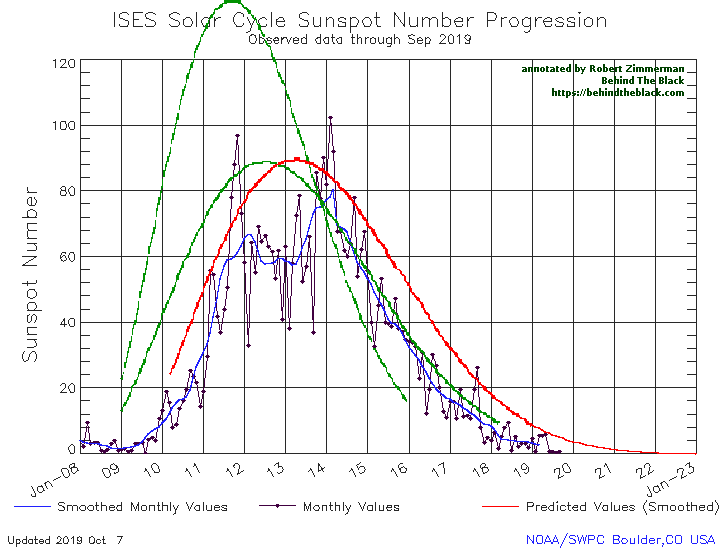
With the release yesterday by NOAA of its September update of its graph showing the long term sunspot activity of the Sun, we find ourselves in what might be the longest stretch of sunspot inactivity in decades, part of what might become the most inactive solar minimum in centuries.

In the last four months the Sun has produced practically no sunspots. There were two in June, two in July, and one in August. The September graph, posted below with additional annotations by me to give it context, shows that the past month was as weak as August, with only one sunspot again.

September 2019 sunspot activity

The graph above has been modified to show the predictions of the solar science community for the previous solar maximum. The green curves show the community’s two original predictions from April 2007, with half the scientists predicting a very strong maximum and half predicting a weak one. The red curve is their revised May 2009 prediction, extended in November 2018 four years into the future.

The 2008-2009 solar minimum was one of the deepest and longest ever recorded. Yet, it never produced a stretch of four months with so few sunspots, as shown in the graph above. Moreover, during that minimum the Sun was blank 71% of the time in 2008 and 73% of the time in 2009 (a record). Right now, with almost three months to go in 2019, the Sun has already been blank 73% of time, with every indication that it will top that number before the year is out.

Furthermore, the trend continues to suggest we are heading for a period of very few sunspots. Though one of the six sunspots seen since June 1 had a polarity that belonged to the next solar cycle, we have seen no further such next-cycle sunspots since July. There was one active region on October 6 with a next solar cycle polarity, but it was never able to gather enough magnetic energy to mature into a sunspot.

As I noted in my July 8 sunspot update,
» Read more

Sunspot update June 2019: Down to zero again, with next cycle making an appearance

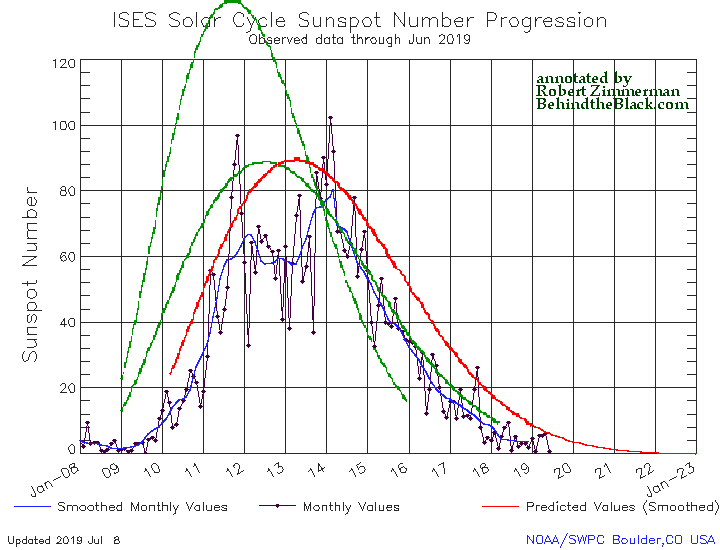
Below is the June graph of sunspot activity released by NOAA yesterday. As I do every month, I am posting it here, annotated to give it some context.

After three months of slightly increased sunspot activity, the Sun in June was essentially blank, with sunspots visible on its facing hemisphere on only five days. In addition, the 36 day stretch of spotless days that began in May and stretched through most of June was the longest such stretch since the last minimum in 2009.
June 2019 sunspot activity

The graph above has been modified to show the predictions of the solar science community for the previous solar maximum. The green curves show the community’s two original predictions from April 2007, with half the scientists predicting a very strong maximum and half predicting a weak one. The red curve is their revised May 2009 prediction, extended in November 2018 four years into the future.

Even while the solar minimum continues and heads for its low point, the first indications of the next solar solar cycle have appeared:
» Read more

Sunspot update April 2019: Not quite minimum

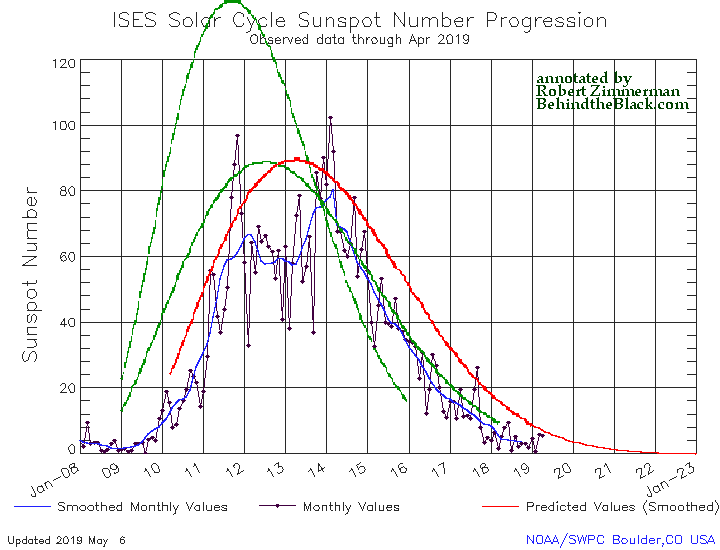
Time for the monthly sunspot update: NOAA yesterday released its the monthly update for the Sun’s sunspot cycle, adding sunspot activity for April 2019 to its graph. As I do every month, I have annotated that graph to give it some context and am posting it below.

While the Sun is clearly at the beginning of what might be an extended or very extended solar minimum, the continuing uptick in activity in both March and April illustrates that we have still not arrived at full minimum.

April 2019 sunspot activity

The graph above has been modified to show the predictions of the solar science community for the previous solar maximum. The green curves show the community’s two original predictions from April 2007, with half the scientists predicting a very strong maximum and half predicting a weak one. The red curve is their revised May 2009 prediction, extended in November 2018 four years into the future.

As the Sun ramps down to minimum it will have months where there is no activity, as happened in February 2019, and months, such as in March and April, where more sunspots appear.

Eventually the quiet months will become dominate, and soon thereafter, when activity increases again (assuming it does), the solar science community will then announce the date of true minimum.

We are not there. Normally it can take a year or more for the Sun to settle down. If activity declines as indicated by the red curve, it could take as long four years, which would be a record-long minimum. The difference will tell us whether the eleven-year solar cycle is continuing, or the Sun is heading into a grand minimum, with no significant sunspots for decades.

And as I have said repeatedly in the past five years, a grand minimum could significantly impact the global climate, cooling it. Or not. It is that unknown that will be answered should a grand minimum occur. Circumstantial data suggests an inactive Sun cools the planet, and the arrival of a new grand minimum will allow scientists to confirm or refute that circumstantial data.

Sunspot update March 2019: An upcoming Grand Minimum?

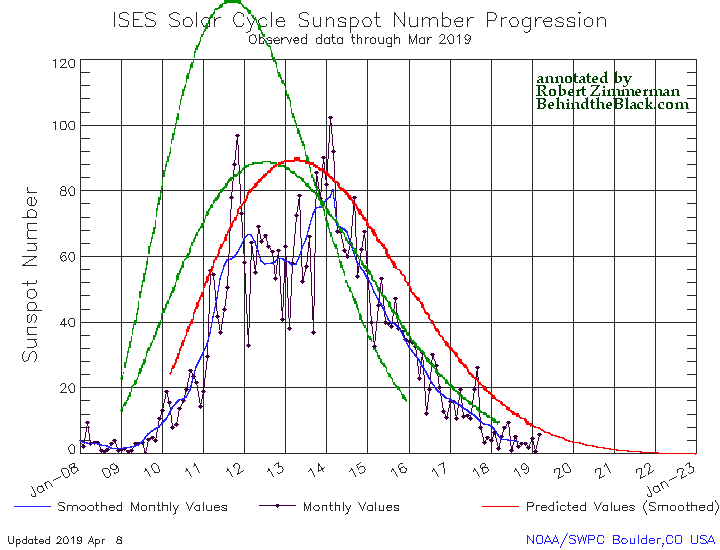
Even though we are now deep into the beginning of what might become the first grand minimum in sunspot activity since the invention of the telescope, that does not mean the Sun has as yet stopped producing sunspots. Yesterday NOAA released its the monthly update of its tracking of the solar cycle, adding sunspot activity for March 2019 to its graph. Below is that graph, annotated by me to give it some context.

It shows the Sun with a slight burst in activity in March, suggesting that though we are now in the solar minimum that minimum still has the ability to produce sunspots.

At the same time, for me to say that we might be heading to a grand minimum, a time period lasting many decades where no sunspots are visible and the sunspot cycle essentially ceases, is not click bait or hyperbole. It is instead based on what I now think the solar science community is thinking, based on this very graph.

March 2019 sunspot activity

The graph above has been modified to show the predictions of the solar science community for the previous solar maximum. The green curves show the community’s two original predictions from April 2007, with half the scientists predicting a very strong maximum and half predicting a weak one. The red curve is their revised May 2009 prediction, extended in November 2018 four years into the future.

For past half dozen or so cycles the solar science community had issued its prediction for the upcoming solar maximum at about this stage in the overall cycle, during the final ramp down to minimum when it was clear that the Sun had entered that minimum.

This cycle’s prediction however has not yet happened, and in fact appears to be late. In fact, the extension of the May 2009 red curve that was made in November 2018 might very well be the only prediction we see. That extension is shown by the differences between the green 2007 prediction and the red 2009 prediction in the graph. Before November 2018 both curves ended at the same place, the end of 2018.

The extension of that red curve is important. As I noted in my December 2018 sunspot update,
» Read more

Sunspot update February 2019: The Sun flatlines again

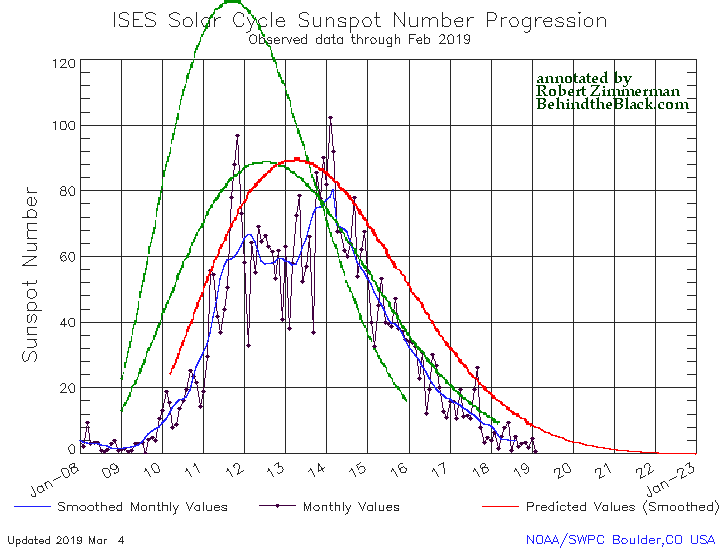
We are now deep into solar minimum. On Sunday NOAA released its the monthly update of the solar cycle, covering sunspot activity for February 2019. As I have done every month since the start of Behind the Black, I am posting it below, annotated to give it some context.

February 2019 sunspot activity

The graph above has been modified to show the predictions of the solar science community. The green curves show the community’s two original predictions from April 2007, with half the scientists predicting a very strong maximum and half predicting a weak one. The red curve is their revised May 2009 prediction.

For the second time since the beginning of the solar minimum last year, the Sun flat-lined for an month, producing no visible sunspots during the entire month of February.

That streak has continued into March. At present we are four days into March, and still no sunspots.

The big question that I will be repeating probably every month for the next two years is whether we are merely experiencing an early and possibly deep solar minimum, or the advent of a new grand minimum, with no visible sunspots for decades. During the last grand minimum in the 1600s there is evidence the Earth cooled, so much so that it was labeled the Little Ice Age. And with previous grand minimums over the past few thousand years there is evidence that similar coolings occurred. Similarly, periods where sunspot activity was high also appear to have been periods of warmer temperatures.

Why is not clearly understood, though there is some evidence that it might be related to the increasd cosmic ray flux during solar minimum.Those rays might interact with the atmosphere to produce more clouds, thus cooling the Earth. This is not proven however and remains merely a theory linked to some tentative preliminary evidence.

If we do enter a grand minimum, scientists will likely get the answers to these questions. However, we might also find ourselves experiencing significantly colder weather. I am right now flying from Chicago to Columbus, over Lake Michigan, which is filled with ice floes, something we have not seen in March for decades. Nor has this kind of cold weather been unusual for the past decade or so. Could it be because of the weak solar maximum we just experienced and the deep and extended solar minimum just before that? No one knows.

All we can do is gather data, and find out.

Sunspot update January 2019: The early solar minimum

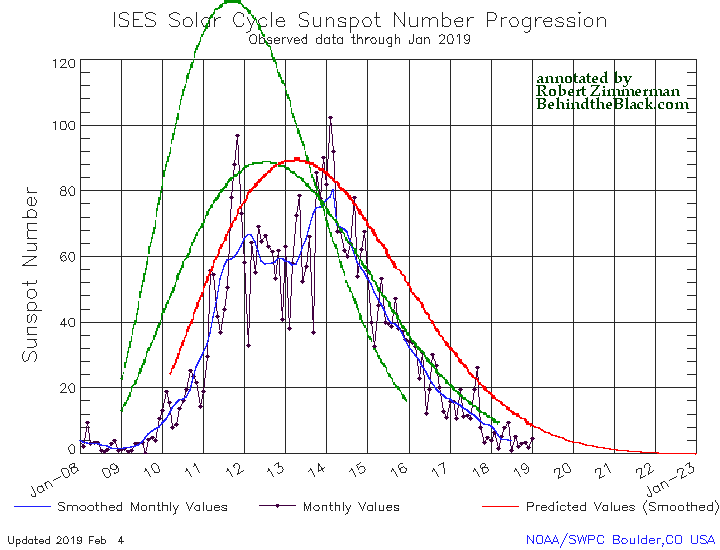
As I have done every month since 2011, I am now posting NOAA’s the monthly update of the solar cycle, covering sunspot activity for January 2019. They posted this update on Monday, and I am posting it below, annotated to give it some context.

January 2019 sunspot activity

The graph above has been modified to show the predictions of the solar science community. The green curves show the community’s two original predictions from April 2007, with half the scientists predicting a very strong maximum and half predicting a weak one. The red curve is their revised May 2009 prediction.

January saw a slight uptick in sunspot activity, but the overall activity remains comparable to mid-2008, when the last prolonged solar minimum began. If you go to my October 2018 update, you can see the graph when it included data going back to 2000 and see the entire last minimum.

That last minimum started in the last half of 2007, and lasted until mid-2009, a full two years. If you look at the red line prediction of the solar science community, it appears that they are expecting this coming minimum to last far longer, almost forever. I expect this is not really true, but that they have simply not agreed on a prediction for the next cycle. Some in that solar science community have hypothesized that we are about to enter a grand minimum, with no sunspots for decades and thus no solar maximum. Others do not agree.

Since neither faction really understands the mechanism that causes these sunspot cycles, there is no way now to determine what will happen, until it does so. What we do know from climate data is that the Earth cools when the Sun is inactive. Why remains unclear, though there is at least one theory, with some evidence, that attempts to explain it.

And despite the untrustworthy claims of NOAA and NASA scientists that the last few years have been hot, experience on the ground disputes this. Their data has been adjusted (tampered if one wants to be more blunt) to make it fit their global warming theory. The raw unadjusted data suggests things have instead cooled, which better fits with the brutal winters Americans experienced for the past decade or so.

If the Sun does enter a grand minimum in the coming decades, I suspect it will become increasingly difficult for NOAA and NASA to continue their temperature adjustments and continue claiming things are getting warmer. At a minimum, we will learn something about the Sun and its behavior and its influence on the climate that we never knew before.

Sunspot update December 2018: Decline to solar minimum continues

Time for the monthly solar cycle update! NOAA today posted its monthly update of the solar cycle, covering sunspot activity for December 2018. As I do every month, I am posting it below, annotated to give it some context.

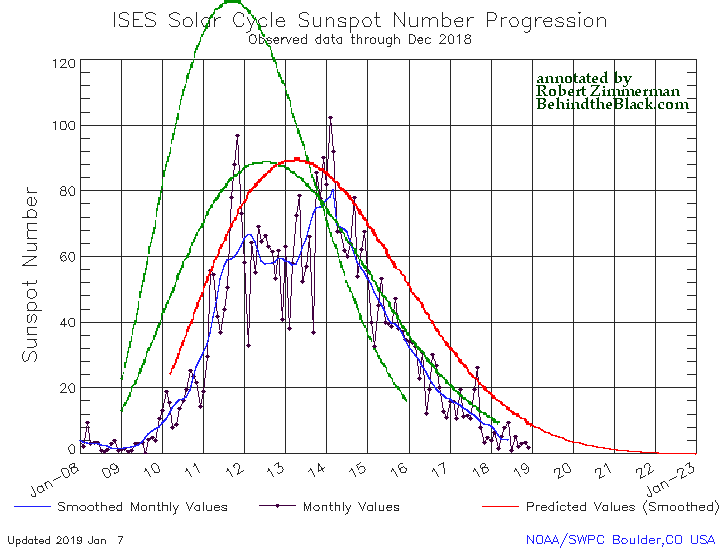
December 2018 sunspot activity

The graph above has been modified to show the predictions of the solar science community. The green curves show the community’s two original predictions from April 2007, with half the scientists predicting a very strong maximum and half predicting a weak one. The red curve is their revised May 2009 prediction.

There really isn’t much to say about the sunspot activity in December. It continued to show a steady decline to solar minimum, exhibiting activity very comparable to what we saw in mid-2008 when the previous unusually long and extended solar minimum began.

One interested detail however: When NOAA issued this graph last month, it finally extended it out beyond the end of 2019 to the end of 2022. In doing so, it also extended out the 2009 prediction of the solar science community, as indicated by the red curve. I hadn’t commented on this last month, but if you look at that curve it drops to zero and then flatlines for the entire year of 2022.

If this is what the solar science community now expects for this upcoming minimum, it means that community is now expecting a record-breaking minimum, lasting far longer than any previous minimum, two to three years at least. It also means that they have not dismissed the possibility that the Sun is about to enter a Grand Minimum, where no significant sunspot activity is seen for literally decades.

Should such a grand minimum occur, it bodes ill for global warming advocates. The track record of the Earth’s climate consistently shows that when sunspot activity declines, the global climate gets colder. Why this happens is not clearly understood, though there is at least one theory backed up by good experimental data. Should this happen, we shall discover that global cooling is a far worse thing to fear than global warming.

Sunspot update for July 2018: The Sun flatlines!

Yesterday NOAA posted its monthly update of the solar cycle, covering sunspot activity for July 2018. As I do every month, I am posting it below, annotated to give it some context.

This might be the most significant month of solar activity that has been observed since Galileo. Except for two very short-lived and very weak sunspots that observers hardly noted, the Sun was blank for entire month of July. This has not happened since 2009, during the height of the last solar minimum.

What makes this so significant and unique is that it almost certainly signals the return of the next solar minimum, a return that comes more than a year early. The solar cycle the Sun is now completing has only been ten years long. It is also one of the weakest in more than a hundred years. This combination is unprecedented. In the past such a weak cycle required a long cycle, not a short one.
» Read more

Sunspot update for April 2018: Heading into solar minimum

On Sunday NOAA posted its monthly update of the solar cycle, covering sunspot activity for April 2018. Below is my annotated version of that graph.

While there was an uptick in sunspots in April, compared to the almost complete inactivity in March (the least active month for sunspots in a decade), the uptick did little to change the general trend. Sunspot activity is now comparable to what we saw in early 2008 (as indicated by the yellow line). This was just before the arrival of the previous solar minimum, which happened to also be one of the longest and deepest on record.

» Read more

The first sunspots of the next solar cycle

In linking to my sunspot update this week, there has been a lot of speculation at the climate website WattsUpWithThat that the next solar cycle has begun.

Our resident solar physicist, Dr. Leif Svalgaard commented and provided a link to something reported by his colleagues, something that likely would not have been possible without the fantastic solar observations of NASA’s Solar Dynamic Observeratory (SDO). He said: “Cycle 25 has already begun. It looks to me that SC25 will be a bit stronger than SC24, so probably no Grand Minimum this time.” It seems a small sunspot has been observed, that has the opposite polarity of cycle 24 sunspots. [emphasis in original]

The speculation at WattsUpWithThat, which suggested that this sunspot was the first such sunspot this cycle, was not quite accurate however. This sunspot with an opposite polarity, which decayed so quickly that it did not rate getting a sunspot number, was not the first. This week the Solar-Terrestrial Centre of Excellence, a Belgian organization focused on space-solar science, published this very good article discussing not only this sunspot but two others, one of which occurred more than a year ago.
» Read more

Sunspot update for February 2018

It’s time for my monthly sunspot update. On Sunday NOAA posted its monthly update of the solar cycle, covering sunspot activity for February 2018. Below the fold is my annotated version of that graph.

Sunspot activity in February continued the low activity seen in November, December, and January, with November 2017 still the most inactive month for sunspots since the middle of 2009. In fact, the low activity we are seeing now is somewhat comparable to the low activity seen during the ramp down to solar minimum in the first half of 2008. By the end of that year we had hit solar minimum, the deepest and longest in a hundred years, suggesting that we might even hit solar minimum before the end of this year. That would have this happen at least a year earlier than all predictions.
» Read more

Sunspot update for September 2017

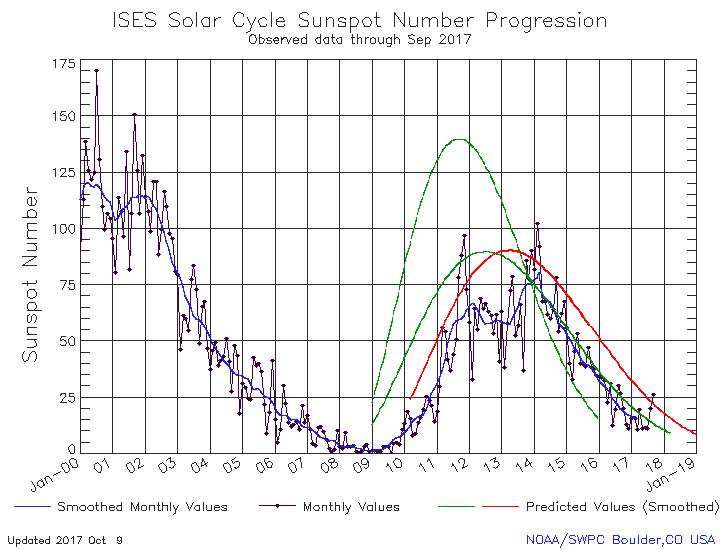
On Sunday NOAA posted its monthly update of the solar cycle, covering sunspot activity for September. That graph is posted below, with annotations.

September 2017 Solar Cycle graph

The graph above has been modified to show the predictions of the solar science community. The green curves show the community’s two original predictions from April 2007, with half the scientists predicting a very strong maximum and half predicting a weak one. The red curve is their revised May 2009 prediction.

Last month saw the strongest amount of sunspot activity in a year, thus helping to bring the pace in the decline of sunspot activity back towards the low prediction from April 2007. This also suggests that the ramp down to solar minimum will continue through 2019, with minimum not occurring before then, at the earliest. At the same time, the increase in sunspot activity seen in September seems to have eased in October, with the return of a blank Sun this past week.

Sunspot update for July 2017

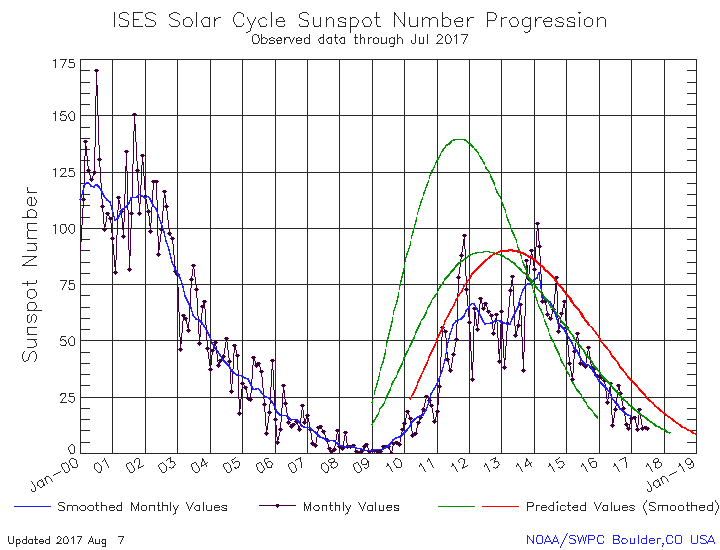
NOAA today posted its monthly update of the solar cycle, covering sunspot activity for July. As I have done every month since 2010, the graph is posted below, with annotations.

July 2017 Solar Cycle graph

The graph above has been modified to show the predictions of the solar science community. The green curves show the community’s two original predictions from April 2007, with half the scientists predicting a very strong maximum and half predicting a weak one. The red curve is their revised May 2009 prediction.

Sunspot activity in July remained almost exactly the same as in both May and June. This is the first indication that this cycle’s ramp down from solar maximum will follow the standard pattern of a slow and extended decline to minimum. Up until now the drop in sunspot activity has been as fast as the increase during ramp up. Historically the ramp down has instead been slower, sloping downward gently and over a much longer time period. The last few months suggest that this cycle’s end is beginning to resemble past cycles.

Meanwhile, a review of past solar cycles by German scientists suggests that a cyclical cooling period in the Sun’s output is coming, and that such ups and downs can be tracked in the solar record.

In order to elucidate the solar influence, we have used a large number of temperature proxies worldwide to construct a global temperature mean G7 over the last 2000 years. The Fourier spectrum of G7 shows the strongest components as ~1000-, ~460-, and ~190 – year periods whereas other cycles of the individual proxies are considerably weaker. The G7 temperature extrema coincide with the Roman, medieval, and present optima as well as the well-known minimum of AD 1450 during the Little Ice Age. We note that the temperature increase of the late 19th and 20th century is represented by the harmonic temperature representation, and thus is of pure multiperiodic nature. It can be expected that the periodicity of G7, lasting 2000 years so far, will persist also for the foreseeable future. It predicts a temperature drop from present to AD 2050, a slight rise from 2050 to 2130, and a further drop from AD 2130 to 2200. [emphasis mine]

Note that this prediction is not based on any real understanding of the Sun’s sunspot cycle or what causes any variations in its brightness. All they have done is extrapolate into the future the patterns of past fluctuations. This is as if a weatherman averaged how many times it normally rains in your town, and then predicted rain in the next few days merely by those averages. “It rains on average every three days, so because it rained yesterday expect no rain for the next two days!”

Nonetheless, the past fluctuations seem to follow a cyclical pattern, and thus also appear to confirm other studies that suggest we are heading towards another grand minimum, with no sunspots for decades, which also in the past corresponded with cooler global temperatures.

New data suggests Sun undergoing fundamental changes

The uncertainty of science: New data, when compared with similar data collected over decades, suggests the Sun’s solar cycle is undergoing some fundamental changes.

In work just published in the Monthly Notices of the Royal Astronomical Society, the team shows that the interior of the Sun has changed in recent years, and that these changes persist in the current cycle. In combination with theoretical models, the observations suggest that the magnetic field distribution in the outer layers may have become a bit thinner. Other seismic data shows that the rotation rate of the Sun has also undergone some changes in the way the Sun rotates at different latitudes.

“Again, this is not how it used to be and the rotation rate has slowed a bit at latitudes around about 60 degrees. We are not quite sure what the consequences of this will be but it’s clear that we are in unusual times. However, we are beginning to detect some features belonging to the next cycle and we can suggest that the next minimum will be in about two years,” says Elsworth.

First, they don’t know what will happen because of these changes. Second, their data confirms that the solar minimum will occur in about two years, which would make this cycle only 9 years long, one of the shortest but also one of the weakest that has been observed, two things that previously had never gone together.

Sunspot update for April 2017

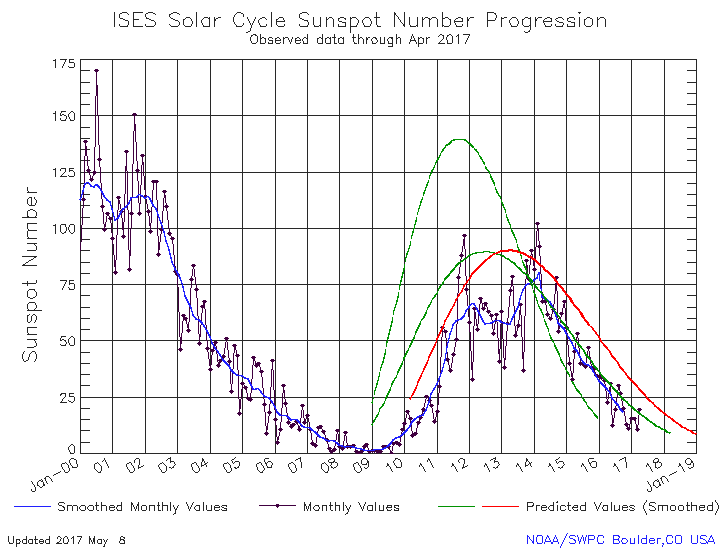
Today NOAA posted its monthly update of the solar cycle, covering sunspot activity for April. It is posted below, with annotations, as I have done now every month since 2010.

April 2017 Solar Cycle graph

The graph above has been modified to show the predictions of the solar science community. The green curves show the community’s two original predictions from April 2007, with half the scientists predicting a very strong maximum and half predicting a weak one. The red curve is their revised May 2009 prediction.

April showed an uptick in sunspot activity, enough to move the numbers back up above the 2007 low prediction. Nonetheless, activity as the cycle has been ramping down has consistently and generally remained below expectation, and does seem heading to an early arrival of solar minimum, sometime in late 2019 or early 2020, about a year early.

I don’t want to sound like a broken record, as I have written this practically every month since I started these updates in 2010, but this short and weak solar maximum suggests the possibility that we might be facing a grand minimum, where there are no significant sunspots for decades. Some solar scientists think this is coming. Others are much more doubtful. Regardless, we can only wait and watch, while also recognizing that weak solar maximums and grand minimums have in the past consistently coincided with global cool weather. The reasons why this has happened are not yet known, but it has happened nonetheless.

The longest stretch of no sunspots since 2009

The Sun just completed its longest stretch, 15 days, without sunspots since 2009, suggesting once again that the solar minimum is coming much sooner than expected.

So far this year the Sun has been blank 34% of the time, a pace that makes this year almost as blank as 2009, the year in which the previous solar minimum ended. This suggests that 2017 might be the year in which the next solar minimum begins, which would be about two years earlier than the earliest predictions.

The more likely scenario is that 2018 will be the year the solar minimum begins, with 2019 when solar activity bottoms out. This will still be much earlier than expected, making this solar cycle only about 9-10 years long. What makes this more significant is that historically short cycles always went with high activity, while long cycles signaled an inactive and weak maximum. This cycle will be the first that is both short and weak.

What happens next remains the big question. Will the Sun enter a grand minimum, with no sunspots for decades? Or will sunspot activity continue? Since solar scientists really do not yet understand the mechanism within the sun’s magnetic field that causes this solar cycle, we really can’t answer these questions, in advance. We must wait, and see.

Decline in sunspots continues

Late Sunday NOAA posted its monthly update of the solar cycle, covering sunspot activity for October. As I do every month, I am posting it here with annotations to give it context.

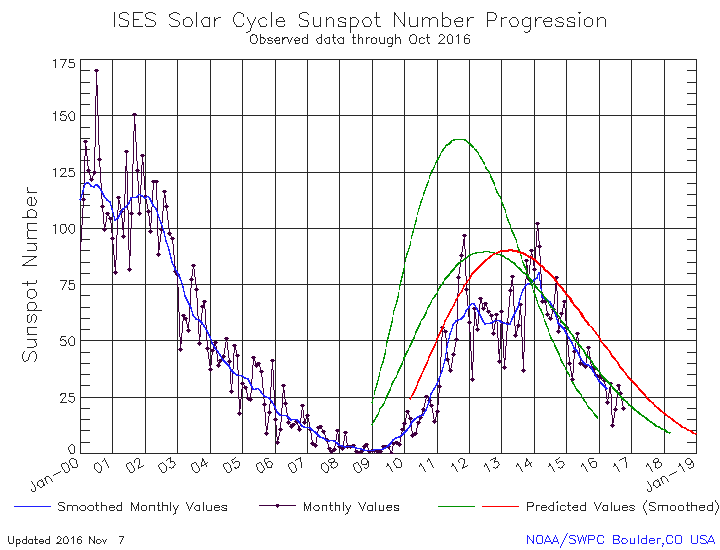
October 2016 Solar Cycle graph

The graph above has been modified to show the predictions of the solar science community. The green curves show the community’s two original predictions from April 2007, with half the scientists predicting a very strong maximum and half predicting a weak one. The red curve is their revised May 2009 prediction.

The sunspot decline continued in October, dropping the sunspot number for the month to below the 2007 low prediction. Though the decline continues to track that low prediction, the sunspot count for November has been even lower, suggesting that the ramp down to solar minimum will continue to under perform that prediction and will arrive at minimum sooner than expected. As I noted last month, this fast decline will also mean that the ending solar cycle will be a both a weak and a short cycle, two phenomenon that in the past never went together. In the past, a short cycle meant the maximum was strong, while a long cycle would correspond with a weak maximum.

The Sun continues to behave in a manner that is unprecedented, and suggests the possibility that a Grand Minimum might be coming.

Computer simulation models Sun’s magnetic field during grand minimum

The uncertainty of science: A computer simulation, run for six months on a supercomputer, suggests that during grand minimums in the Sun’s solar cycle, when there are no sunspots for decades, its magnetic field remains strong but descends into the star’s interior.

I think this statement by the leader of the science team is most informative:

‘The Sun as such is impossible to replicate on present-day computers – or those of the near future – due to its strong turbulence. And indeed we are not claiming that this modelling would really be the Sun. Instead, it is a 3D construction of various solar phenomena by means of which the star that runs our space climate can be better understood,’ Käpylä explains.

Sunspot activity crashes

The monthly NOAA update of the solar cycle was released yesterday, showing the Sun’s sunspot activity in April. It is annotated and posted below.

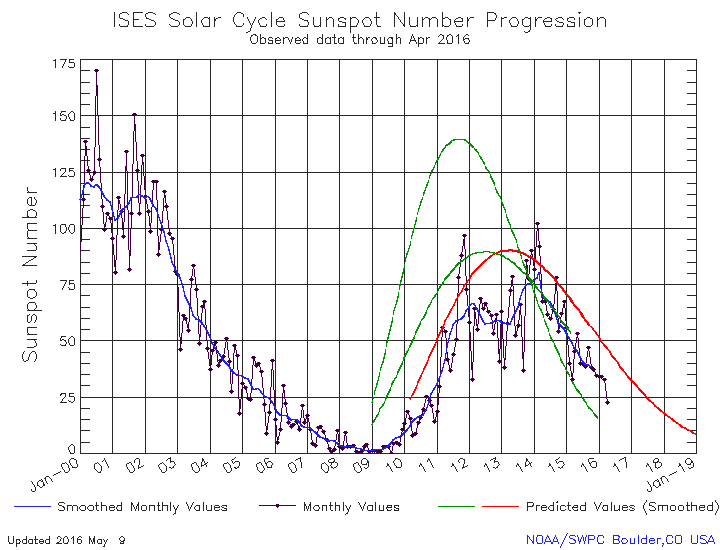
April 2016 Solar Cycle graph

The graph above has been modified to show the predictions of the solar science community. The green curves show the community’s two original predictions from April 2007, with half the scientists predicting a very strong maximum and half predicting a weak one. The red curve is their revised May 2009 prediction.

After four months of steady decline matched exactly with the low prediction from 2007 (the lower green line curve), in April sunspot activity plummeted to the lowest level seen since January 2011.

This decline shouldn’t surprise anyone. The now ending solar maximum has been the weakest in a century and, as noted here, it is now more than a year since the last X-class solar flare, the most powerful kind, with this solar maximum seeing only 45 X-class events, compared to 126 during the previous solar maximum.

As I have noted repeatedly, the big question now is what will happen during the next solar cycle. Will we get another weak solar cycle or will the sun’s sunspot activity recover? Or will sunspots vanish and will the sun enter a grand minimum, with no sunspots for decades? At the moment no one knows, though some solar scientists favor the latter.

Sunspot decline continues

NOAA’s monthly update of the solar cycle, showing the Sun’s sunspot activity in December, was posted earlier this week, and I am posting it here, as I do every month, with annotations to give it context.

The decline in sunspots continues, tracking closely the rate of decline predicted by the 2007 and 2009 predictions (the lower green curve and the red curve) but the overall solar maximum has been far shorter and less powerful than predicted.
» Read more

Sunspots continue predicted decline

On Sunday NOAA posted, as it does each month, its monthly update of the solar cycle, showing the Sun’s sunspot activity in November. And as I have done every month since 2010, I am posting it here, with annotations to give it context.

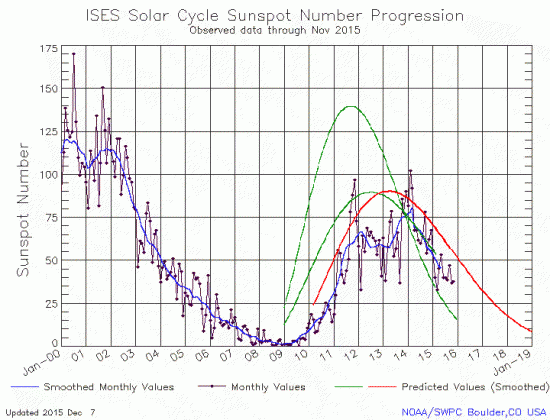
Though sunspot activity in November was just slightly higher than in October, the increase was so small that it is insignificant. Essentially, the overall decline in sunspot count continues, matching almost perfectly the ramp down predicted by the 2007 low prediction. Solar activity continues to be far weaker then anything seen in a century. Whether this suggests a coming Grand Minimum, however, is not known. Solar activity could continue to decline as we move into the next solar cycle, or it could recover. Our understanding of what causes the sunspot cycle remains somewhat fuzzy, which means our ability to predict what will happen next is as fuzzy..

November 2015 Solar Cycle graph

The graph above has been modified to show the predictions of the solar science community. The green curves show the community’s two original predictions from April 2007, with half the scientists predicting a very strong maximum and half predicting a weak one. The red curve is their revised May 2009 prediction.

Decline to solar minimum continues

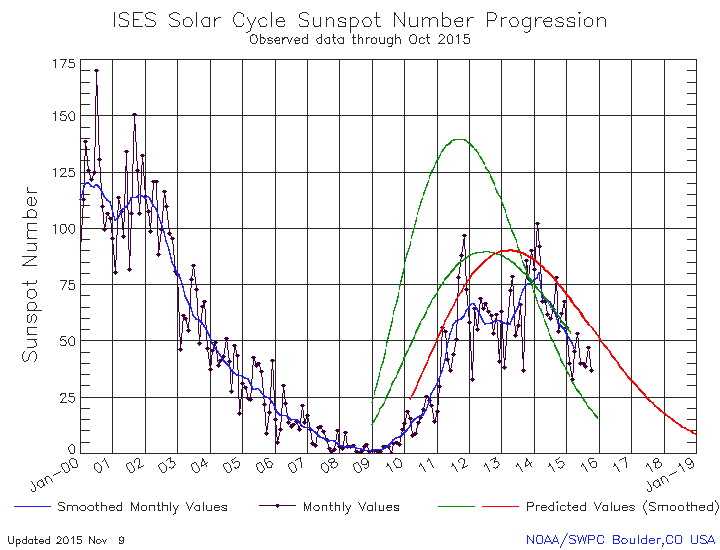
It’s that time again buckos! On Monday NOAA posted its monthly update of the solar cycle, showing the Sun’s sunspot activity in October. As I have done every month since 2010, I am posting it here, with annotations to give it context.

The decline in sunspot continue steadily, matching the red prediction curve except that, as it has for this entire solar maximum, the number of sunspots continues to be less than expected. Not only did the ramp up start later and not quite reach the levels predicted, the ramp down started early. Overall, this now ending solar maximum is the weakest in a century. The big question remains: Is the Sun about to head into its first Grand Minimum since the 1600s, or is this weak maximum a one-time event to be followed by stronger activity in later cycles.

No matter what anyone tells you, no one knows.

October 2015 Solar Cycle graph

The graph above has been modified to show the predictions of the solar science community. The green curves show the community’s two original predictions from April 2007, with half the scientists predicting a very strong maximum and half predicting a weak one. The red curve is their revised May 2009 prediction.

The sun goes boom!

It is always best to admit when you are wrong as soon as you find out. Last month, in reporting NOAA’s monthly update of the solar cycle, I unequivocally stated that

My interpretation of this data tells me that almost certainly the solar maximum has ended. We might see some later fluctuations whereby the sunspot number jumps, but the Sun is clearly beginning its ramp down to solar minimum.

Well, I spoke too soon. Last night NOAA posted the newest update of the solar cycle, and it shows that in October the Sun was more active then it has been in two years. In fact, for only the second time this entire solar cycle the Sun’s sunspot activity actually came close to matching the predictions of scientists. This month’s graph is posted below the fold, with annotations.
» Read more

The Sun has a maximum and no one notices

On July 8 NOAA released its monthly update of the Sun’s sunspot cycle, covering the period of June 2013. As I do every month, this graph is posted below, with annotations to give it context.

After a brief period of renewed but weak activity during the last three months, the Sun’s sunspot production has once again plunged, dropping back to the levels generally seen for most of 2012.

As predicted by some solar scientists, the Sun seems to have produced a double-peaked maximum, though the second peak appears at this time to have been remarkably wimpy and brief. It is still possible, however, that this second peak is not over and that we might see another burst of renewed activity in the next month or so, based on the Sun’s past behavior during the ending stages of the previous solar maximum in 2001 and 2002. Nonetheless, from all appearances it looks like the Sun has shot its load and is in the process of winding down from a solar maximum peak that occurred back late 2011.

What is especially fascinating about this is that when that peak occurred in 2011, no one noticed!
» Read more

1 2