Decline in sunspots continues

Late Sunday NOAA posted its monthly update of the solar cycle, covering sunspot activity for October. As I do every month, I am posting it here with annotations to give it context.

October 2016 Solar Cycle graph

The graph above has been modified to show the predictions of the solar science community. The green curves show the community’s two original predictions from April 2007, with half the scientists predicting a very strong maximum and half predicting a weak one. The red curve is their revised May 2009 prediction.

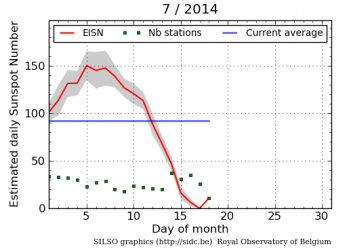
The sunspot decline continued in October, dropping the sunspot number for the month to below the 2007 low prediction. Though the decline continues to track that low prediction, the sunspot count for November has been even lower, suggesting that the ramp down to solar minimum will continue to under perform that prediction and will arrive at minimum sooner than expected. As I noted last month, this fast decline will also mean that the ending solar cycle will be a both a weak and a short cycle, two phenomenon that in the past never went together. In the past, a short cycle meant the maximum was strong, while a long cycle would correspond with a weak maximum.

The Sun continues to behave in a manner that is unprecedented, and suggests the possibility that a Grand Minimum might be coming.

Sunspot ramp down resumes

On Monday NOAA posted its monthly update of the solar cycle. I am posting it here, as I do every month, with annotations to give it context.

September 2016 Solar Cycle graph

The graph above has been modified to show the predictions of the solar science community. The green curves show the community’s two original predictions from April 2007, with half the scientists predicting a very strong maximum and half predicting a weak one. The red curve is their revised May 2009 prediction.

After two months of increased sunspot activity, the decline in sunspots resumed in September, though activity did not drop significantly. Overall though, the ramp down towards the next solar minimum continues to track quite closely the ramp down predicted by weak prediction made by half the solar science community back in 2007 (the lower green curve above). These scientists however do not have much to brag about. Their same prediction completely missed the ramp up, which happened a year later than predicted, as well as the activity peak, which was far weaker than predicted.

In fact, the ramp down now continues to point to the possibility that this very weak solar cycle will also be a very short one, something that is quite unprecedented, and suggests that we might be seeing the lead in to another Grand Minimum, where there are no sunspots for decades. Since no one understands yet exactly why such grand minimums happen, however, this remains pure speculation. We will only find out by watching what happens, as it happens.

Sunspots: A recovery in August

NOAA’s monthly update of the solar cycle was posted today. As I do every month, I am posting it here, with annotations to give it context.

August 2016 Solar Cycle graph

The graph above has been modified to show the predictions of the solar science community. The green curves show the community’s two original predictions from April 2007, with half the scientists predicting a very strong maximum and half predicting a weak one. The red curve is their revised May 2009 prediction.

The recovery in sunspot activity that began in July continued in August. The number of sunspots increased enough to once again raise the overall curve up to match the green curve of the 2007 weak prediction. Even so, this solar maximum remains far weaker than the weakest prediction. Also, this solar maximum, which started later than all the predictions, looks like it will be far shorter than all the predictions. As I have noted previously, this is counter to all previous solar cycles, where it is the more active cycles that are shorter and the weaker cycles are longer. Here, we are getting a weak cycle that is also short, which once again suggests that we are seeing solar behavior previously unobserved. The solar cycle is doing things it hasn’t done since scientists began studying it closely after Galileo.

Sunspot ramp down continues

Below is NOAA’s monthly update of the solar cycle, posted by them on August 7. It shows the Sun’s sunspot activity in July, with annotations.

July 2016 Solar Cycle graph

The graph above has been modified to show the predictions of the solar science community. The green curves show the community’s two original predictions from April 2007, with half the scientists predicting a very strong maximum and half predicting a weak one. The red curve is their revised May 2009 prediction.

As expected, there was a recovery in sunspot activity in July compared to June. Also as expected, the recovery was not significant, so that it appears, based on the past two months, as if the ramp down to solar minimum is accelerating so that solar minimum will occur sooner than expected, possibly as soon as two years.

I would not put much stock on that prediction, however. When sunspot activity first reached this level during the past solar cycle in late 2005, it still took three more years before solar minimum was reached. If this cycle matches the last, that would mean that this cycle, from minimum to minimum, will have lasted 10 years, making a short solar cycle though not one of the shortest. However, it is more likely that the ramp down will stretch out, as it usually does, gliding downward to solar minimum in a slow gentle curve that makes for a full cycle of about 11 years.

The Sun is blank again

More signs that we are easing down to solar minimum: After a period of two weeks of sunspots, the Sun has once again gone blank.

It takes the Sun’s about four weeks to rotate and complete one “day”. What has essentially happened is that right now one face of the Sun is blank while the other face has sunspots. For two weeks, from the last week in June to the first week in July, the blank face was turned towards the Earth. Then the face with sunspots rotated into view for two weeks, and now the blank face has rotated back to face us.

Though new sunspots can always form on either face, I expect this blank stretch to last a few days, at least.

A short but weak solar maximum?

On July 4th NOAA released its monthly update of the solar cycle, showing the Sun’s sunspot activity in June. It is annotated and posted below.

June 2016 Solar Cycle graph

The graph above has been modified to show the predictions of the solar science community. The green curves show the community’s two original predictions from April 2007, with half the scientists predicting a very strong maximum and half predicting a weak one. The red curve is their revised May 2009 prediction.

Not surprisingly, the time periods with no sunspots in June, including a 12 day stretch that just ended today, is reflected by the graph’s precipitous drop in June.

What is significant to me is the speed with which this solar maximum seems to be ending. Normally, weak solar cycles are also long solar cycles. The Sun not only doesn’t get as active, but the ramp up and down is extended, as is the period of the solar minimum. This is what happened during the solar minimum from 2007 to 2010. It was longer than normal, which meant that the solar maximum occurred much later than predicted by the 2007 predictions of the solar science communities (shown in green).

This recent stretch of blank days however is now suggesting that the solar maximum is going to end much sooner than the later 2009 prediction (shown in red). Even more astonishing, the numbers in June aligned with the 2007 high prediction, which would make this one of the shortest solar maximums on record!

I don’t expect these low numbers to continue. I expect sunspot activity to recover and continue, with the minimum likely occurring after 2018. If it does come sooner, however, that will once again be evidence suggesting we are heading for a Grand Minimum, with no sunspots for decades.

Sunspot cycle update

NOAA today released its monthly update of the solar cycle, showing the Sun’s sunspot activity in May. It is annotated and posted below.

Mayl 2016 Solar Cycle graph

The graph above has been modified to show the predictions of the solar science community. The green curves show the community’s two original predictions from April 2007, with half the scientists predicting a very strong maximum and half predicting a weak one. The red curve is their revised May 2009 prediction.

Though sunspot activity increased in May, the increase was not significant. The ramp down from solar maximum continues to track the 2007 low prediction for this maximum.

Meanwhile, the Sun continues its first multi-day string of blank days since 2011, now up to 3 days with all indications suggesting it will continue at least one more day. This early blank string, combined with the relatively fast decline in sunspots in the past two years, suggests that the solar maximum is ending sooner than predicted by the 2009 prediction (the red curve above), and that the next minimum will possibly be longer as well.

No sunspots for the first time in two years

For the first time since July 17, 2014, and only the second time since 2011 at the beginning of the solar maximum, the Sun was blank today, with no sunspots visible on its surface.

I expect the next monthly update of the solar cycle will arrive early next week, and though I expect it will show a slight increase during the past month, it will also show that the ramp down to solar minimum is continuing unabated.

Sunspot activity crashes

The monthly NOAA update of the solar cycle was released yesterday, showing the Sun’s sunspot activity in April. It is annotated and posted below.

April 2016 Solar Cycle graph

The graph above has been modified to show the predictions of the solar science community. The green curves show the community’s two original predictions from April 2007, with half the scientists predicting a very strong maximum and half predicting a weak one. The red curve is their revised May 2009 prediction.

After four months of steady decline matched exactly with the low prediction from 2007 (the lower green line curve), in April sunspot activity plummeted to the lowest level seen since January 2011.

This decline shouldn’t surprise anyone. The now ending solar maximum has been the weakest in a century and, as noted here, it is now more than a year since the last X-class solar flare, the most powerful kind, with this solar maximum seeing only 45 X-class events, compared to 126 during the previous solar maximum.

As I have noted repeatedly, the big question now is what will happen during the next solar cycle. Will we get another weak solar cycle or will the sun’s sunspot activity recover? Or will sunspots vanish and will the sun enter a grand minimum, with no sunspots for decades? At the moment no one knows, though some solar scientists favor the latter.

The sunspot decline continues

NOAA’s monthly update of the solar cycle was released today, showing the Sun’s sunspot activity in March. It is annotated and posted below.

March 2016 Solar Cycle graph

The graph above has been modified to show the predictions of the solar science community. The green curves show the community’s two original predictions from April 2007, with half the scientists predicting a very strong maximum and half predicting a weak one. The red curve is their revised May 2009 prediction.

For the fourth month in a row the change in the graph is so small you almost need a magnifying glass to see it. Despite this, the decline remains remarkably steady, tracking precisely the decline predicted by the low prediction of the 2007 predictions (indicated by the smaller green line curve).

Recently the number of sunspots has dropped enough that I suspect we are not far the moment when we will once again begin to see days where the Sun is blank of sunspots, a situation last seen in 2010 near the end of the previous solar minimum. When that happens, it will herald the beginning of the next solar minimum.

Monthly Solar Cycle update

NOAA released on Monday its monthly update of the solar cycle, showing the Sun’s sunspot activity in February. I am once again posting it here on Behind the Black, as I have done monthly since 2010.

February 2016 Solar Cycle graph

The graph above has been modified to show the predictions of the solar science community. The green curves show the community’s two original predictions from April 2007, with half the scientists predicting a very strong maximum and half predicting a weak one. The red curve is their revised May 2009 prediction.

The change in this month’s graph is so small that you will have to look real close to see it. Essentially, the February sunspot activity dropped only a tiny amount from January’s numbers, though it did drop. As such the decline from solar maximum continues to track perfectly the decline predicted by the low prediction of the 2007 predictions. This prediction success should not be taken very seriously, however, since that same prediction expected the solar maximum to begin two years earlier than it actually did.

The long decline to solar minimum

On Monday NOAA released its monthly update of the solar cycle, showing the Sun’s sunspot activity in January. As I have done every month since 2010, I am posting it here with annotations to give it context.

What strikes me about this month’s continuing and steady decline in sunspots is how much it illustrates the long and steady nature of the ramp down to solar minimum, even for cycles that are very active. If you look at the ramp down during the previous solar cycle on the graph below the fold, it took four full years to reach solar minimum from a comparable sunspot level to what we have today.
» Read more

Sunspot decline continues

NOAA’s monthly update of the solar cycle, showing the Sun’s sunspot activity in December, was posted earlier this week, and I am posting it here, as I do every month, with annotations to give it context.

The decline in sunspots continues, tracking closely the rate of decline predicted by the 2007 and 2009 predictions (the lower green curve and the red curve) but the overall solar maximum has been far shorter and less powerful than predicted.
» Read more

Sunspots continue predicted decline

On Sunday NOAA posted, as it does each month, its monthly update of the solar cycle, showing the Sun’s sunspot activity in November. And as I have done every month since 2010, I am posting it here, with annotations to give it context.

Though sunspot activity in November was just slightly higher than in October, the increase was so small that it is insignificant. Essentially, the overall decline in sunspot count continues, matching almost perfectly the ramp down predicted by the 2007 low prediction. Solar activity continues to be far weaker then anything seen in a century. Whether this suggests a coming Grand Minimum, however, is not known. Solar activity could continue to decline as we move into the next solar cycle, or it could recover. Our understanding of what causes the sunspot cycle remains somewhat fuzzy, which means our ability to predict what will happen next is as fuzzy..

November 2015 Solar Cycle graph

The graph above has been modified to show the predictions of the solar science community. The green curves show the community’s two original predictions from April 2007, with half the scientists predicting a very strong maximum and half predicting a weak one. The red curve is their revised May 2009 prediction.

Solar ramp down jumps slightly

My original post about NOAA’s October update to its monthly tracking of the Sun’s sunspot cycle contained an incorrect graph. For reasons I do not understand, the first graph they posted did not include the data for September, thus creating for me the illusion that little had changed in September. I am now posting the correct graph here, below the fold, with annotations to give it context.

In September numbers showed a slight jump in sunspot activity, though once again nothing so significant as to change the overall trends. Moreover, the correction doesn’t change what I wrote previously in any way: the rate of decline seems to have transitioned down from the 2009 prediction (red curve) to the 2007 weak prediction (lower green curve). This doesn’t real mean much, as the sunspot number can still vary up and down considerable before we reach solar minimum in two or three years.

» Read more

Ramp down in sunspots continues

Correction! For reasons I do not understand, the graph below, originally posted on the NOAA website, was incorrect and was changed several days after I posted my piece below. See this post for the correct graph and analysis.

The uncertainty of science: On Monday NOAA posted its monthly update of the solar cycle, showing the Sun’s sunspot activity in September. Once again I post it here, below the fold, with annotations to give it context.

For the third month in a row the sunspot count dropped a tiny amount, lingering at about the same number as the previous two months. Moreover, the rate of decline seems to have transitioned down from the 2009 prediction (red curve) to the 2007 weak prediction (lower green curve). This doesn’t real mean much, as the sunspot number can still vary up and down considerable before we reach solar minimum in two or three years.

» Read more

Decline to solar minimum

Last week NOAA posted its monthly update of the solar cycle, showing the Sun’s sunspot activity in August. As I have done every month since 2010, I am posting it here, below the fold, with annotations to give it context.

The sunspot count continued its decline, though dropping only a small amount. Regardless, the decline continues at a rate far faster than predicted or is usual during the ramp down from solar maximum. If this rate of decline should continue, we will reach solar minimum sometime late in 2017, two years earlier than predicted (as indicated by the red curve).

» Read more

Ramp down to solar minimum continues

On Sunday NOAA posted its monthly update of the solar cycle, showing the Sun’s sunspot activity in May. As I have done since 2010, I am posting it here, with annotations to give it context.

May 2015 Solar Cycle graph

The graph above has been modified to show the predictions of the solar science community. The green curves show the community’s two original predictions from April 2007, with half the scientists predicting a very strong maximum and half predicting a weak one. The red curve is their revised May 2009 prediction.

Sunspot activity once again increased in May, though it continues to remain below the 2009 prediction of activity. Though it is still early in the ramp down, a look at the present pattern suggests that (as I also noted last month) sunspot activity is declining much faster than normal. In the past, the ramp down after solar maximum was long and drawn out, while ramp up was much faster. This ramp down seems much more precipitous than past solar cycles.

I should add that in early April Sunspot Index and Long-term Solar Observations (SILSO) had declared that the peak of the solar maximum had occurred in April 2014, and that they could now sum up the overall weakness of this maximum.

Cycle 24 proves to be 30% weaker than the previous solar cycle, which reached 119.7 in July 2000, and thus belongs to the category of moderate cycles, like cycles 12 to 15, which were the norm in the late 19th and early 20th century. Compared to strong cycles, such cycles typically feature a broader maximum, with a 3-year plateau on top of which two or more surges of activity can produce sharp peaks of similar height.

I had missed this announcement when it was first posted. It is worth noting however, especially since their discussion in April is interesting to read in the context of what has happened since.

The Sun drifts downward

NOAA today posted its monthly update of the solar cycle, showing the Sun’s sunspot activity in April. As always, I am posting it here, with annotations to give it context, as I have done since 2010.

April 2015 Solar Cycle graph

The graph above has been modified to show the predictions of the solar science community. The green curves show the community’s two original predictions from April 2007, with half the scientists predicting a very strong maximum and half predicting a weak one. The red curve is their revised May 2009 prediction.

Though sunspot activity increased in April, it remained well below the predicted numbers from the 2009 prediction, as has sunspot activity generally done for this entire solar cycle.

Note that if you extrapolate the red curve of the 2009 prediction down to its end you find that the solar minimum was predicted to occur sometime after 2020. Based on the rate of activity we have seen for the past year, it is very possible that the minimum will occur sooner, and will likely last longer.

But then again, the sun does what the sun wants to do. We don’t exactly understand the root causes of the solar cycle, and can only watch it unfold time after time as we try to peel back its mysteries.

Sunspots crash in February


NOAA today posted its monthly update of the solar cycle, showing the sunspot activity for the Sun in February. As I have done monthly for the past five years, I am posting it here below the fold, with annotations to give it context.

In the past two months I have noted how the ramp down from solar maximum has closely tracked the 2009 prediction of the solar scientist community (indicated by the red curve).

In February, however, that close tracking ended, with sunspots plunging far below the prediction. Note also that sunspot activity in March has also been weak.

» Read more

The sunspot cycle update for December

The monthly update by NOAA of the solar cycle, showing the sunspot activity for the Sun in December, was released this past weekend. As I do every month, I am posting it here, below the fold, with annotations to give it context.

Even though sunspot activity in December increased, the slow ramp down to solar minimum continues to track the 2009 prediction of the solar scientist community. The overall intensity of the solar maximum prior to 2014 was considerable less than this prediction, but the numbers throughout 2014 matched that prediction remarkably well.
» Read more

Solar minimum to limit interplanetary manned flights?

A new study suggests that the increased cosmic radiation reaching the inner solar system because of the Sun’s weak sunspot activity will increase the exposure to dangerous radiation levels for interplanetary astronauts, thus limiting mission lengths to about one year.

The new research finds that, during periods of low solar activity, a 30-year-old astronaut can spend roughly one year in space—just enough time to get to Mars and back—before the constant bombardment by cosmic rays pushes the risk of radiation-induced cancer above current exposure limits.

If the sun’s activity continues to weaken as many scientists predict, the number of days humans could spend in deep space before reaching their exposure limit could decrease by about 20 percent, making future crewed space flight more dangerous, according to the new study accepted for publication in Space Weather, a journal of the American Geophysical Union.

The numbers were worse for women, whose exposure would become dangerous in only 300 days, according to the study.

A reviving solar maximum

Last week NOAA posted its monthly update of the solar cycle, showing the sunspot activity for the Sun in September. As I do every month, I am posting it here, below the fold, with annotations to give it context.

As much as I am always willing to point out the errors and foibles of scientists when they get something wrong or overstate their conclusions, I also believe it right to give credit when credit is due. I have been saying for several years now that the prediction of the solar scientist community, indicated by the red curve in the graph below the fold, had seriously overstated the Sun’s sunspot production during this solar maximum.

Well, it now appears that, as the solar cycle continues to run its course, that their May 2009 prediction is becoming increasingly correct.
» Read more

The solar maximum lingers on

On Monday NOAA posted its monthly update of the solar cycle, showing the sunspot activity for the Sun in August. As I do every month, I am posting it here, below the fold, with annotations to give it context.

The sunspot activity of the Sun in August hovered at the same levels seen in July. Though the month had seen periods of little activity, these were interspersed with many violent flaring sunspots, including one that only yesterday unleashed a powerful X-class flare that is expected to send a coronal mass ejection directly at the Earth and should impact the Earth’s magnetic field on September 12. Expect spectacular auroras!
» Read more

The lingering weak solar maximum

On Monday NOAA posted its monthly update of the solar cycle, showing the sunspot activity for the Sun in July. As I do every month, I am posting it here, below the fold, with annotations to give it context.

For the first time in four months the decline in sunspots ceased, though the sunspot count hardly rose either. Instead the numbers stayed almost the same in July as they were in June. This was during a month that began with lots of sunspots, and yet saw the first blank sun in almost three years. In fact, the Sun’s activity in July was a roller coaster, as noted by the Solar Influences Data Analysis Center (SIDC) of the Royal Observatory of Belgium.
» Read more

The first blank Sun since 2011

No sunspots on July 17, 2014

For the first time since August 14, 2011, the Sun showed no sunspots on its surface today. It started the day, July 17, 2014, with one small sunspot, but that spot apparently decayed away by the end of the day, as indicated by the fact that the sunspot number for the day was listed as zero, the first time that has happened since the solar maximum ramp up began in 2011.

This is strong evidence that the ramp down to solar minimum is beginning.

1 2 3 4