Solar Orbiter takes closest image of Sun so far

Solar Orbiter's closest image of the Sun, so far
Click for full interactive image, where you can zoom in, a lot.

Cool image time! The European Space Agency (ESA) yesterday released several new images from its Solar Orbiter probe, taken when the spacecraft made its most recent closest approach of the Sun.

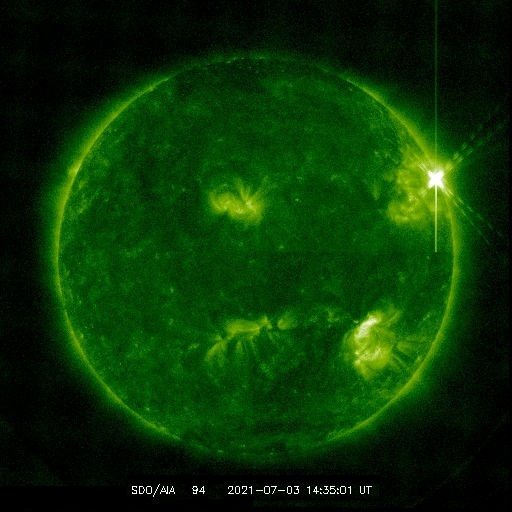
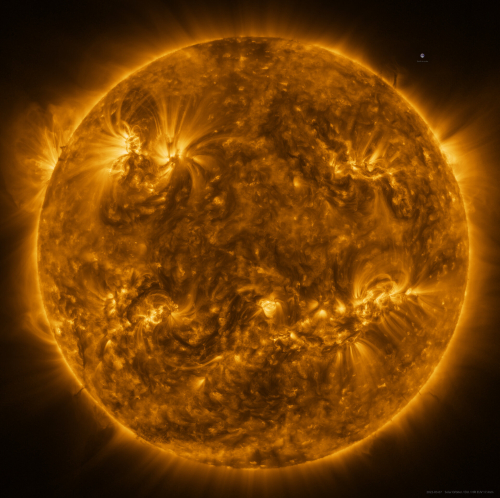
One of the images, taken by the Extreme Ultraviolet Imager (EUI) is the highest resolution image of the Sun’s full disc and outer atmosphere, the corona, ever taken.

Another image, taken by the Spectral Imaging of the Coronal Environment (SPICE) instrument represents the first full Sun image of its kind in 50 years, and by far the best one, taken at the Lyman-beta wavelength of ultraviolet light that is emitted by hydrogen gas.

The images were taken when Solar Orbiter was at a distance of roughly 75 million kilometres, half way between our world and its parent star. The high-resolution telescope of EUI takes pictures of such high spatial resolution that, at that close distance, a mosaic of 25 individual images is needed to cover the entire Sun. Taken one after the other, the full image was captured over a period of more than four hours because each tile takes about 10 minutes, including the time for the spacecraft to point from one segment to the next.

The photo to the right, reduced to post here, is the EUI photo.

Solar Orbiter has been in its science orbit since November, though that orbit over time will slowly be adjusted to swing the spacecraft into a higher inclination so that it can make the first close-up observations of the Sun’s polar regions. It is also working in tandem with the Parker Solar Probe, which observes the Sun from even closer distances using different instruments.

Solar scientist Eugene Parker passes away at 94

R.I.P. Solar scientist Eugene Parker, whose research revolutionized solar science in the 20th century and for which the Parker Solar Probe was named, has passed away at the age 94.

As a young professor at the University of Chicago in the mid-1950s, Parker developed a mathematical theory that predicted the solar wind, the constant outflow of solar material from the Sun. Throughout his career, Parker revolutionized the field time and again, advancing ideas that addressed the fundamental questions about the workings of our Sun and stars throughout the universe.

Parker belonged to the past generations of scientists who followed the principles of the Enlightenment and believed that science was fundamentally the search for truth. He understood he could always be wrong, which brought a certain muscular strength to any ideas he proposed. He could not be lazy in any way, or his work would fail. Instead, it shone, and made what little we know of the Sun today possible.

Sadly, such men are one-by-one going from us. I wonder if the new generations will understand his mindset.

Sunspot update: The Sun rages on

Time for my monthly sunspot cycle update, where I take NOAA’s monthly graph showing the long term trends in the Sun’s sunspot activity, and annotate it with additional data to provide some context.

The trend of sunspot activity exceeding the predictions continued in February. While the increase in activity from January still left it less than the activity in December, the total number of sunspots is still far above the number predicted by NOAA’s panel of solar scientists in 2020, with the rise towards a solar maximum also much steeper and far faster than predicted.
» Read more

Sunspot Update: The Sun quiets down, but just a little

With the posting yesterday by NOAA of its monthly update to its graph showing the long term trends in the Sun’s sunspot activity, it is time for me to do my own update, showing this graph below with annotations in order to provide some context.

While sunspot activity dropped slightly in January, the activity still remained well above the prediction made by NOAA’s panel of solar scientists in 2020, with the upward trend towards a solar maximum much steeper than predicted as well.
» Read more

Sunspot update: The Sun blasts off!

Over the weekend NOAA posted its monthly update to its graph showing the long term trends in the Sun’s sunspot activity. As I do every month, I have posted that graph below, annotated to show the previous solar cycle predictions and thus provide context.

In December the Sun’s sunspot activity not only continued the pattern of the past two years — whereby sunspot activity has consistently exceeded the prediction of NOAA’s solar scientist panel — the amount of activity shot up like a rocket. December 2021 saw the most sunspots in a single month since September 2015, when the Sun was about a third of the way into its ramp down from the solar maximum in 2014.

» Read more

Scientists confirm Parker entered Sun’s corona in April 2021

Scientists yesterday announced that the Parker Solar Probe successfully entered the Sun’s corona for the first time during its April 2021 close fly-by.

More information here, including some excellent short movies made from images created by Parker’s instruments.

The top edge of the corona is dubbed the Alfvén surface, and Parker’s passage across that boundary three different times during the April ’21 fly-by revealed it to be a sharp boundary that also has a great deal of topography. From the second link:

The first time Parker passed the Alfvén surface was the longest; it flew through the atmosphere for about five hours. Even as it continued flying toward the Sun, though, it popped back out, only to submerge again more deeply when it was at its closest approach — but briefly, that time exiting after just half an hour. Then, on its way outward, the spacecraft once again skimmed beneath the surface for a few hours.

“[The Alfvén surface] has to be wrinkly,” Kasper says. “It’s not fuzzy — it’s well-defined while we’re under it — but the surface has some structure to it.” So while the probe sees a smooth change in conditions while crossing the boundary, where the boundary is can change. The reason for this wrinkly surface is still an open question, though the researchers suspect the crossing over a pseudostreamer lower in the corona pushed the boundary out to enable the first crossing.

What’s clear is that inside the Sun’s atmosphere, conditions are different than just outside. Parker saw plasma waves moving back and forth instead of flowing outward. That difference was visible not just to the SWEAP and FIELDS instruments, which measure particles and electric and magnetic fields, respectively, but also to the probe’s WISPR imager.

The Parker science team also indicated that the preliminary data from the probe’s next two fly-bys — the most recent in November that was the closest yet — suggest it passed through the corona then as well.

One of the biggest unsolved mysteries about the Sun’s corona is that it appears to have a temperature in the millions of degrees, far hotter than the Sun’s surface below, something that is counter-intuitive. The expectation was that the atmosphere would be cooler than the surface. Finding out why the corona is hotter is one of the main science goals of Parker. It appears the probe is finally gathering data that might help solve that mystery.

Sunspot update: Sun continues to be more active than predicted

Time for our monthly sunspot update, using NOAA’s most recent monthly graph of sunspot activity. That graph is below, annotated to show the previous solar cycle predictions and thus provide context. It covers all activity through the month of November.

The pattern for the past two years since the end of the solar minimum continues, with sunspot activity consistently exceeding the prediction of NOAA’s panel of solar scientists, as indicated by the red curve. The activity in November dropped very slightly from October, but remained more active than the prediction.

» Read more

Europe’s Solar Orbiter to make last flyby of Earth

Solar Orbiter, the European Space Agency’s (ESA) probe to work in tandem with NASA Parker Solar Probe in studying the inner regions surrounding the Sun, will make last flyby of Earth on November 27, 2021, thus putting it into its planned science orbit.

While the press release gives a good overview of the mission, it focuses on the risk during that fly-by of the spacecraft hitting something during its close approach.

Solar Orbiter’s Earth flyby takes place on 27 November. At 04:30 GMT (05:30 CET) on that day, the spacecraft will be at its closest approach, just 460 km above North Africa and the Canary Islands. This is almost as close as the orbit of the International Space Station.

The manoeuvre is essential to decrease the energy of the spacecraft and line it up for its next close pass of the Sun but it comes with a risk. The spacecraft must pass through two orbital regions, each of which is populated with space debris.

The first is the geostationary ring of satellites at 36 000 km, and the second is the collection of low Earth orbits at around 400 km. As a result, there is a small risk of a collision. Solar Orbiter’s operations team are monitoring the situation very closely and will alter the spacecraft’s trajectory if it appears to be in any danger.

While there is a risk, it seems to me that ESA is taking advantage of the recent news outburst in connection with the Russian anti-sat test and the space junk it created to sell this mission. The risk of impact during this fly-by is very low, especially in the geostationary ring.

Sunspot update: Sun continues its higher than predicted activity

With the beginning of a new month comes my monthly sunspot update, based on NOAA’s most recent monthly graph of sunspot activity. That graph is below, annotated to show the previous solar cycle predictions and thus provide context. It has now been extended from last month to include the Sun’s sunspot activity in October.

Sunspot activity in October continued to be higher than predicted, though the month saw a slight drop from September. Even so, the number of sunspots seen on the Sun’s facing hemisphere in October were the most since August of 2016, when the Sun was ramping down to solar minimum.

» Read more

Major solar flare from the Sun

X-1 solar flare
The flare is the bright spot, center bottom. Click for original image.

The Sun today unleashed an X1-class solar flare, one of the more powerful seen since the ramp up to solar maximum began at the start of 2020.

More information here, with this quote:

The blast also hurled a CME [coronal mass ejection] into space. Coronagraph images are not yet available, but evidence for a CME is already pursuasive [sic]. The USAF reports strong Type II and Type IV radio emissions generated by a CME plowing through the sun’s atmosphere. In addition, energetic particles accelerated at the leading edge of a CME have already reached Earth.

When will the CME itself arrive? Assuming that it is Earth directed, probably on Oct. 30th or 31st. Fresh data from SOHO coronagraphs will allow a more precise forecast, so stay tuned.

During the flare, a pulse of X-rays and extreme UV radiation ionized the top of Earth’s atmosphere, causing a strong shortwave radio blackout centered on South America:

Aviators, mariners, and ham radio operators on the daylit side of Earth may have noticed strange propagation effects at frequencies below 30 MHz.

While this flare is unlikely to cause any significant disturbances to orbiting or Earth-based technology, the flare was emitted by a large sunspot that is still active, can still flare again, and is well positioned on the Sun to send more material and radiation Earthward.

Parker probe completes fifth Venus flyby

The Parker Solar Probe on October 16th successfully completed its fifth flyby of Venus, designed to lower its solar orbit around the Sun.

At just after 5:30 a.m. EDT, moving about 15 miles (24 kilometers) per second, the spacecraft swooped 2,370 miles (3,814 kilometers) above Venus’ surface. Such gravity assists are essential to the mission to bring Parker Solar Probe progressively closer to the Sun; the spacecraft counts on the planet to reduce its orbital energy, which in turn allows it to travel closer to the Sun and measure the properties of the solar wind near its source.

This was the fifth of seven planned Venus gravity assists. The flyby reduced Parker Solar Probe’s orbital speed by about 6,040 miles per hour (9,720 kilometers per hour), and set it up for its 10th close pass (or perihelion) by the Sun, on Nov. 21.

Parker Solar Probe will break its own distance and speed records on that closest approach, when it comes approximately 5.3 million miles (8.5 million kilometers) from the Sun’s surface — some 1.2 million miles (1.9 million kilometers) closer than the previous perihelion on Aug. 13 – while reaching 101 miles (163 kilometers) per second, or 364,621 miles per hour. Assisted by two more Venus flybys, in August 2023 and November 2024, Parker Solar Probe will eventually come within 4 million miles (6.2 million kilometers) of the solar surface in December 2024.

That speed record, 364,621 miles per hour, is the fastest any human built object as ever traveled.

Sunspot update: The boom in sunspots returns!

It is time for my monthly sunspot update, based on the most recent NOAA monthly graph, showing the changes in the Sun’s sunspot activity during September. That graph is below, annotated to show the previous solar cycle predictions and thus provide context.

In September sunspot activity boomed once again, producing the most sunspots in a month since 2016 and ending the slight drop in activity in August to return to the pattern the Sun has exhibited since the end of solar minimum. Consistently the number of sunspots on the visible hemisphere of the Sun since 2020 has exceeded the April 2020 prediction of the NOAA scientist panel, as indicated by the red curve in the graph.

» Read more

Sunspot update: Activity declines in August to just above prediction

On September 1st NOAA released its update of its monthly sunspot cycle graph, showing the Sun’s sunspot activity for the past month. That graph is below, annotated to show the previous solar cycle predictions and thus provide context.

In August sunspot activity dropped from July so that it was only slightly above the prediction of NOAA’s panel of solar scientists, as indicated by the red curve. The blank streak at the very end of July ended on August 2nd (a streak of seven days and the longest in years), but was followed during the month by an additional five blank days.

» Read more

Two flybys of Venus set by two spacecraft on August 9th and 10th

Two European planetary probes, one launched to study the inner solar enviroment and the second to study Mercury, are going to fly past Venus only 33 hours apart on August 9th and 10th.

Solar Orbiter, a partnership between ESA and NASA, will fly by Venus on 9 August with a closest approach of 7995 km at 04:42 UTC. Throughout its mission it makes repeated gravity assist flybys of Venus to get closer to the Sun, and to change its orbital inclination, boosting it out of the ecliptic plane, to get the best – and first – views of the Sun’s poles.

BepiColombo, a partnership between ESA and JAXA, will fly by Venus at 13:48 UTC on 10 August at an altitude of just 550 km. BepiColombo is on its way to the mysterious innermost planet of the solar system, Mercury. It needs flybys of Earth, Venus and Mercury itself, together with the spacecraft’s solar electric propulsion system, to help steer into Mercury orbit against the immense gravitational pull of the Sun.

The two spacecraft will zip past a different side of Venus. For a variety of reasons, the imagery gathered will not of high resolution, though both spacecraft will gather data that will eventually be correlated with similar data being gathered by Japan’s Akatsuki probe, in orbit around Venus since 2015.

Sun unleashes strongest solar flare since last solar maximum

X1 solar flare as seen by Solar Dynamics Observatory

On July 3, 2021 the Sun emitted the first X-class solar flare of the rising present solar maximum, the first such flare since September 2017 during the previous maximum.

This flare is classified as an X1.5-class flare. X-class denotes the most intense flares, while the number provides more information about its strength. An X2 is twice as intense as an X1, an X3 is three times as intense, etc.

The image to the right was taken by the orbiting Solar Dynamics Observatory (SDO), designed to monitor the Sun continuously and catch such events.

More information here. The flare caused some disturbances to various radio instruments, though nothing that resulted in any serious consequences.

What the flare did demonstrate is that the Sun is definitely ramping up to solar maximum. In fact, the Sun has not been blank, with no sunspots on its facing hemisphere, since May 6th, the longest such stretch since the last solar maximum.

Third set of new results from Parker released

The scientists using the Parker Solar Probe on June 2nd released their third set of new results as part of a special issue of the journal Astronomy & Astrophysics.

The latest articles include data analysis, theory, and modeling. Among the major topics covered are magnetic switchbacks first discovered by Parker Solar Probe, the role of waves in heating solar plasma, solar angular momentum, the near-Sun dust environment, and the diversity of small energetic-particle events.

The most interesting paper I think is the one describing data that lends strong weight to the theory, proposed in 1929 by astronomer Henry Norris Russell, that a dust-free zone exists close to the Sun and all stars. From the abstract:

The observed brightness decrease in the axis of symmetry is interpreted as the signature of the existence of a dust density depletion zone between about 19 [solar radii] and 3 [solar radii] which at the inner limit of WISPR’s field of view of 7.65 [solar radii] has a dust density that is ~5% lower than the density at 19 [solar radii], instead of the expected density which is three times if no depletion zone exists.

In plain English, the data shows that from about 1.3 million to 8.2 million miles from the Sun Parker found far less dust than predicted by other models. As the probe continues to lower its orbit and get closer to the Sun with each fly-by these numbers will be better refined, and are likely to in the end prove Russell’s hypothesis.

Sunspot update: Activity in May continued to exceed predictions

Time for our monthly sunspot update. On June 1st NOAA updated its monthly graph showing the Sun’s sunspot activity through the end of May 2021. Below is that updated graph, annotated as always to show the previous solar cycle predictions.

As has happened now for almost every month since the Sun’s sunspot cycle began to increase following the long and deep minimum in 2019, the activity in June exceeded the numbers predicted by the computer models of NOAA’s panel of solar scientists. While the activity dipped slightly from April, it still was more active than predicted.

» Read more

Parker makes course correction

On May 15th the Parker Solar Probe made the first of three small adjustments to its orbital path in order to refine its path during an October 16th fly-by of Venus, which in turn will make more precise its next three Venus fly-bys and thus bring it closer and closer to the Sun.

[The] Parker Solar Probe just completed its eighth close approach to the Sun, coming within a record 6.5 million miles (10.4 million kilometers) of the Sun’s surface on April 29. It’ll pass the Sun from about the same distance again on Aug. 9, before using Venus’ gravity on Oct. 16 to swing it even closer to the surface — about 5.6 million miles (9 million kilometers) — on Nov. 21. Assisted by the remaining three Venus flybys, Parker Solar Probe will eventually come within 4 million miles (6.4 million kilometers) of the solar surface.

The spacecraft remains healthy and continues to gather data with each fly-by of the both the Sun and Venus.

Sunspot update: Sunspot activity continues to exceed predictions

The uncertainty of science: On May 1st NOAA updated its monthly graph to show the Sun’s sunspot activity through the end of April 2021. As I do every month, I have annotated it to show the previous solar cycle predictions and posted it below.

In my sunspot update last month I reviewed in detail the range of predictions by solar scientist for the upcoming solar maximum, noting that based on the higher than expected sunspot activity that has been occurring since the ramp up to solar maximum began in 2020, it appeared that all of their predictions might be wrong. The continuing high activity that occurred in April continued that trend.

» Read more

Sunspot update: Higher than predicted activity continues

The uncertainty of science: Time for our monthly update of the Sun’s on-going sunspot cycle. Below is NOAA’s April 1, 2021 monthly graph, showing the Sun’s sunspot activity through the end of March 2021. I have annotated it as always to show the previous solar cycle predictions.

The higher than expected sunspot activity that has been occurring almost from the moment the ramp up to solar maximum began in 2020 continued in March. The numbers weren’t as high as they were in December and January, but they were still higher than the predicted sunspot number.

» Read more

Sunspot update: February activity declines to predicted values

Time to do another sunspot update. Below is NOAA’s March 1, 2021 monthly graph, showing the Sun’s monthly sunspot activity. It is annotated by me as always to show the previous solar cycle predictions.

February continued the decline of sunspot activity seen in January after a very unusually active November and December. Though the actual sunspot number was more than the prediction, the difference in February was trivial.
» Read more

Sunspot update: January activity returns to expected levels

Though I am a bit late this month, it is once again time provide my monthly update of the Sun’s on-going sunspot cycle. Below is NOAA’s February 1, 2021 monthly graph, showing the Sun’s monthly sunspot activity. I have, as I do each month, annotated it to show the previous solar cycle predictions.

After two months of relatively high activity, activity that was very high so early in the ramp up to solar maximum, the number of sunspots in January dropped down to closely match the predicted value. It was still higher, but not by much.

» Read more

Parker completes 7th solar fly-by, sets new records

The Parker Solar Probe this week successfully completed its seventh close fly-by of the Sun, coming within 8.4 million miles and traveling at almost 300,000 miles per hour.

Nor is that all for 2021:

The spacecraft will make three more progressively close passes to the Sun in 2021 alone, as well as two gravity-assist flybys at Venus in February and October to adjust the trajectory of its orbit. After zipping past Venus on Feb. 20, Parker Solar Probe will again make close approaches to the Sun on April 29 and Aug. 9. Following another Venus gravity assist on Oct. 16, the spacecraft will make an even closer solar pass on Nov. 21, with perihelion just 5.3 million miles from the Sun’s surface.

Because the fly-bys of Venus are shrinking Parker’s solar orbit, the time between solar fly-bys is also shrinking.

Sunspot update: December sunspot activity once again higher than predicted

The uncertainty of science: It is time to once again take a look at the state of the Sun’s on-going sunspot cycle. Below is NOAA’s January 1, 2021 monthly graph, documenting the Sun’s monthly sunspot activity and annotated by me to show previous solar cycle predictions.

The ramp up to solar maximum continued in December. Though there was a drop from the very high activity seen in November, the number of sunspots in December still far exceeded the prediction as indicated by the red curve.

» Read more

Sunspot update: November most active sunspot month since 2017

My monthly sunspot for December is late this month because I simply forgot to do it. (Thanks to reader Phill Oltmann for prodding my memory.)

Below is NOAA’s monthly graph for tracking the Sun’s monthly sunspot activity, annotated by me to show the past solar cycle predictions.

The increasing sunspot activity we saw in October continued spectacularly in November. In fact, the amount of activity was the most seen since the summer of 2017, when the last solar maximum gave us its last big outburst.

» Read more

First sunspot image from Inouye Solar Telescope

Sunspot image taken by Inouye Solar Telescope
Click for full image.

The science team for the new Inouye Solar Telescope, now in the final phase of construction, has released the telescope’s first high resolution sunspot image.

The image is to the right, reduced to post here, and was taken almost a year ago, on January 28, 2020.

“The sunspot image achieves a spatial resolution about 2.5 times higher than ever previously achieved, showing magnetic structures as small as 20 kilometers on the surface of the sun,” said [Dr. Thomas Rimmele, the associate director at NSF’s National Solar Observatory (NSO)].

The image reveals striking details of the sunspot’s structure as seen at the Sun’s surface. The streaky appearance of hot and cool gas spidering out from the darker center is the result of sculpting by a convergence of intense magnetic fields and hot gasses boiling up from below.

…This sunspot image, measuring about 10,000 miles across, is just a tiny part of the Sun. However, the sunspot is large enough that Earth could comfortably fit inside.

The start of official telescope operations is set to begin in ’21, and had been delayed because of the Wuhan flu panic. Construction had begun in ’13.

Parker completes record-setting sixth Sun fly-by

The Parker Solar Probe has successfully completed its sixth close fly-by of the Sun, flying as close as 8.4 million miles, the closest any spacecraft has ever gotten to the Sun, while also moving at a record speed of 289,927 miles per hour.

Flight controllers at the Johns Hopkins Applied Physics Laboratory in Laurel, Maryland, received a “Status A” signal from the spacecraft through NASA’s Deep Space Network at 4:45 a.m. EDT; Status A is the best of four possible status signals, and indicates that the spacecraft is operating nominally.

The beacon comes after a six-day stretch when communications with the spacecraft were not possible as it wheeled around the Sun. This is the first sign of a successful solar encounter; this sixth solar encounter began Sept. 21 and continues through Oct. 2.

Future fly-bys will likely break this record as well.

Scientists declare solar minimum over, with next sunspot maximum coming

Scientists from the government agencies of NOAA and NASA today announced that the solar minimum of the past sunspot cycle occurred in December 2019, and that the ramp up to the next solar maximum has begun, which they predict will be as active as the last weak maximum.

The announcement and prediction was put forth by “the Solar Cycle 25 Prediction Panel, an international group of experts co-sponsored by NASA and NOAA.” While this group is made up of legitimate scientists studying the Sun, its press releases tend to be lobbying efforts for government programs, which nicely describes today’s release as well. The release not only touts the importance of their work, it links this work to the Trump administration’s Artemis program to get back to the Moon.

Note also that this announcement only makes official what has been obvious for months, as I have noted in my monthly sunspot updates. See for example this quote from my September 7th update:

What is clear is that the activity does herald the next maximum. As in the past few months, the sunspots in August all had polarities that assigned them to the new maximum. While it is not impossible for there to be a handful of sunspots in the next few months that belong to the last maximum, it now appears that the last cycle is pretty much over. We are entering the ramp up to the next maximum, presently predicted by a portion of the solar science community aligned with NOAA to be a weak one.

The only change is that it appears they are upping their prediction for the next maximum slightly. Before the prediction panel had said that the next maximum would be weaker than the past maximum. Now they it appears they are saying it will be the same.

Sunspot update: More evidence of an upcoming maximum

NOAA last week updated its monthly graph for tracking the Sun’s monthly sunspot activity. As I have done now for every month since 2011, I am posting that graph elow with additional annotations by me to show the past and new solar cycle predictions.

August 2020 sunspot activity

The graph above has been modified to show the predictions of the solar science community for the previous solar maximum. The green curves show the community’s two original predictions from April 2007 for the previous maximum, with half the scientists predicting a very strong maximum and half predicting a weak one. The blue curve is their revised May 2009 prediction. The red curve is the new prediction, first posted by NOAA in April 2020.

August continued the trends seen in the past two months whereby sunspot activity actually exceeded the prediction for this particular month.

Does this mean the prediction of a weak maximum in 2025 will be wrong? Hardly. Sunspot activity in any given month can easily be above or below the prediction, as is obvious if you compare the fluctuations of the last maximum with the prediction. We will not really know if these higher numbers the past few months mean anything until a lot more time has passed, with the gathering of a lot more data.

What is clear is that the activity does herald the next maximum. As in the past few months, the sunspots in August all had polarities that assigned them to the new maximum. While it is not impossible for there to be a handful of sunspots in the next few months that belong to the last maximum, it now appears that the last cycle is pretty much over. We are entering the ramp up to the next maximum, presently predicted by a portion of the solar science community aligned with NOAA to be a weak one.

Above all, the real scientific mystery remains: Scientists do not really yet understand the causes and processes that produce this sunspot cycle. They know without question that it is caused by cycles in the Sun’s magnetic dynamo, but their understanding of the details behind this process remain quite unknown.

Furthermore, the Sun’s importance to the climate on Earth is unquestioned. What we still do not know is its precise influence on long term climate changes. There is circumstantial evidence that it causes cooling and warming of the climate on scales of decades and centuries, but this remains unconfirmed. Once again, our understanding of the details behind the changes in the climate remain quite unknown.

And as always, the devil is in the details.

Newly upgraded solar telescope sees first light

Early image from upgraded solar telescope.

Astronomers have finished a major instrument upgrade of the GREGOR solar telescope in the Canary Islands, making it possible for them to observe features on the Sun’s surface as small as thirty miles in diameter.

The image to the right is an example of the telescope’s new capability, showing the Sun’s granular surface features. From the introduction of the paper describing the upgrade:

GREGOR is Europe’s largest solar telescope. … Its 1.5 m diameter with an optical footprint of 1.44 m allows us to resolve structures on the Sun as small as 50 km at 400 nm.

…A past drawback of GREGOR was that its image quality did not reach the theoretical limit, partly because a risk was taken with untested technologies, such as silicon carbide mirrors, which could not be polished well enough, and partly because of design problems. These difficulties have recently been solved by replacing all silicon carbide mirrors with mirrors made of Zerodur, which can be polished to the required quality, and by redesigning the AO relay optics. GREGOR now operates at its diffraction limit. [emphasis mine]

In other words, the initial mirrors did not work as promised, requiring them to replace them to get the telescope to function as initially designed. By the image above, it looks like their upgrade has worked admirably.

1 2 3 4 12