Sunspot update: Sun continues its higher than predicted activity

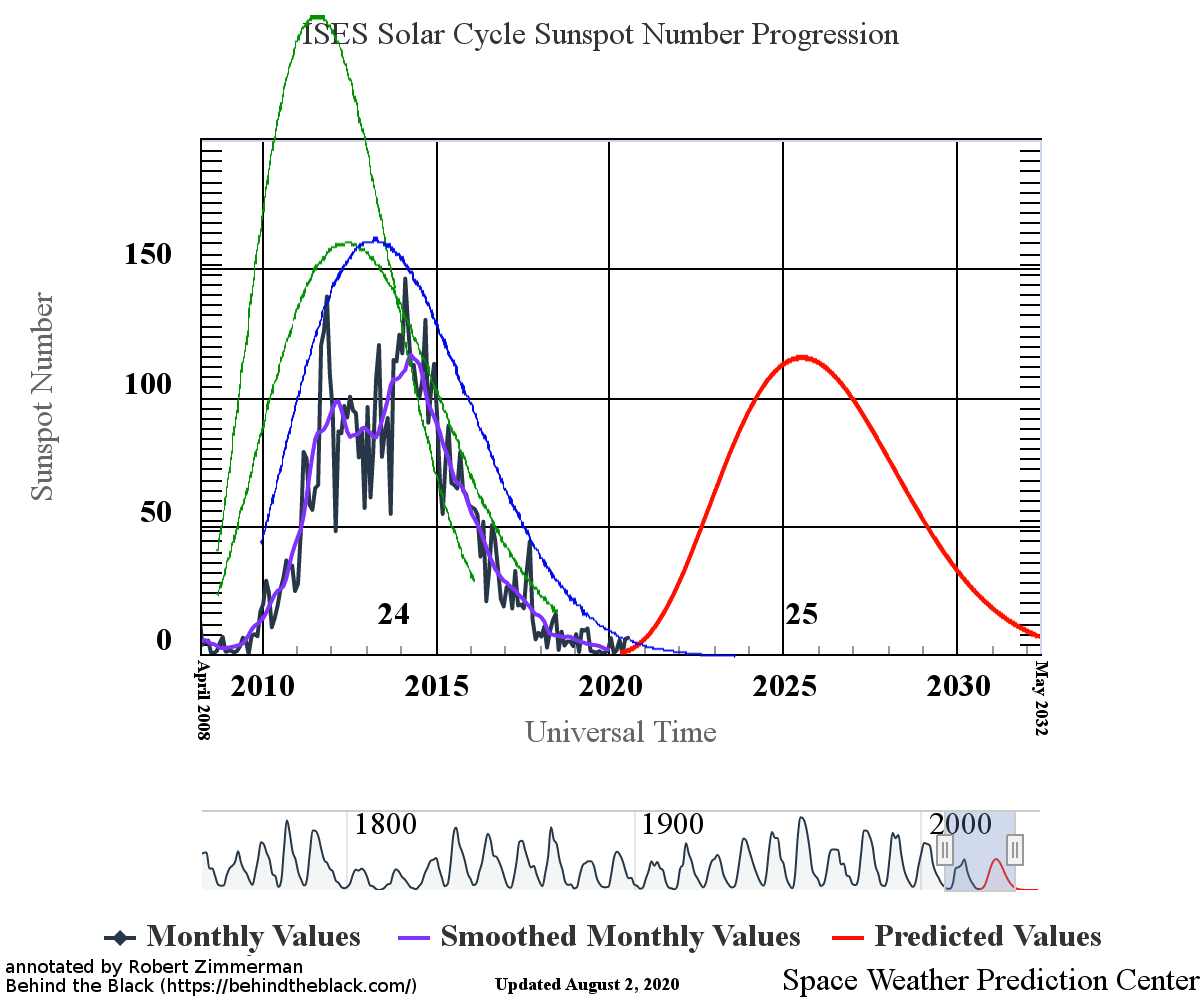
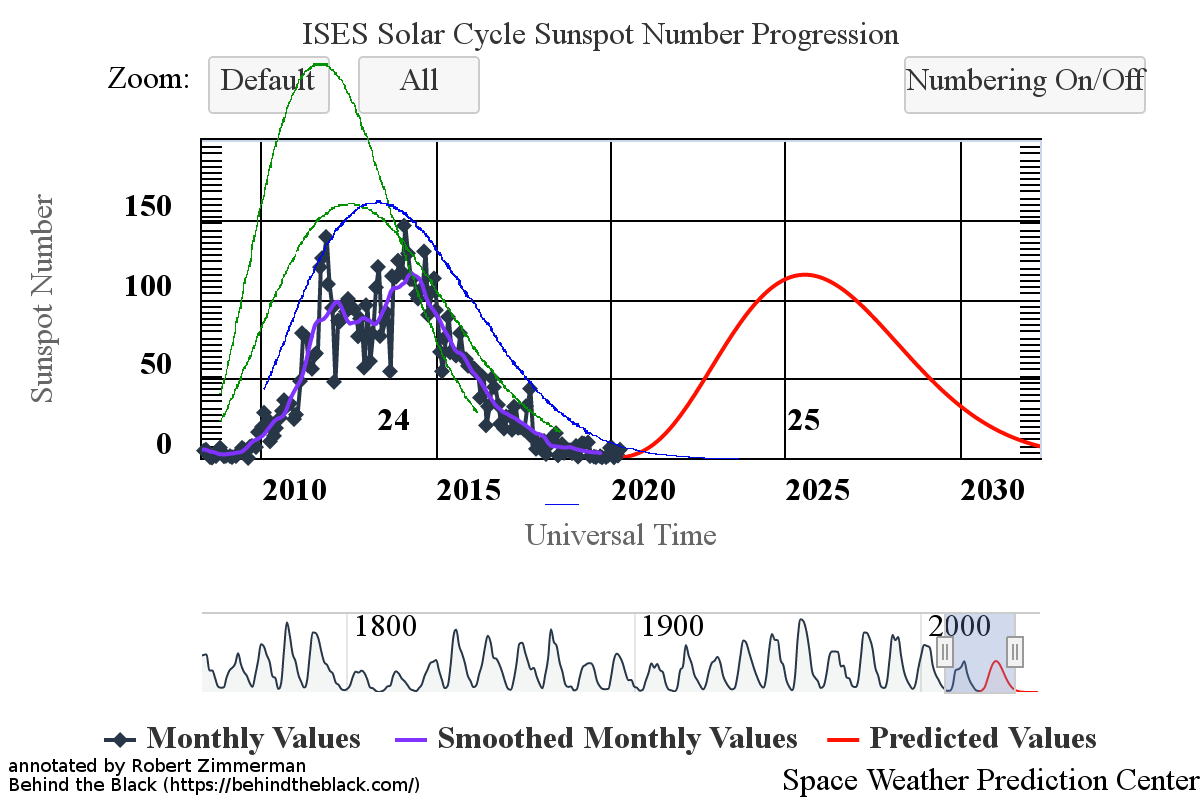
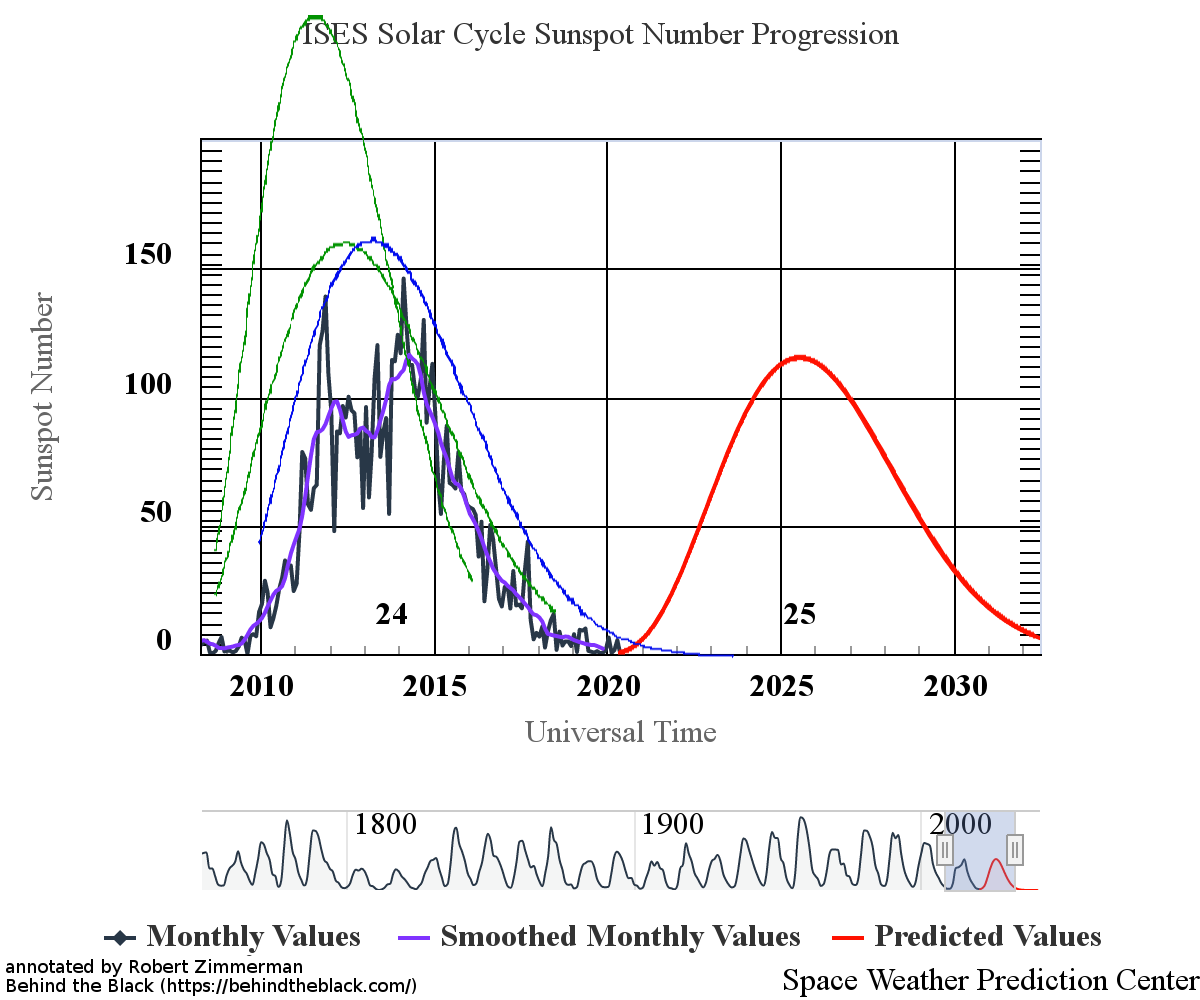
With the beginning of a new month comes my monthly sunspot update, based on NOAA’s most recent monthly graph of sunspot activity. That graph is below, annotated to show the previous solar cycle predictions and thus provide context. It has now been extended from last month to include the Sun’s sunspot activity in October.

Sunspot activity in October continued to be higher than predicted, though the month saw a slight drop from September. Even so, the number of sunspots seen on the Sun’s facing hemisphere in October were the most since August of 2016, when the Sun was ramping down to solar minimum.

» Read more

Major solar flare from the Sun

X-1 solar flare
The flare is the bright spot, center bottom. Click for original image.

The Sun today unleashed an X1-class solar flare, one of the more powerful seen since the ramp up to solar maximum began at the start of 2020.

More information here, with this quote:

The blast also hurled a CME [coronal mass ejection] into space. Coronagraph images are not yet available, but evidence for a CME is already pursuasive [sic]. The USAF reports strong Type II and Type IV radio emissions generated by a CME plowing through the sun’s atmosphere. In addition, energetic particles accelerated at the leading edge of a CME have already reached Earth.

When will the CME itself arrive? Assuming that it is Earth directed, probably on Oct. 30th or 31st. Fresh data from SOHO coronagraphs will allow a more precise forecast, so stay tuned.

During the flare, a pulse of X-rays and extreme UV radiation ionized the top of Earth’s atmosphere, causing a strong shortwave radio blackout centered on South America:

Aviators, mariners, and ham radio operators on the daylit side of Earth may have noticed strange propagation effects at frequencies below 30 MHz.

While this flare is unlikely to cause any significant disturbances to orbiting or Earth-based technology, the flare was emitted by a large sunspot that is still active, can still flare again, and is well positioned on the Sun to send more material and radiation Earthward.

Sunspot update: The boom in sunspots returns!

It is time for my monthly sunspot update, based on the most recent NOAA monthly graph, showing the changes in the Sun’s sunspot activity during September. That graph is below, annotated to show the previous solar cycle predictions and thus provide context.

In September sunspot activity boomed once again, producing the most sunspots in a month since 2016 and ending the slight drop in activity in August to return to the pattern the Sun has exhibited since the end of solar minimum. Consistently the number of sunspots on the visible hemisphere of the Sun since 2020 has exceeded the April 2020 prediction of the NOAA scientist panel, as indicated by the red curve in the graph.

» Read more

Sunspot update: Activity declines in August to just above prediction

On September 1st NOAA released its update of its monthly sunspot cycle graph, showing the Sun’s sunspot activity for the past month. That graph is below, annotated to show the previous solar cycle predictions and thus provide context.

In August sunspot activity dropped from July so that it was only slightly above the prediction of NOAA’s panel of solar scientists, as indicated by the red curve. The blank streak at the very end of July ended on August 2nd (a streak of seven days and the longest in years), but was followed during the month by an additional five blank days.

» Read more

Sunspot update: Another month of greater activity than predicted

NOAA this past weekend released an update of its monthly sunspot cycle graph, showing the Sun’s sunspot activity for the past month. That graph is below, annotated to show the previous solar cycle predictions and thus provide context.

In July the Sun’s hot streak of sunspot activity continued. The number of sunspots on its visible hemisphere continued to exceed the prediction of NOAA’s solar science panel, with the numbers in July easily topping June’s numbers. Only at the very end of July was there a streak of five blank days, the first time the Sun has been blank of sunspots since May 6th, a stretch of activity not seen for years, since the last solar maximum was ramping down to solar minimum in ’16-’17.

The political consequences of this continuing high activity could be quite profound.
» Read more

Sun unleashes strongest solar flare since last solar maximum

X1 solar flare as seen by Solar Dynamics Observatory

On July 3, 2021 the Sun emitted the first X-class solar flare of the rising present solar maximum, the first such flare since September 2017 during the previous maximum.

This flare is classified as an X1.5-class flare. X-class denotes the most intense flares, while the number provides more information about its strength. An X2 is twice as intense as an X1, an X3 is three times as intense, etc.

The image to the right was taken by the orbiting Solar Dynamics Observatory (SDO), designed to monitor the Sun continuously and catch such events.

More information here. The flare caused some disturbances to various radio instruments, though nothing that resulted in any serious consequences.

What the flare did demonstrate is that the Sun is definitely ramping up to solar maximum. In fact, the Sun has not been blank, with no sunspots on its facing hemisphere, since May 6th, the longest such stretch since the last solar maximum.

Sunspot update: The hot streak continues

This past weekend NOAA released its monthly update of its graph showing the Sun’s sunspot activity, with the new update covering the period through the end of June 2021. As I have done since I began this website eleven years ago, I post that monthly graph below, annotated to show the previous solar cycle predictions and thus provide context.

In June the hot streak of sunspot activity exceeding the prediction of NOAA’s solar science panel continued, with activity rising again after a tiny dip in May. Except for two months, since 2019 the number of sunspots each month has consistently exceeded the prediction. Furthermore, the ramp up of activity has been faster than expected.
» Read more

Sunspot update: Activity in May continued to exceed predictions

Time for our monthly sunspot update. On June 1st NOAA updated its monthly graph showing the Sun’s sunspot activity through the end of May 2021. Below is that updated graph, annotated as always to show the previous solar cycle predictions.

As has happened now for almost every month since the Sun’s sunspot cycle began to increase following the long and deep minimum in 2019, the activity in June exceeded the numbers predicted by the computer models of NOAA’s panel of solar scientists. While the activity dipped slightly from April, it still was more active than predicted.

» Read more

Sunspot update: Sunspot activity continues to exceed predictions

The uncertainty of science: On May 1st NOAA updated its monthly graph to show the Sun’s sunspot activity through the end of April 2021. As I do every month, I have annotated it to show the previous solar cycle predictions and posted it below.

In my sunspot update last month I reviewed in detail the range of predictions by solar scientist for the upcoming solar maximum, noting that based on the higher than expected sunspot activity that has been occurring since the ramp up to solar maximum began in 2020, it appeared that all of their predictions might be wrong. The continuing high activity that occurred in April continued that trend.

» Read more

Sunspot update: Higher than predicted activity continues

The uncertainty of science: Time for our monthly update of the Sun’s on-going sunspot cycle. Below is NOAA’s April 1, 2021 monthly graph, showing the Sun’s sunspot activity through the end of March 2021. I have annotated it as always to show the previous solar cycle predictions.

The higher than expected sunspot activity that has been occurring almost from the moment the ramp up to solar maximum began in 2020 continued in March. The numbers weren’t as high as they were in December and January, but they were still higher than the predicted sunspot number.

» Read more

Sunspot update: February activity declines to predicted values

Time to do another sunspot update. Below is NOAA’s March 1, 2021 monthly graph, showing the Sun’s monthly sunspot activity. It is annotated by me as always to show the previous solar cycle predictions.

February continued the decline of sunspot activity seen in January after a very unusually active November and December. Though the actual sunspot number was more than the prediction, the difference in February was trivial.
» Read more

Sunspot update: January activity returns to expected levels

Though I am a bit late this month, it is once again time provide my monthly update of the Sun’s on-going sunspot cycle. Below is NOAA’s February 1, 2021 monthly graph, showing the Sun’s monthly sunspot activity. I have, as I do each month, annotated it to show the previous solar cycle predictions.

After two months of relatively high activity, activity that was very high so early in the ramp up to solar maximum, the number of sunspots in January dropped down to closely match the predicted value. It was still higher, but not by much.

» Read more

Sunspot update: December sunspot activity once again higher than predicted

The uncertainty of science: It is time to once again take a look at the state of the Sun’s on-going sunspot cycle. Below is NOAA’s January 1, 2021 monthly graph, documenting the Sun’s monthly sunspot activity and annotated by me to show previous solar cycle predictions.

The ramp up to solar maximum continued in December. Though there was a drop from the very high activity seen in November, the number of sunspots in December still far exceeded the prediction as indicated by the red curve.

» Read more

Sunspot update: November most active sunspot month since 2017

My monthly sunspot for December is late this month because I simply forgot to do it. (Thanks to reader Phill Oltmann for prodding my memory.)

Below is NOAA’s monthly graph for tracking the Sun’s monthly sunspot activity, annotated by me to show the past solar cycle predictions.

The increasing sunspot activity we saw in October continued spectacularly in November. In fact, the amount of activity was the most seen since the summer of 2017, when the last solar maximum gave us its last big outburst.

» Read more

First sunspot image from Inouye Solar Telescope

Sunspot image taken by Inouye Solar Telescope
Click for full image.

The science team for the new Inouye Solar Telescope, now in the final phase of construction, has released the telescope’s first high resolution sunspot image.

The image is to the right, reduced to post here, and was taken almost a year ago, on January 28, 2020.

“The sunspot image achieves a spatial resolution about 2.5 times higher than ever previously achieved, showing magnetic structures as small as 20 kilometers on the surface of the sun,” said [Dr. Thomas Rimmele, the associate director at NSF’s National Solar Observatory (NSO)].

The image reveals striking details of the sunspot’s structure as seen at the Sun’s surface. The streaky appearance of hot and cool gas spidering out from the darker center is the result of sculpting by a convergence of intense magnetic fields and hot gasses boiling up from below.

…This sunspot image, measuring about 10,000 miles across, is just a tiny part of the Sun. However, the sunspot is large enough that Earth could comfortably fit inside.

The start of official telescope operations is set to begin in ’21, and had been delayed because of the Wuhan flu panic. Construction had begun in ’13.

Sunspot update: An active October heralds the likely end of solar minimum

With the start of a new month it is once again time to publish another sunspot update. NOAA yesterday updated its monthly graph for tracking the Sun’s monthly sunspot activity. As I have done now every month since this website started in 2011, it is posted below, with additional annotations by me to show the past solar cycle predictions.

Unlike September, which saw almost no sunspots, October was a very active month, with the amount of sunspots far exceeding prediction. Furthermore, every sunspot during the month had a polarity assigning it to the new solar cycle, not the last.

» Read more

Sunspot update: Practically no sunspots for a month

It is sunspot update time again! NOAA today updated its monthly graph for tracking the Sun’s monthly sunspot activity, and I have posted it below, with additional annotations by me to show the past solar cycle predictions.

July and August had seen sunspot numbers higher than the new NOAA prediction (shown by the red curve on the graph below). September however was almost totally blank, with only two weak sunspots for the entire month, as shown on the SILSO graph below.
» Read more

Scientists declare solar minimum over, with next sunspot maximum coming

Scientists from the government agencies of NOAA and NASA today announced that the solar minimum of the past sunspot cycle occurred in December 2019, and that the ramp up to the next solar maximum has begun, which they predict will be as active as the last weak maximum.

The announcement and prediction was put forth by “the Solar Cycle 25 Prediction Panel, an international group of experts co-sponsored by NASA and NOAA.” While this group is made up of legitimate scientists studying the Sun, its press releases tend to be lobbying efforts for government programs, which nicely describes today’s release as well. The release not only touts the importance of their work, it links this work to the Trump administration’s Artemis program to get back to the Moon.

Note also that this announcement only makes official what has been obvious for months, as I have noted in my monthly sunspot updates. See for example this quote from my September 7th update:

What is clear is that the activity does herald the next maximum. As in the past few months, the sunspots in August all had polarities that assigned them to the new maximum. While it is not impossible for there to be a handful of sunspots in the next few months that belong to the last maximum, it now appears that the last cycle is pretty much over. We are entering the ramp up to the next maximum, presently predicted by a portion of the solar science community aligned with NOAA to be a weak one.

The only change is that it appears they are upping their prediction for the next maximum slightly. Before the prediction panel had said that the next maximum would be weaker than the past maximum. Now they it appears they are saying it will be the same.

Sunspot update: More evidence of an upcoming maximum

NOAA last week updated its monthly graph for tracking the Sun’s monthly sunspot activity. As I have done now for every month since 2011, I am posting that graph elow with additional annotations by me to show the past and new solar cycle predictions.

August 2020 sunspot activity

The graph above has been modified to show the predictions of the solar science community for the previous solar maximum. The green curves show the community’s two original predictions from April 2007 for the previous maximum, with half the scientists predicting a very strong maximum and half predicting a weak one. The blue curve is their revised May 2009 prediction. The red curve is the new prediction, first posted by NOAA in April 2020.

August continued the trends seen in the past two months whereby sunspot activity actually exceeded the prediction for this particular month.

Does this mean the prediction of a weak maximum in 2025 will be wrong? Hardly. Sunspot activity in any given month can easily be above or below the prediction, as is obvious if you compare the fluctuations of the last maximum with the prediction. We will not really know if these higher numbers the past few months mean anything until a lot more time has passed, with the gathering of a lot more data.

What is clear is that the activity does herald the next maximum. As in the past few months, the sunspots in August all had polarities that assigned them to the new maximum. While it is not impossible for there to be a handful of sunspots in the next few months that belong to the last maximum, it now appears that the last cycle is pretty much over. We are entering the ramp up to the next maximum, presently predicted by a portion of the solar science community aligned with NOAA to be a weak one.

Above all, the real scientific mystery remains: Scientists do not really yet understand the causes and processes that produce this sunspot cycle. They know without question that it is caused by cycles in the Sun’s magnetic dynamo, but their understanding of the details behind this process remain quite unknown.

Furthermore, the Sun’s importance to the climate on Earth is unquestioned. What we still do not know is its precise influence on long term climate changes. There is circumstantial evidence that it causes cooling and warming of the climate on scales of decades and centuries, but this remains unconfirmed. Once again, our understanding of the details behind the changes in the climate remain quite unknown.

And as always, the devil is in the details.

Sunspot update: Hints of the next maximum

It’s time for another monthly sunspot update! NOAA yesterday updated its monthly graph for tracking the Sun’s monthly sunspot activity, and as I do every month, I am posting it below with additional anotations by me to show the past and new solar cycle predictions.

July 2020 sunspot activity

The graph above has been modified to show the predictions of the solar science community for both the previous and upcoming solar maximums. The green curves show the community’s two original predictions from April 2007 for the previous maximum, with half the scientists predicting a very strong maximum and half predicting a weak one. The blue curve is their revised May 2009 prediction. The red curve is the new prediction, first posted by NOAA in April 2020.

July continued the trend from June, with a slight uptick in activity. The SILSO graph below for July illustrates this.
» Read more

New model predicting solar flares is 56% accurate

The uncertainty of science: Using observations from the space-based Solar Dynamics Observatory (SDO), solar scientists have developed a new model for predicting the biggest solar flares, and have found it to able to predict a big flare about 56% of the time.

Kusano and his team looked at the seven active regions from the last solar cycle that produced the strongest flares on the Earth-facing side of the Sun (they also focused on flares from part of the Sun that is closest to Earth, where magnetic field observations are best). SDO’s observations of the active regions helped them locate the right magnetic boundaries, and calculate instabilities in the hot spots. In the end, their model predicted seven out of nine total flares, with three false positives. The two that the model didn’t account for, Kusano explained, were exceptions to the rest: Unlike the others, the active region they exploded from were much larger, and didn’t produce a coronal mass ejection along with the flare. [emphasis mine]

What they did was apply their model to active regions on the Sun during the last solar maximum to see if it would accurately predict the events we know did happen. The model predicted that big flares would spout from ten of twelve active regions on the Sun during the last solar cycle. In reality, only seven of those twelve active regions produced flares.

The press release minimizes the three false positives, making believe they don’t count in the total. That’s hogwash. The model got it wrong, and so these false positives must be counted just like the two false negatives.

A prediction rate of 56% is barely above random, so this model needs a lot of work. Nonetheless, it is a major step forward, because it is not based on simple statistics — counting the number of big sunspots and the number of big flares and then calculating the percentage that flare — which is how most solar science models are structured, and thus are really meaningless. Instead, this model is based an actual analysis of the behavior of the Sun’s magnetic field in big active regions when solar flares erupt. They are trying to pinpoint the precise conditions that cause the big flares, and appear to be narrowing the conditions successfully.

Sunspot update: More evidence of an upcoming weak maximum

On July 4th NOAA updated its monthly graph tracking the monthly activity of sunspots on the Sun’s visible hemisphere. Below is that updated graph, annotated by me to show the past and new solar cycle predictions.

June 2020 sunspot activity

The graph above has been modified to show the predictions of the solar science community for both the previous and upcoming solar maximums. The green curves show the community’s two original predictions from April 2007 for the previous maximum, with half the scientists predicting a very strong maximum and half predicting a weak one. The blue curve is their revised May 2009 prediction. The red curve is the new prediction, first posted by NOAA in April 2020.

June saw an uptick of activity since my last update, though that activity remains quite low. We saw two sunspots during the month, both with polarities that link them to the next maximum and thus providing evidence that we will have a maximum in about five or six years. The first of those sunspots was also one of the strongest new cycle sunspots yet seen, and lasted for almost two weeks before it rotated off the visible face of the sun.

The ratio of next cycle sunspots vs sunspots from the past maximum has also been shifting. More and more, the new sunspots belong to the next cycle and less to the last. The ramp up to the next maximum is definitely beginning, though to call it a “ramp up” at this point is a big exaggeration. Sunspot activity remains low, though the last few months have seen some activity, unlike the seven months of nothing seen during the second half of last year.

The upcoming prediction for the next maximum calls for it to be very weak. Interestingly, the activity in June surpassed that prediction. This does not mean that the prediction will be wrong, only that June was more active when compared to the smooth prediction curve. As the cycle unfolds the monthly numbers will fluctuate up and down, as they did last cycle. The question will be whether their overall numbers will match closely with the prediction. In the past cycle actual sunspot activity was consistently below all predictions. It is too soon to say how well the new prediction is doing.

Sunspot update: The deep minimum deepens

NOAA last week did its monthly update of its graph for tracking the monthly activity of sunspots on the Sun’s visible hemisphere. Below is that updated graph, annotated by me to show the past and new solar cycle predictions.

May 2020 sunspot activity

The graph above has been modified to show the predictions of the solar science community for both the previous and upcoming solar maximums. The green curves show the community’s two original predictions from April 2007 for the previous maximum, with half the scientists predicting a very strong maximum and half predicting a weak one. The blue curve is their revised May 2009 prediction. The red curve is the new prediction, first posted by NOAA in April 2020.

Since last month NOAA has done some further revisions to this graph, and improved it significantly since their first redesign, released in April. You can see the difference just by comparing it to my previous update last month. For scales covering longer periods, they have eliminated the diamonds, making the curve much more readable. They have also increased the size of the graph, which also serves to make it more readable as well. Kudos to the people at NOAA for these changes.

As you can see, sunspot activity in May plunged from the slight uptick in April. This is even more clearly shown by the SILSO graph below.
» Read more

Sunspot update: The deep minimum continues

Last week NOAA updated its graph for tracking the monthly activity of sunspots on the Sun’s visible hemisphere. Below is that updated graph, annotated by me to show the past and new solar cycle predictions.

April 2020 sunspot activity

The graph above has been modified to show the predictions of the solar science community for both the previous and upcoming solar maximums. The green curves show the community’s two original predictions from April 2007 for the previous maximum, with half the scientists predicting a very strong maximum and half predicting a weak one. The blue curve is their revised May 2009 prediction. The red curve is the new prediction, first posted by NOAA in April 2020.

Because of the design of this graph, revamped by NOAA in April, it is difficult at this scale — which for context shows both the past cycle and the predicted future cycle — to see the addition of the April sunspot total, when compared to last month’s graph. Trust me, it is there. In April sunspot activity went up, but trivially so, with only four sunspots during the month, three of which had a magnetic polarity assigning them to the next solar maximum.

The solar minimum remains very deep, deeper than the very deep previous minimum, and possibly the least active in two hundred years. The presence however of more sunspots for the new cycle strengthens the expectation that we will not be entering a grand minimum, with no sunspots for decades. It just appears that, as predicted, the next solar maximum will be a very weak one.

How this weak activity will effect the climate remains an unknown. In the past, such as the weak maximum that just ended as well as during past weak maximums at the beginning of the 1800s and the 1900s, the Earth’s climate cooled. It also cooled during the Little Ice Age in the 1600s, during the last grand minimum.

Whether the same will happen in the next decade remains unknown. Global warming activists will claim impossible, we are all going to die from overheating. The data for the past decade proves them wrong, though in the coming years they might be vindicated.

All we can do is wait, pay attention to the data, and make our conclusions from that.

NOAA’s prediction for the next solar maximum

Last week NOAA introduced a newly revamped graph for tracking the monthly activity of sunspots on the Sun’s visible hemisphere. (You can see an example of the old graph, used by them for more than fifteen years, here.)

In order to properly understand the context of future sunspot activity, it is important to understand how the new graph aligns with the old. My first attempt to do so in my April 3, 2020 sunspot update, unfortunately was a failure. While most of my conclusions in that update remain correct, my attempt to place NOAA’s prediction for the next solar cycle on my graph was in error.

I had not realized that NOAA had changed its sunspot number scale on the graph’s vertical axis. In their old graph they had used the monthly sunspot number count from the Royal Observatory of Belgium. The new graph instead used the sunspot number from NOAA’s own Space Weather Prediction Center (SWPC). Both numbers are creditable, but the solar scientist community has switched entirely to the latter in the past few years because they consider its criteria for determining the count across all past cycles to be more accurate.

The Belgium numbers have traditionally been about one third lower than SWPC’s. Not realizing that NOAA’s new prediction was based on the SWPC numbers, I therefore placed it on the graph using the Belgium numbers and thus made the peak of the solar maximum 33% too high.

Below is NOAA’s new graph, annotated properly with both the past and new solar cycle predictions added now correctly.
» Read more

Sunspot update: tiny uptick in March activity

UPDATE: In doing some analysis and prep work for future updates, I have discovered that the graph below is in error in its placement of the prediction for the next solar maximum in 2025. I have revised the graph below to note the error. On April 6, 2020 I posted an updated graph.

My original post:
—————————
This week NOAA unveiled a major revamping of the graph it has used for the past decade-plus to show the monthly progression of the sunspot cycle, and that I have been using since the start of this website to do my monthly sunspot updates.

Overall they did a very nice job. The new graph not only shows the present state of the cycle, but it allows you to zoom in or out on this cycle as well as all sunspot cycles going back to 1750, about the time the sunspot cycle was first recognized and the sunspot count became reliable.

The new graph also includes a new more precise prediction for the upcoming solar cycle, forecasting the peak in 2025, higher than the weak solar maximum that has just passed. I have taken the old graph (see my last update on March 12, 2020) and revised it to place this new prediction in context with the previous cycle. I have also added the March sunspot numbers to it.
» Read more

NOAA’s aging fleet of sun-observation satellites

In testimony during a Senate hearing on February 12, the head of NOAA’s space weather division admitted that the agency’s ability to monitor the Sun is threatened by its aging fleet of solar satellites, combined with the agency’s slow progress on a large single replacement satellite, presently scheduled for launch in 2024.

NOAA currently uses the Deep Space Climate Observatory (DSCOVR) and NASA’s Advanced Composition Explorer (ACE) spacecraft to collect solar wind data, and uses the ESA/NASA Solar and Heliospheric Observatory (SOHO) spacecraft to observe the solar corona, using those data to forecast solar storms that can affect satellites and terrestrial infrastructure such as power grids.

However, SOHO, launched in December 1995, is well past its design life. In addition, DSCOVR has been offline since June 2019 because of technical problems, forcing NOAA to depend solely on ACE, which launched in 1997. [emphasis mine]

NOAA has been trying, and failing, to build a replacement for ACE for more than a decade. Worse, the agency’s inability to deal with these issues was further revealed by this quote:

Congress has pushed to speed up work on that [replacement] mission, despite NOAA’s assurances about the availability of data from other spacecraft. NOAA sought about $25 million for the mission in its fiscal year 2020 budget request, but Congress appropriated $64 million. NOAA has yet to release its fiscal year 2021 budget request, more than a week after the White House published the overall federal government budget proposal.

Something has been wrong in the management at NOAA now for at least a decade. They can’t seem to get new satellites built, and when they try they can’t seem to do it on schedule and for a reasonable cost. Their weather satellite program has been rife with problems, including cost overruns, schedule delays, and failing satellites.

But why should we be surprised? This kind of mismanagement at the federal government has been par for the course for the past half century.

Sunspot update: A tiny burst of activity that might mean something

On February 3, 2020, NOAA posted its January of its monthly graph showing the long term sunspot activity of the Sun. As I have done now every month since this webpage began in 2011, it is posted below, with annotations:

After seven months of practically no sunspot activity, the longest such stretch in probably a century, January had a tiny burst of activity, breaking that string. Of the month’s four sunspots, two had a polarity from the old solar cycle, two from the new.

January 2020 sunspot activity
The graph above has been modified to show the predictions of the solar science community for the previous solar maximum. The green curves show the community’s two original predictions from April 2007, with half the scientists predicting a very strong maximum and half predicting a weak one. The red curve is their revised May 2009 prediction, extended in November 2018 four years into the future.

Despite their low number and general weakness, the continuing appearance of sunspots with polarities aligned with the new cycle strongly indicates that we will have a solar maximum in the next five years, not a grand minimum lasting decades that some scientists are predicting. While the year is young and it is certainly too soon to trust any trends, the fact that January saw an increase in activity over the past seven months suggests that we might have passed the low point of the minimum. We shall find out this year.

It must be remembered that the uncertainties in this field of science remain gigantic. No one really understands why the Sun’s magnetic dynamo goes through these cycles and flips in polarity. No one really understands why it produces sunspots as it does. And no one for sure yet knows exactly how the Sun’s cyclical behavior directly effects the climate. We only have circumstantial evidence, some of which can be legitimately questioned.

What is certain is that we don’t know very much, and are always in error when we forget this fact. Remember this always when some politician or scientist claims the science is settled or certain, and they know without doubt what is going to happen. They are either lying, fooling themselves, or are simply fools. In any case, such certainty in science should never be trusted.

Sunspot update: The record flatline continues

In the month of December 2019 the Sun continued its longest stretch of overall sunspot inactivity ever recorded, reaching seven months in length. At no point since the last grand minimum in the 1600s have scientists ever seen so few sunspots over so long a time period.

Below is NOAA’s December update of its graph showing the long term sunspot activity of the Sun. As I have done now every month since this webpage began in 2011, it is posted below, with annotations:
» Read more

Sunspot update Nov 2019: The longest flatline in centuries

The Sun is now in what appears to be the longest stretch ever recorded, since the 11-year solar sunspot cycle reactivated in the 1700s after the last grand minimum, of sunspot inactivity. This record-setting dearth of practically no sunspots has now stretched to six months in a row.

On December 8 NOAA released its November update of its graph showing the long term sunspot activity of the Sun. As I have done now every month since this webpage began in 2011, I have posted it below, with annotations:

November 2019 sunspot activity
The graph above has been modified to show the predictions of the solar science community for the previous solar maximum. The green curves show the community’s two original predictions from April 2007, with half the scientists predicting a very strong maximum and half predicting a weak one. The red curve is their revised May 2009 prediction, extended in November 2018 four years into the future.

In November the Sun saw two official sunspots (here and here) and one active area that never received an official sunspot number, with two of these three weak events having a polarity linking them to the next solar maximum.
» Read more

1 2 3 4 9