
A map of Io’s hot spots based on Juno data
Click for original image.
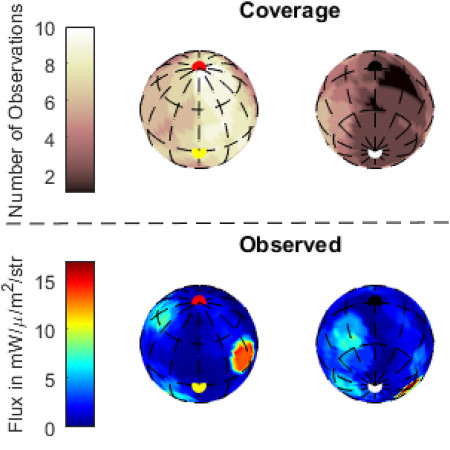
The uncertainty of science: Using the JIRAM infrared camera on the Jupiter orbiter Juno, scientists have now created a global map of volcanic activity, showing where it appears the hottest and greatest activity is located.
That data is illustrated by the graphic to the right, taken from figure 1 of the paper. The top row shows the coverage of the planet, with Io’s southern hemisphere getting the fewest observations. The bottom row shows the observed regions with the greatest heat. This quote from the abstract is most revealing:
Using JIRAM, we have mapped where volcanoes are producing the most power and compared that to where we expect higher heat flow from the interior models. Our map doesn’t agree with any of these models very well. JIRAM observed more volcanic activity at the poles than we expected to see based on previous observations. However, since the south pole was only observed twice, it’s possible that these observations don’t represent the average volcanic activity of the south pole. Very bright volcanoes that may have been continuously active for decades were also imaged during these Juno fly-bys, some of which are nearer the poles than the equator.
The conflict between the data and the theories could very well be explained simply by the short term nature of these observations. The models could very well be right, over centuries. For example, the new volcano discovered by Juno is near the equator, suggesting with time those models will turn out to be correct.
Or not. A lot more observations will have to be made of Io before any model of its volcanic activity can be considered trustworthy.

On Christmas Eve 1968 three Americans became the first humans to visit another world. What they did to celebrate was unexpected and profound, and will be remembered throughout all human history. Genesis: the Story of Apollo 8, Robert Zimmerman's classic history of humanity's first journey to another world, tells that story, and it is now available as both an ebook and an audiobook, both with a foreword by Valerie Anders and a new introduction by Robert Zimmerman.
The print edition can be purchased at Amazon or from any other book seller. If you want an autographed copy the price is $60 for the hardback and $45 for the paperback, plus $8 shipping for each. Go here for purchasing details. The ebook is available everywhere for $5.99 (before discount) at amazon, or direct from my ebook publisher, ebookit. If you buy it from ebookit you don't support the big tech companies and the author gets a bigger cut much sooner.
The audiobook is also available at all these vendors, and is also free with a 30-day trial membership to Audible.
"Not simply about one mission, [Genesis] is also the history of America's quest for the moon... Zimmerman has done a masterful job of tying disparate events together into a solid account of one of America's greatest human triumphs."--San Antonio Express-News

Click for original image.
The uncertainty of science: Using the JIRAM infrared camera on the Jupiter orbiter Juno, scientists have now created a global map of volcanic activity, showing where it appears the hottest and greatest activity is located.
That data is illustrated by the graphic to the right, taken from figure 1 of the paper. The top row shows the coverage of the planet, with Io’s southern hemisphere getting the fewest observations. The bottom row shows the observed regions with the greatest heat. This quote from the abstract is most revealing:
Using JIRAM, we have mapped where volcanoes are producing the most power and compared that to where we expect higher heat flow from the interior models. Our map doesn’t agree with any of these models very well. JIRAM observed more volcanic activity at the poles than we expected to see based on previous observations. However, since the south pole was only observed twice, it’s possible that these observations don’t represent the average volcanic activity of the south pole. Very bright volcanoes that may have been continuously active for decades were also imaged during these Juno fly-bys, some of which are nearer the poles than the equator.
The conflict between the data and the theories could very well be explained simply by the short term nature of these observations. The models could very well be right, over centuries. For example, the new volcano discovered by Juno is near the equator, suggesting with time those models will turn out to be correct.
Or not. A lot more observations will have to be made of Io before any model of its volcanic activity can be considered trustworthy.
On Christmas Eve 1968 three Americans became the first humans to visit another world. What they did to celebrate was unexpected and profound, and will be remembered throughout all human history. Genesis: the Story of Apollo 8, Robert Zimmerman's classic history of humanity's first journey to another world, tells that story, and it is now available as both an ebook and an audiobook, both with a foreword by Valerie Anders and a new introduction by Robert Zimmerman.
The print edition can be purchased at Amazon or from any other book seller. If you want an autographed copy the price is $60 for the hardback and $45 for the paperback, plus $8 shipping for each. Go here for purchasing details. The ebook is available everywhere for $5.99 (before discount) at amazon, or direct from my ebook publisher, ebookit. If you buy it from ebookit you don't support the big tech companies and the author gets a bigger cut much sooner.
The audiobook is also available at all these vendors, and is also free with a 30-day trial membership to Audible.
"Not simply about one mission, [Genesis] is also the history of America's quest for the moon... Zimmerman has done a masterful job of tying disparate events together into a solid account of one of America's greatest human triumphs."--San Antonio Express-News