
A seasonal map of the cloudy parts of Mars
Click for original image.
Though Mars’ very thin atmosphere (1/thousandth that of Earth) is generally clear, it does have clouds that come and go. A project begun in 2022 using citizen scientists to identify these clouds and the seasons they appear the most, dubbed Cloudspotting on Mars, has now published its first paper, available here.
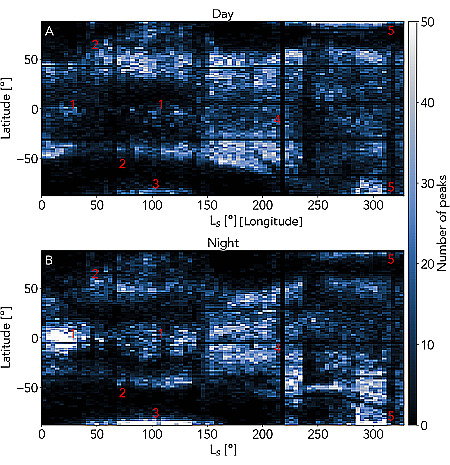
The graph to the left, Figure 9 in the paper, shows two seasonal Mars maps, one indicating the daytime seasonal frequency of clouds and the other their nightime frequency. From the paper:
The seasonal evolution of all clouds as a function of latitude for both daytime and nighttime are shown in Fig. 9. During the clear season until [mid-summer in the northern hemisphere] … there are several regions where clouds occur frequently: in the equatorial region (annotated as 1), at mid-latitudes (2), in the southern polar region (3), and to a lesser extent in the northern polar region [at the start of summer]. From [late fall to mid-autumn in the north], daytime clouds occur primarily at mid-latitudes, but are observed at nearly all latitudes between 70°S and 60°N (4). At night, there is one broad population from 30°S to 30°N (clouds are more frequent in the equatorial region at night), but [in autumn], clouds occur frequently between 30°N and 50°N as well. [In mid-spring] the number of observed nighttime clouds increases in the southern hemisphere, especially near 50°S. There is a strong decrease in the number of peaks just before [the late northern autumn and the late southern sping] at nearly all latitudes except around 50°S and 20°N at night. [Once northern winter arrives], clouds are observed between about 60°S and 60°N as well as both polar regions, although nighttime clouds between 0°N and 30°N occur relatively less frequently.
The low-latitude clouds during the clear season (1), which are observed more frequently at night, occur at high altitudes, 65–80 km during the day and 55–70 km at night; this is the aphelion equatorial mesospheric cloud population studied in depth by Slipski et al. (2022) and in which previous observations have spectrally confirmed CO2-ice.
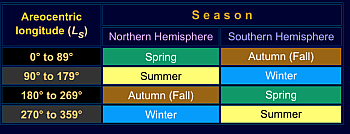
The bracketed words indicating seasons above replace the longitudal numbers the scientists use to indicate the seasons, and are used on these two graphs. The figure to the right shows what the longitude numbers represent in the graphs’ X-axis.
The project continues if any of my readers want to join in.

On Christmas Eve 1968 three Americans became the first humans to visit another world. What they did to celebrate was unexpected and profound, and will be remembered throughout all human history. Genesis: the Story of Apollo 8, Robert Zimmerman's classic history of humanity's first journey to another world, tells that story, and it is now available as both an ebook and an audiobook, both with a foreword by Valerie Anders and a new introduction by Robert Zimmerman.
The print edition can be purchased at Amazon or from any other book seller. If you want an autographed copy the price is $60 for the hardback and $45 for the paperback, plus $8 shipping for each. Go here for purchasing details. The ebook is available everywhere for $5.99 (before discount) at amazon, or direct from my ebook publisher, ebookit. If you buy it from ebookit you don't support the big tech companies and the author gets a bigger cut much sooner.
The audiobook is also available at all these vendors, and is also free with a 30-day trial membership to Audible.
"Not simply about one mission, [Genesis] is also the history of America's quest for the moon... Zimmerman has done a masterful job of tying disparate events together into a solid account of one of America's greatest human triumphs."--San Antonio Express-News

Click for original image.
Though Mars’ very thin atmosphere (1/thousandth that of Earth) is generally clear, it does have clouds that come and go. A project begun in 2022 using citizen scientists to identify these clouds and the seasons they appear the most, dubbed Cloudspotting on Mars, has now published its first paper, available here.
The graph to the left, Figure 9 in the paper, shows two seasonal Mars maps, one indicating the daytime seasonal frequency of clouds and the other their nightime frequency. From the paper:
The seasonal evolution of all clouds as a function of latitude for both daytime and nighttime are shown in Fig. 9. During the clear season until [mid-summer in the northern hemisphere] … there are several regions where clouds occur frequently: in the equatorial region (annotated as 1), at mid-latitudes (2), in the southern polar region (3), and to a lesser extent in the northern polar region [at the start of summer]. From [late fall to mid-autumn in the north], daytime clouds occur primarily at mid-latitudes, but are observed at nearly all latitudes between 70°S and 60°N (4). At night, there is one broad population from 30°S to 30°N (clouds are more frequent in the equatorial region at night), but [in autumn], clouds occur frequently between 30°N and 50°N as well. [In mid-spring] the number of observed nighttime clouds increases in the southern hemisphere, especially near 50°S. There is a strong decrease in the number of peaks just before [the late northern autumn and the late southern sping] at nearly all latitudes except around 50°S and 20°N at night. [Once northern winter arrives], clouds are observed between about 60°S and 60°N as well as both polar regions, although nighttime clouds between 0°N and 30°N occur relatively less frequently.
The low-latitude clouds during the clear season (1), which are observed more frequently at night, occur at high altitudes, 65–80 km during the day and 55–70 km at night; this is the aphelion equatorial mesospheric cloud population studied in depth by Slipski et al. (2022) and in which previous observations have spectrally confirmed CO2-ice.
The bracketed words indicating seasons above replace the longitudal numbers the scientists use to indicate the seasons, and are used on these two graphs. The figure to the right shows what the longitude numbers represent in the graphs’ X-axis.
The project continues if any of my readers want to join in.
On Christmas Eve 1968 three Americans became the first humans to visit another world. What they did to celebrate was unexpected and profound, and will be remembered throughout all human history. Genesis: the Story of Apollo 8, Robert Zimmerman's classic history of humanity's first journey to another world, tells that story, and it is now available as both an ebook and an audiobook, both with a foreword by Valerie Anders and a new introduction by Robert Zimmerman.
The print edition can be purchased at Amazon or from any other book seller. If you want an autographed copy the price is $60 for the hardback and $45 for the paperback, plus $8 shipping for each. Go here for purchasing details. The ebook is available everywhere for $5.99 (before discount) at amazon, or direct from my ebook publisher, ebookit. If you buy it from ebookit you don't support the big tech companies and the author gets a bigger cut much sooner.
The audiobook is also available at all these vendors, and is also free with a 30-day trial membership to Audible.
"Not simply about one mission, [Genesis] is also the history of America's quest for the moon... Zimmerman has done a masterful job of tying disparate events together into a solid account of one of America's greatest human triumphs."--San Antonio Express-News