Another Mars location being considered for future helicopter mission
Click for original picture.
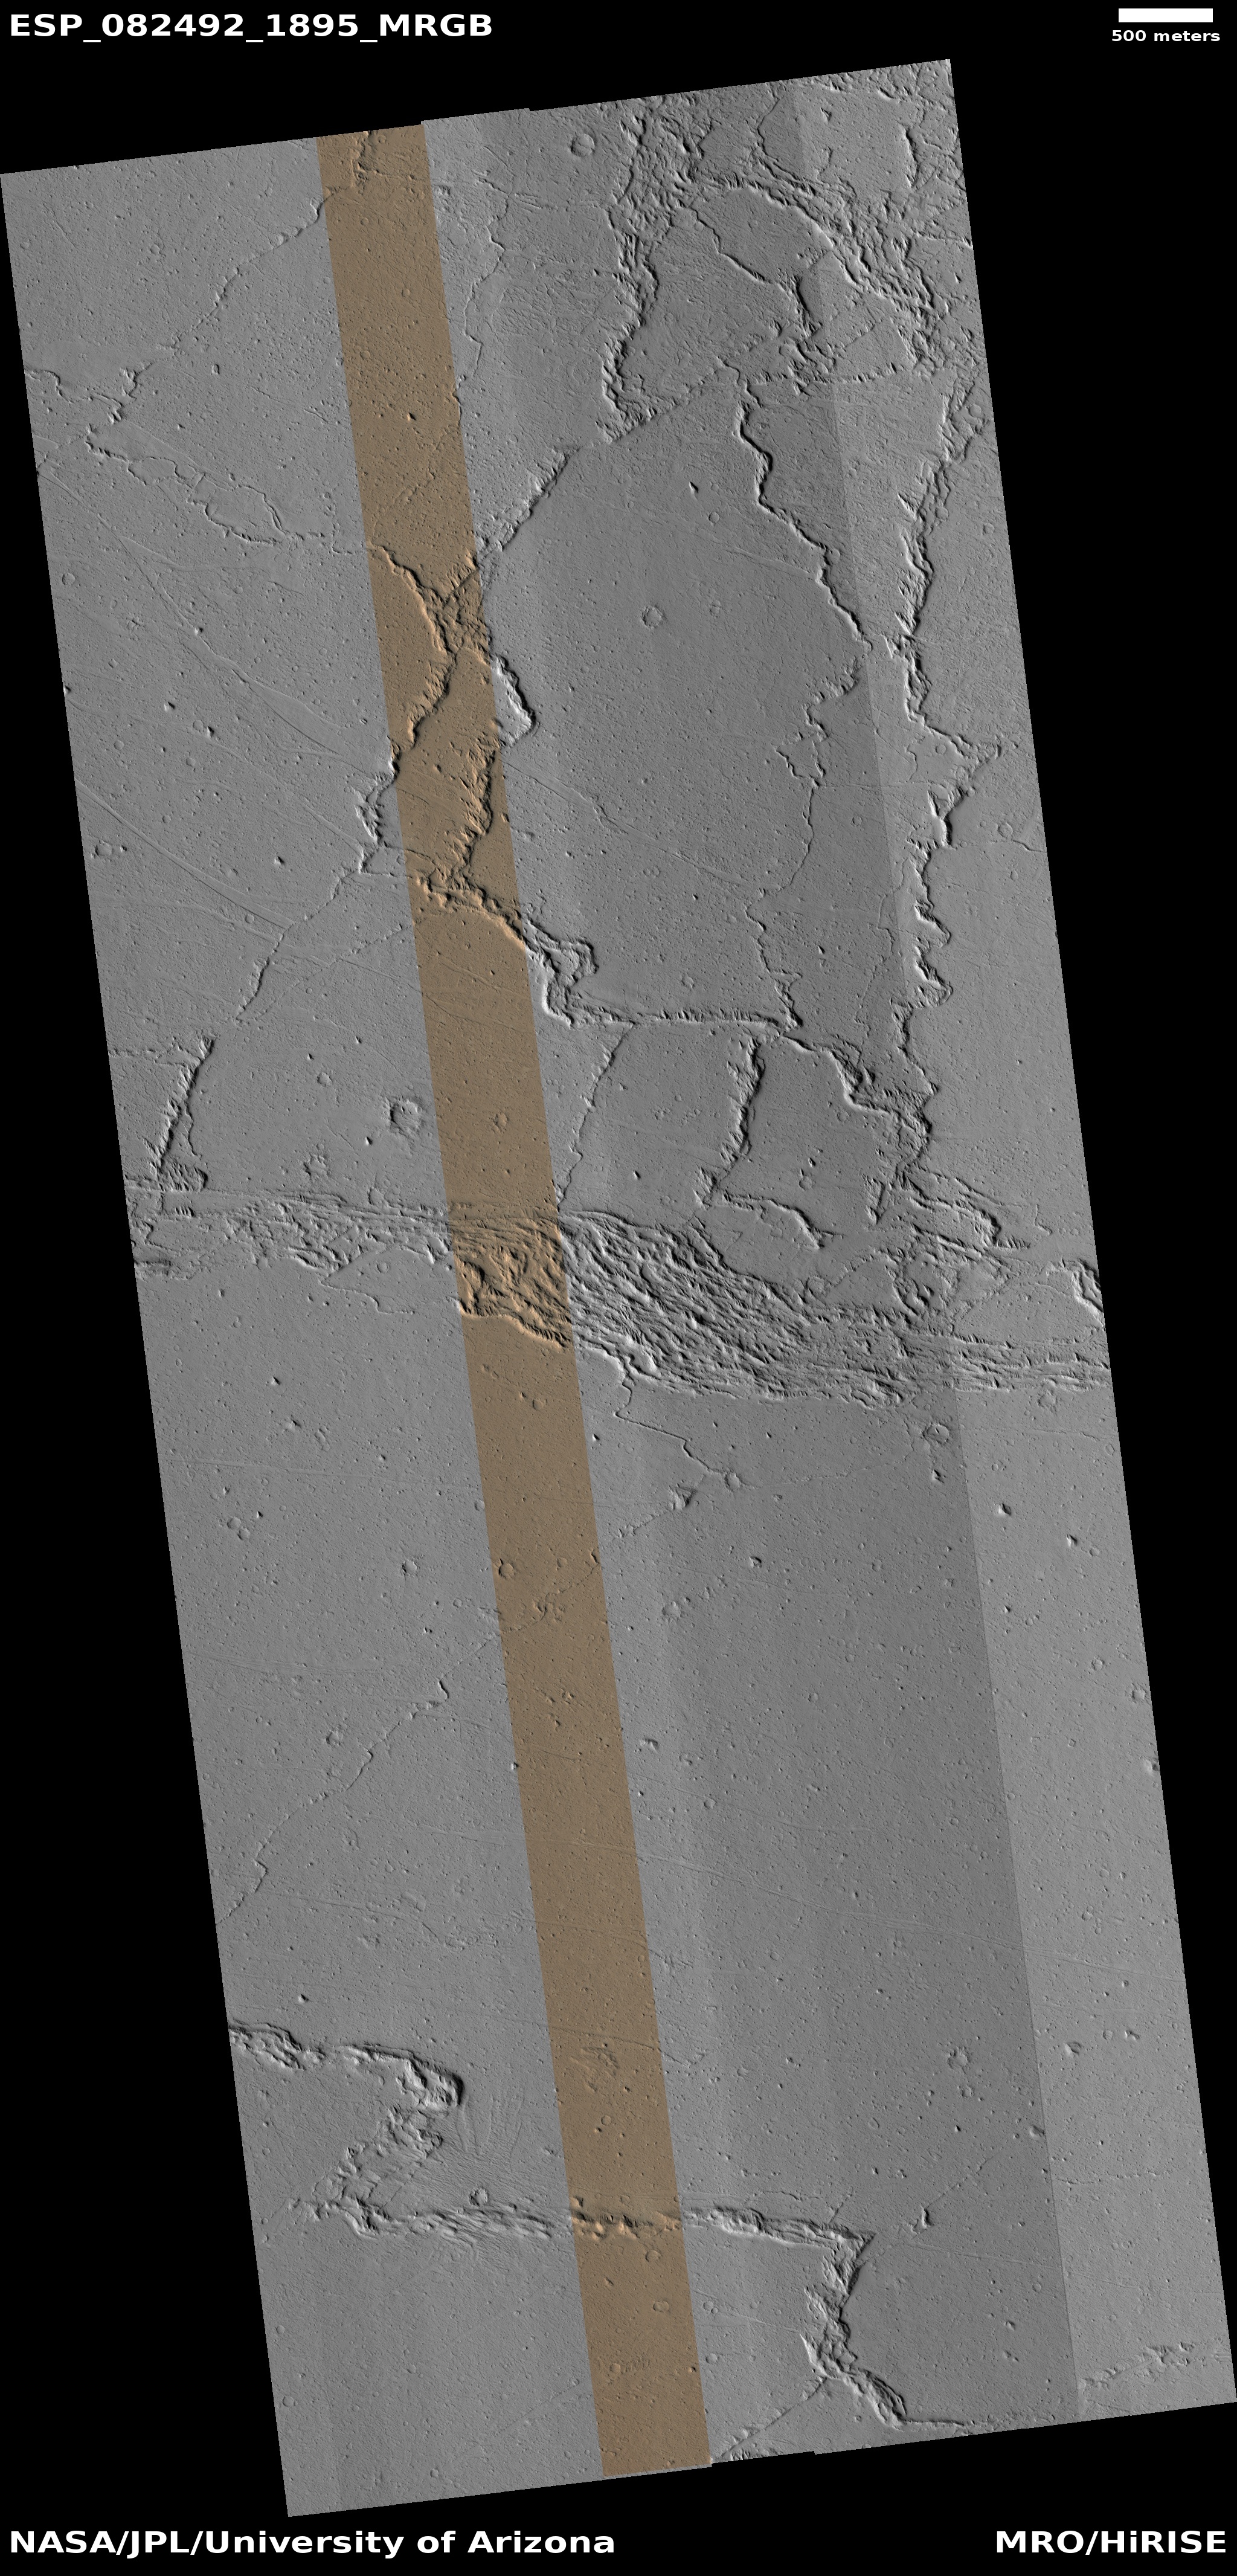
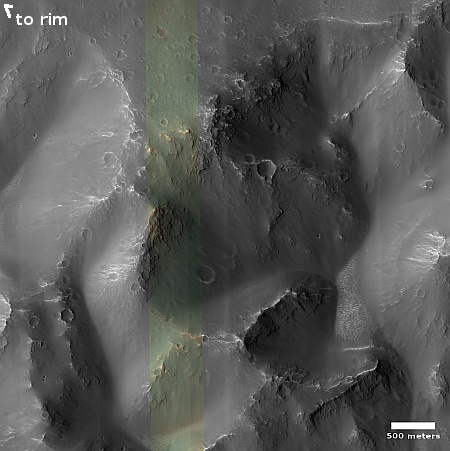
In today’s May download of new photos from Mars Reconnaissnce Orbiter (MRO) I came across the picture to the right, reduced and sharpened to post here, and taken on April 2, 2024 by MRO’s high resolution camera. The scientists labeled it “Sample Rim Traverse Hazards at Possible Mars Helicopter Landing Site.” It was clearly taken as part of preliminary research to determine some potential landing sites for a future Mars helicopter mission.
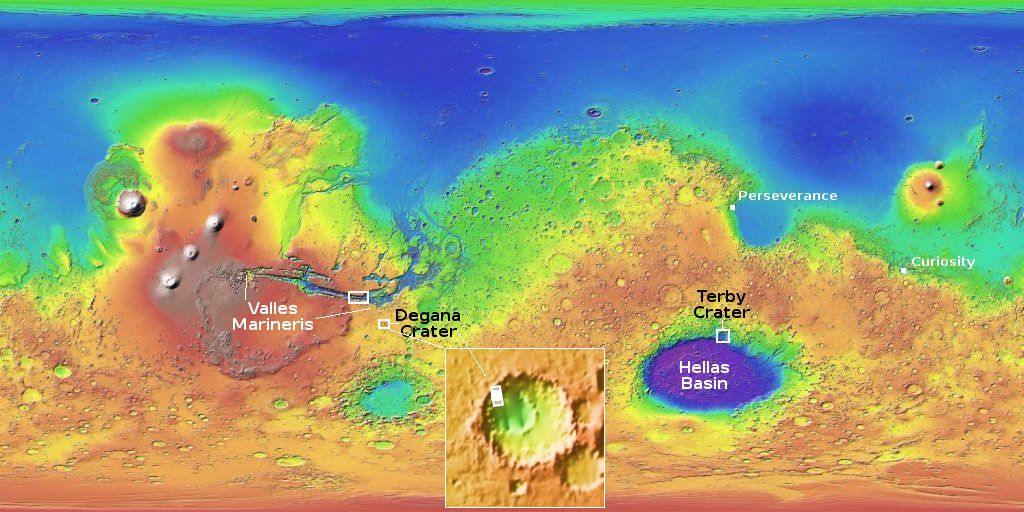
Nor is this the first such location or region on Mars targeted for such a mission. As shown in the global map above of Mars, colored by the elevation data from MRO (blue is low and orange is high), two other candidate sites are being looked at as well. About a half dozen pictures have been taken inside the eastern end of Valles Marineris, exploring a helicopter mission there. In addition, MRO took for the same purpose a recent photo of the floor of Terby Crater, on the northern interior slope of Hellas Basin.
» Read more

Click for original picture.
In today’s May download of new photos from Mars Reconnaissnce Orbiter (MRO) I came across the picture to the right, reduced and sharpened to post here, and taken on April 2, 2024 by MRO’s high resolution camera. The scientists labeled it “Sample Rim Traverse Hazards at Possible Mars Helicopter Landing Site.” It was clearly taken as part of preliminary research to determine some potential landing sites for a future Mars helicopter mission.
Nor is this the first such location or region on Mars targeted for such a mission. As shown in the global map above of Mars, colored by the elevation data from MRO (blue is low and orange is high), two other candidate sites are being looked at as well. About a half dozen pictures have been taken inside the eastern end of Valles Marineris, exploring a helicopter mission there. In addition, MRO took for the same purpose a recent photo of the floor of Terby Crater, on the northern interior slope of Hellas Basin.
» Read more