
Betelgeuse’s long predicted companion star confirmed
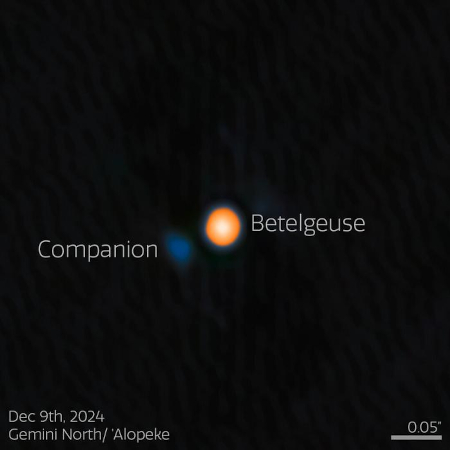
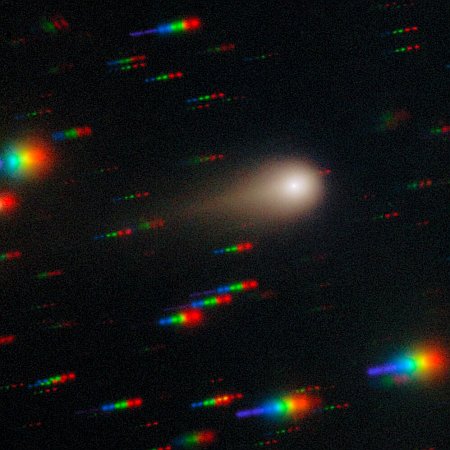
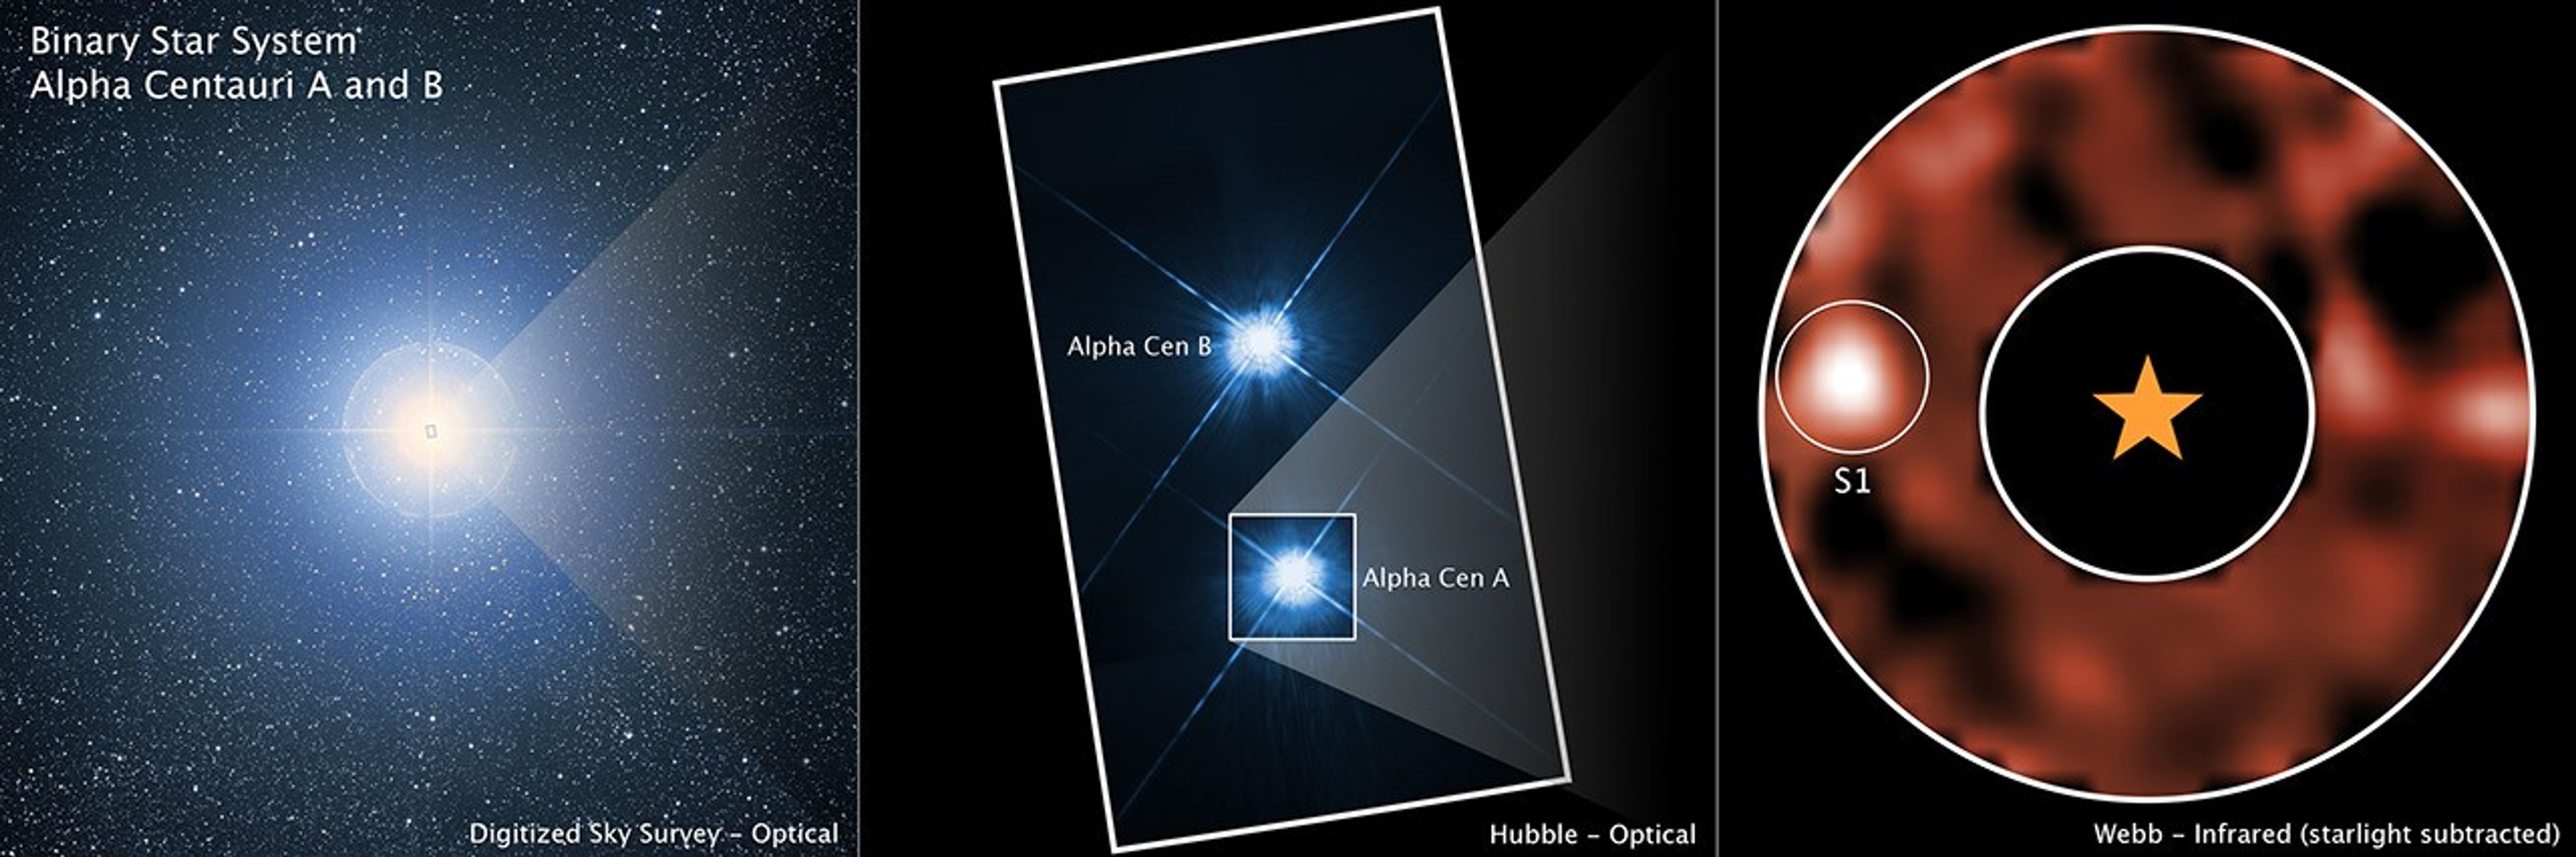
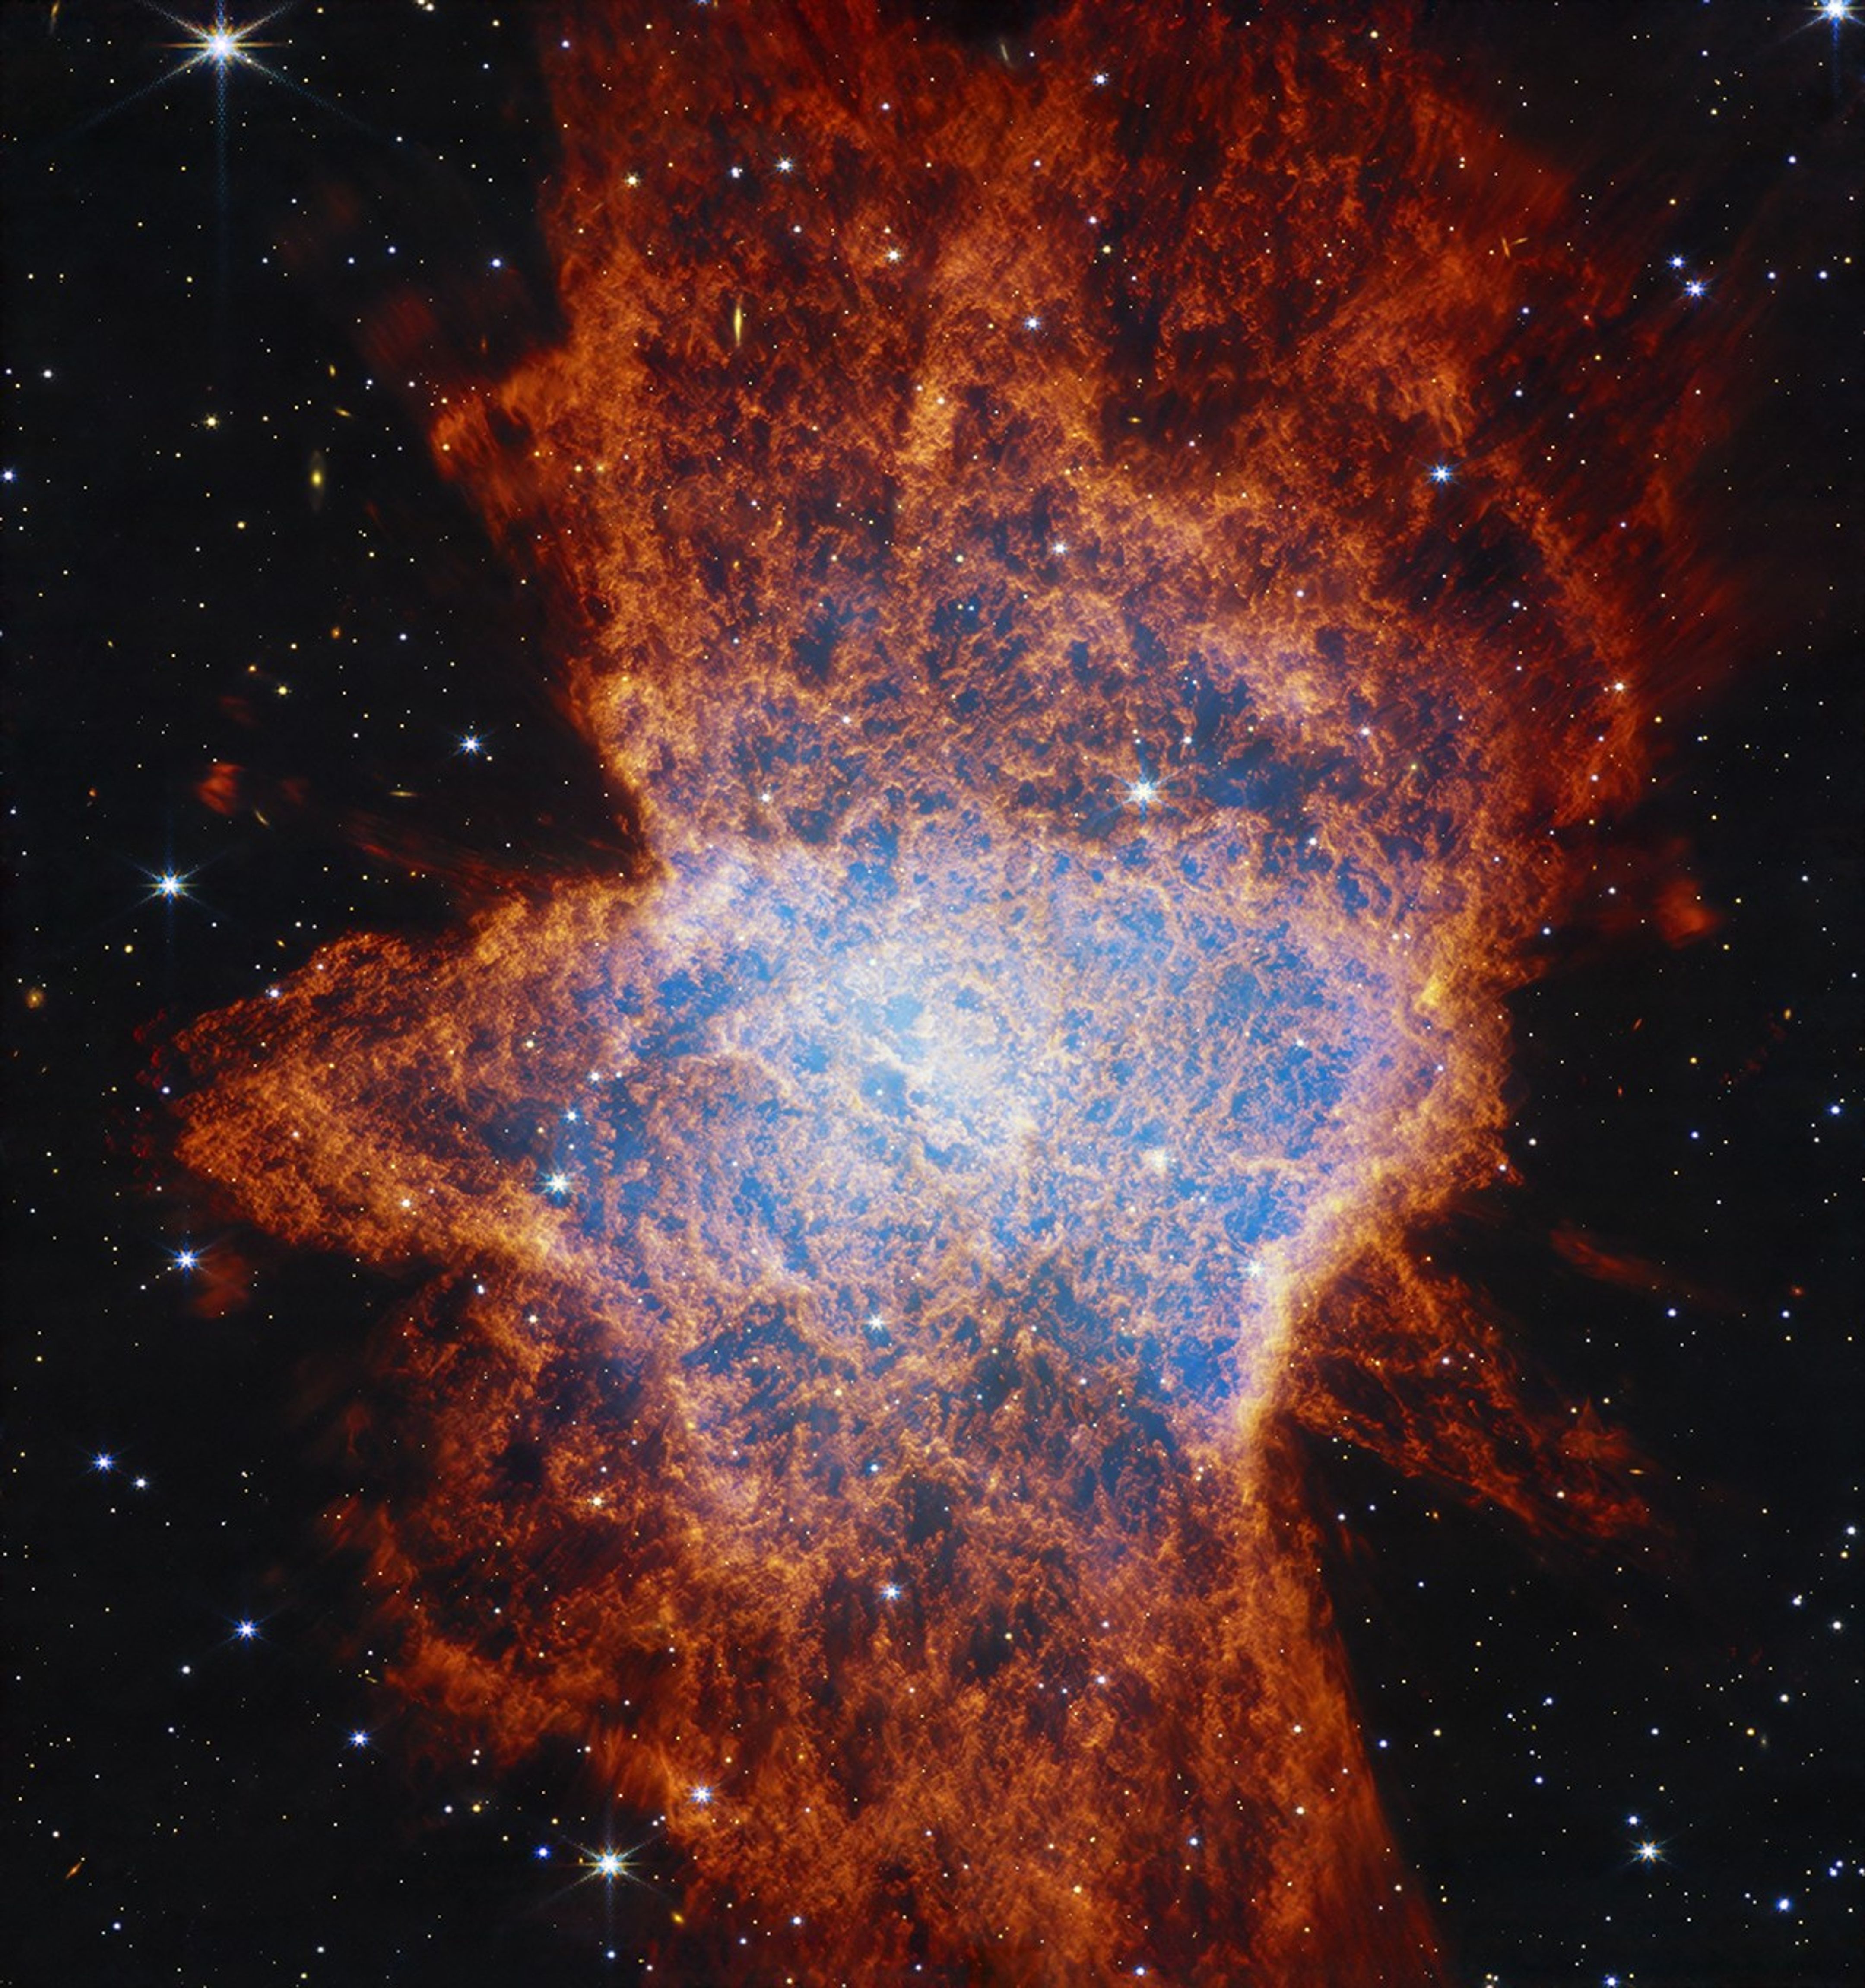
The image of the companion, released previously
in July 2025.
Astronomers have now confirmed prior observations announced in July 2025 of Betelgeuse’s long predicted companion star.
The July conclusions found faint evidence of the companion, shown to the right, from data collected by the Gemini telescope in Hawaii, when the modeling said the companion was at its farthest point from the central star.. This new research was based on new observations in December 2024 by the Hubble and Chandra space telescopes, taken at the same time.
During this ideal observational window, the Gemini North Telescope in Hawaii captured a faint image near Betelgeuse that could be its tiny companion. In a separate study, the Carnegie Mellon-led team used Chandra to collect X-ray data to determine the nature of the mysterious object. “It could have been a white dwarf. It could have been a neutron star. And those are very, very different objects,” O’Grady said. “If it was one of those objects, it would point to a very different evolutionary history for the system.”
But it wasn’t either. O’Grady and her collaborators found no evidence of accretion — a hallmark of compact objects like neutron stars or white dwarfs. Their findings, to be published in The Astrophysical Journal, point instead to a young stellar object roughly the size of the Sun. A companion paper from researchers at the Flatiron Institute, using Hubble data, helped narrow down the companion’s size.
You can read their paper here [pdf]. It estimates the companion to have a mass about 1.4 to 2 times that of the Sun.


