Contact lost with Voyager 2, hopefully temporarily

New but planned commands to Voyager 2, presently flying beyond the solar system, caused the spacecraft to point its antenna incorrectly so that communications with Earth have been lost.

A series of planned commands sent to NASA’s Voyager 2 spacecraft on July 21 inadvertently caused the antenna to point 2 degrees away from Earth. As a result, Voyager 2 is currently unable to receive commands or transmit data back to Earth.

Voyager 2 is located almost 12.4 billion miles (19.9 billion kilometers) from Earth and this change has interrupted communication between Voyager 2 and the ground antennas of the Deep Space Network (DSN). Data being sent by the spacecraft is no longer reaching the DSN, and the spacecraft is not receiving commands from ground controllers.

The spacecraft is also programmed to periodically reset its orientation so that its antenna points to Earth, with the next reset scheduled for October 15th. Engineers hope that at that point contact will be recovered.

If not, this incident will mark the end of the mission, which launched in 1977 and has been functioning for 46 years as it has made close fly-bys of Jupiter, Saturn, Uranus, and Neptune, and then eventually entering interstellar space.

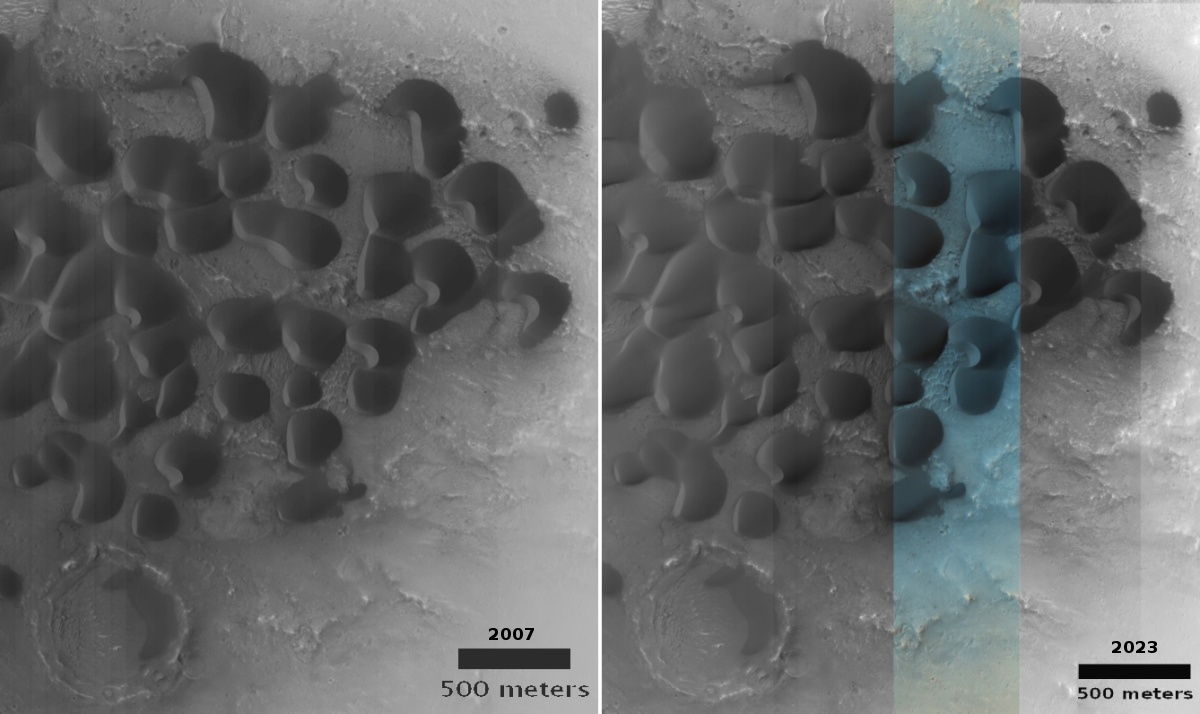
Endless dunes in the dry Martian equatorial region

Endless dunes in the dry Martian equatorial region
Click for original image.

Cool image time! The picture to the right, rotated, cropped, and sharpened to post here, was taken on May 14, 2023 by the high resolution camera on Mars Reconnaissance Orbiter (MRO). It shows a small section of a vast dune field, 50 miles square, that sits about 225 miles south of the southern foothills of Mars’ biggest volcano, Olympus Mons.

The dunes are probably less than 20 feet high, with that one small hill only slightly higher. Their similar orientation, which extends across the entire 50-mile-square dune field, indicates the direction of the prevailing winds, which I think (but will not swear to it) is from the southeast to the northwest, which also happens to also follow the grade downhill to the northwest.

It is also possible that wind direction is the reverse, and goes uphill to the southwest.
» Read more

Scientists think they have finally discovered what makes the Sun’s corona so hot

Using data from Europe’s Solar Orbiter spacecraft, scientists now think they have finally pinpointed the process that causes the Sun’s corona — its atmosphere — to be many times hotter than its surface.

For decades, scientists have been struggling to explain why temperatures in the sun’s outer atmosphere, the corona, reach mind-boggling temperatures of over 1.8 million degrees Fahrenheit (one million degrees Celsius). The sun’s surface has only about 10,000 degrees F (6,000 degrees C), and with the corona farther away from the source of the heat inside the star, the outer atmosphere should, in fact, be cooler.

New observations made by the Europe-led Solar Orbiter spacecraft have now provided hints to what might be behind this mysterious heating. Using images taken by the spacecraft’s Extreme Ultraviolet Imager (EUI), a camera that detects the high-energy extreme ultraviolet light emitted by the sun, scientists have discovered small-scale fast-moving magnetic waves that whirl on the sun’s surface. These fast-oscillating waves produce so much energy, according to latest calculations, that they could explain the coronal heating.

You can read the paper here [pdf]. The results have not yet been confirmed, but if so it will solve one of the space age’s oldest scientific mysteries.

Astronomers chemically map a significant portion of the Milky Way

The chemistry of the Milky Way's nearby spiral arms
Red indicates areas with lots of heavier elements, blue indicates
areas dominated by hydrogen and helium. Click for original image.

Astronomers have now used today’s modern survey telescopes — on Earth and in space — to map the chemistry of a large portion of the Milky Way’s nearby spiral arms, revealing that the arms themselves are rich in heavier elements, indicating greater age and the right materials to produce new stars and solar systems like our own.

If the Milky Way’s spiral arms trigger star births as predicted, then they should be marked by young stars, aka metal-rich stars. Conversely, spaces between the arms should be marked by metal-poor stars.

To confirm this theory, as well as create his overall map of metalicity, Hawkins first looked at our solar system’s galactic backyard, which include stars about 32,000 light years from the sun. In cosmic terms, that represents our stellar neighborhood’s immediate vicinity.

Taking the resultant map, the researcher compared it to others of the same area of the Milky Way created by different techniques, finding that the positions of the spiral arms lined up. And, because he used metalicity to chart the spiral arms, hitherto unseen regions of the Milky Way’s spiral arms showed up in Hawkins’ map. “A big takeaway is that the spiral arms are indeed richer in metals,” Hawkins explained. “This illustrates the value of chemical cartography in identifying the Milky Way’s structure and formation. It has the potential to fully transform our view of the Galaxy.”

You can read the science paper here [pdf]. Based on this initial mapping effort, it appears that it will not be long before a large percentage of our own galaxy will be mapped in this manner.

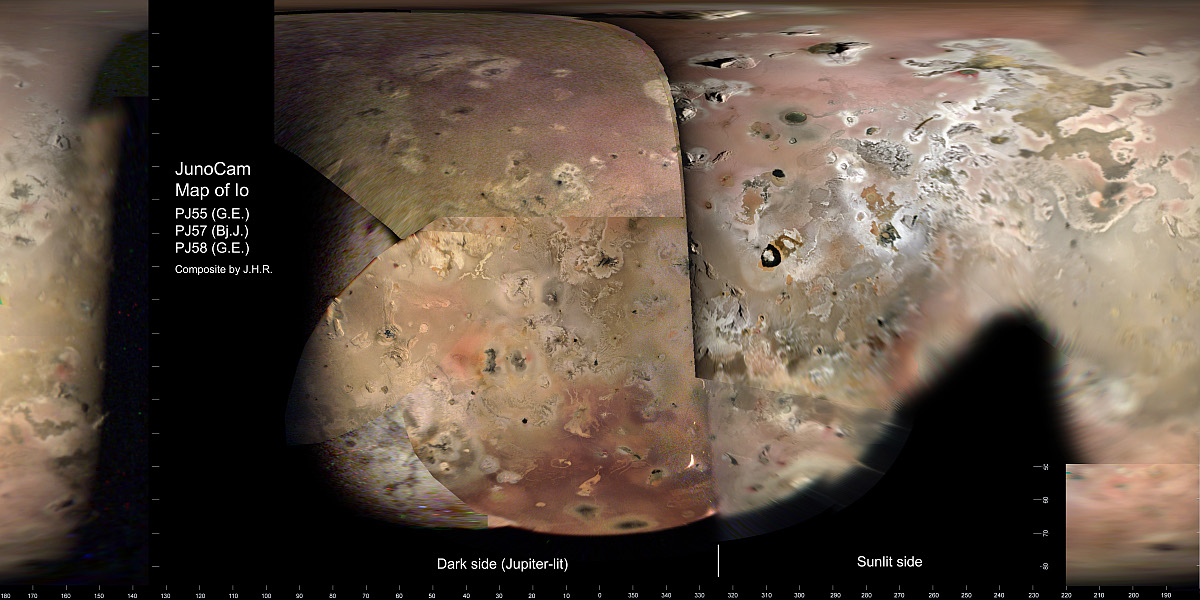
Juno’s next fly-by of Io coming on July 30

Io as seen by Juno
An image of Io from the March fly-by

The Juno science team is gearing up for the spacecraft’s next fly-by of the Jupiter moon Io, scheduled for July 30, 2023.

When NASA’s Juno mission flies by Jupiter’s fiery moon Io on Sunday, July 30, the spacecraft will be making its closest approach yet, coming within 13,700 miles (22,000 kilometers) of it. Data collected by the Italian-built JIRAM (Jovian InfraRed Auroral Mapper) and other science instruments is expected to provide a wealth of information on the hundreds of erupting volcanoes pouring out molten lava and sulfurous gases all over the volcano-festooned moon.

The image to the right was taken from 33,000 miles during the March fly-by, almost three times farther away. The dark spots are volcanoes, and some showed significant change from earlier images.

OSIRIS-REx completes last major mid-course correction before sending its sample capsule back to Earth

OSIRIS-REx yesterday completed a 63 second engine burn, successfully aiming the spacecraft so that its September 24th drop off of its sample capsule will hit the Earth as planned.

Preliminary tracking data indicates OSIRIS-REx changed its velocity, which includes speed and direction, by 1.3 miles, or 2 kilometers, per hour. It’s a tiny but critical shift; without course adjustments like this one the spacecraft would not get close enough to Earth on Sept. 24 to drop off its sample of asteroid Bennu. The spacecraft is currently 24 million miles, or 38.6 million kilometers, from Earth, traveling at about 22,000 miles, or about 35,000 kilometers, per hour.

In the two weeks prior to that drop-off the spacecraft will do two more short burns to refine its aim so that the sample capsule will land precisely as planned on the Defense Department’s Utah Test and Training Range near Salt Lake City.

Giant glaciers in the northern Martian mid-latitudes

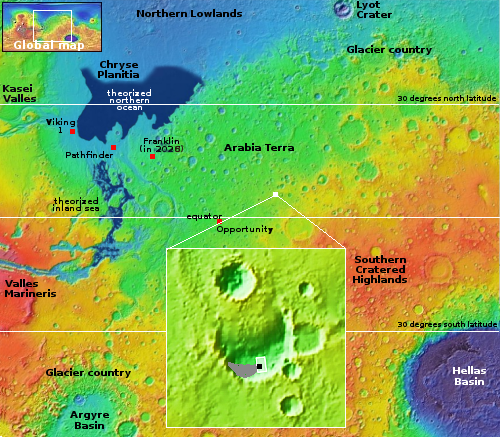
Overview map

Giant glaciers in the northern Martian mid-latitudes
Click for original image.

It is time for two cool images! The picture to the right, cropped, reduced, and sharpened to post here, was taken on May 10, 2023 by the high resolution camera on Mars Reconnaissance Orbiter (MRO), and is one of two glaciers imaged by MRO in May that are among a whole series of glaciers flowing down the south wall of the same mesa.

The red dot in the inset and on the overview map above marks the location of the picture to the right. The white dot marks the location of the May 27, 2023 picture, which can be seen here.

The unnamed 10,000-foot-high mesa from which these glaciers flow, located in the middle of the 2,000-mile-long northern mid-latitude strip I dub glacier glacier country, is about 41 miles long and 18 miles wide at its widest point. The glacier to the right falls about 6,000 feet in about four miles, making the grade steep, ranging from 15 to 23 degrees. That steepness explains the split in the glacier, as it flowed around a huge piece of higher bedrock in the middle of this descending hollow.

Both images provide further evidence of the dominance of glaciers in this mid-latitude region. While the glaciers are all covered with dust and debris to protect the ice, and are also thought at present to all be inactive, they also all suggest a very dynamic Martian geological and climate history, one that will likely come alive again as the planet’s rotational tilt naturally shifts back and forth from its present 25 degree tilt to 11 to 60 degrees.

The glaciers also show us again that Mars is not a dry desert, but above 30 degrees latitude it is an icy desert much like Antarctica. Colonists will have no trouble finding water.

Optical image of accretion disk around baby star, taken by ground-based VLT

Stellar accretion disk
Click for original image.

Scientists today released an optical image of the accretion disk that surrounds a baby star about 5,000 light years away, taken by ground-based Very Large Telescope (VLT) in Chile and enhanced by data from the Atacama Large Millimeter/submillimeter Array (ALMA), also in Chile.

That image, reduced to post here, is to the right. The bright blue spot in the center is the main star, with the smaller dot to the lower left a companion star. From the press release:

The VLT observations probe the surface of the dusty material around the star, while ALMA can peer deeper into its structure. “With ALMA, it became apparent that the spiral arms are undergoing fragmentation, resulting in the formation of clumps with masses akin to those of planets,” says Zurlo.

Astronomers believe that giant planets form either by ‘core accretion’, when dust grains come together, or by ‘gravitational instability’, when large fragments of the material around a star contract and collapse. While researchers have previously found evidence for the first of these scenarios, support for the latter has been scant.

This data suggests that the latter is being observed, the first time gravitational instability has been identified as it is happening. You can read the scientist’s research paper here [pdf].

Infrared Webb image of a binary baby star system and its surrounding jets and nebula

Webb infrared image of HH 46/47
Click for original image.

Cool image time! The infrared picture to the right, cropped, reduced, and sharpened to post here, was taken by the Webb Space Telescope of the jets and nebula of the Herbig–Haro object dubbed HH 46/47, thought to contain a pair of baby stars under formation.

The most striking details are the two-sided lobes that fan out from the actively forming central stars, represented in fiery orange. Much of this material was shot out from those stars as they repeatedly ingest and eject the gas and dust that immediately surround them over thousands of years.

When material from more recent ejections runs into older material, it changes the shape of these lobes. This activity is like a large fountain being turned on and off in rapid, but random succession, leading to billowing patterns in the pool below it. Some jets send out more material and others launch at faster speeds. Why? It’s likely related to how much material fell onto the stars at a particular point in time.­­­

The stars’ more recent ejections appear in a thread-like blue. They run just below the red horizontal diffraction spike at 2 o’clock. Along the right side, these ejections make clearer wavy patterns. They are disconnected at points, and end in a remarkable uneven light purple circle in the thickest orange area. Lighter blue, curly lines also emerge on the left, near the central stars, but are sometimes overshadowed by the bright red diffraction spike.

To see optical images of HH 46/47 as well as some further background, go here. It is one of the most studied HH objects, which is why it was given priority in Webb’s early observation schedule.

Swirling layers in the basement of Mars

Swirling layers in the basement of Mars
Click for original image.

Cool image time! The picture to the right, cropped, reduced, and sharpened to post here, was taken on March 31, 2023 by the high resolution camera on Mars Reconnaissance Orbiter (MRO).

In labeling this picture the science team focused on the many layers visible in these swirls, all suggesting a series of cyclical events, each laying down a new layer over many eons.

What caused the swirls? Looking at the lower right quadrant it appears that they were glacial, with the flow to the northwest but with each glacial layer smaller and not reaching as far.

This theory falls apart however at the curved depression, which instead suggests the swirl was traveling along a meandering canyon, going from the lower left to the upper right. If so, the curved depression is even more baffling. If ice it could have sublimated away, but its sharp edges suggest this isn’t ice but maybe a lava flow.
» Read more

NASA awards 11 small development contracts to a variety of companies

Capitalism in space: NASA today announced that it has awarded small contracts to eleven different companies, ranging from big established companies like ULA and Lockheed Martin to small startups like Varda and Zeno, for developing a range of new technologies, from power production on the Moon to making building materials from lunar soil.

Five of the technologies will help humanity explore the Moon. For astronauts to spend extended periods of time on the lunar surface, they will need habitats, power, transportation, and other infrastructure. Two of the selected projects will use the Moon’s own surface material to create such infrastructure – a practice called in-situ resource utilization, or ISRU. Redwire will develop technologies that would allow use of lunar regolith to build infrastructure like roads, foundations for habitats, and landing pads.

Blue Origin’s technology could also make use of local resources by extracting elements from lunar regolith to produce solar cells and wire that could then be used to power work on the Moon.

Astrobotic’s selected proposal will advance technology to distribute power on the Moon’s surface, planned to be tested on a future lunar mission. The company’s CubeRover would unreel more than half a mile (one kilometer) of high-voltage power line that could be used to transfer power from a production system to a habitat or work area on the Moon.

The contracts range in price from $1.6 to $34.7 million, with Blue Origin getting that largest award.

Rocket Lab delays its private mission to Venus two years to ’25

In order to focus at this time on its commercial customers, Rocket Lab has decided to reschedule its private mission to Venus, delaying its two years to the next launch window in 2025.

The mission appeared to still be on in May, before Rocket Lab quietly put it on the back-burner last month. Spokesperson Morgan Bailey said it had decided to delay the mission so it could concentrate on its commercial launches. “The decision was a business one and we look forward to delivering the Venus mission in 2025,” she said.

It also appears that the mission could be pushed back further if customer demand requires it.

No, that is not a sunspot on Mars!

No, that is not a sunspot on Mars!
Click for original image.

Cool image time! The picture to the right, cropped to post here, was taken on April 20, 2023 by the high resolution camera on Mars Reconnaissance Orbiter (MRO). While at first glance this Martian terrain vaguely resembles the granular surface of the Sun, with the largest depression having its own faint resemblance to a sunspot, the resemblance exists only in our feverish imagination.

The depression might have been formed by an impact, though it is also possible it is a caldera, not of lava but of ice processes. The granular surface is likely resulting from the sublimation of ice, creating random holes and ridges as underground material changes from ice to gas and escapes at weak points on the surface.

My guess that we are looking at ice processes is based on the location, not far from where the first manned spacecraft will likely land.
» Read more

Spirals within spirals

Spirals within spirals
Click for original image.

Cool image time! The picture to the right, cropped, reduced, and annotated to post here, was taken by the Hubble Space Telescope as part of two different research projects that are studying galaxies where supernovae previously occurred. This particular galaxy is estimated to be about 192 million light years away, and is a classic example of a barred spiral.

Despite appearing as an island of tranquillity in this image, UGC 12295 played host to a catastrophically violent explosion — a supernova — that was first detected in 2015. This supernova prompted two different teams of astronomers to propose Hubble observations of UGC 12295 that would sift through the wreckage of this vast stellar explosion.

Supernovae are the explosive deaths of massive stars, and are responsible for forging many of the elements found here on Earth. The first team of astronomers used Hubble’s Wide Field Camera 3 (WFC3) to examine the detritus left behind by the supernova in order to better understand the evolution of matter in our Universe.

The second team of astronomers also used WFC3 to explore the aftermath of UGC 12295’s supernova, but their investigation focused on returning to the sites of some of the best-studied nearby supernovae. Hubble’s keen vision can reveal lingering traces of these energetic events, shedding light on the nature of the systems that host supernovae.

What struck me about this picture however were the many smaller spiral galaxies scattered nearby and behind UGC 12295, with one face-on spiral highlighted near the top. I can count at least three or four other background spiral galaxies, all reddish in color likely because their light has been shifted to the red due to their distance.

Strings of Martian cones

Strings of Martian cones

Cool image time! The picture to the right, cropped and reduced to post here, was taken on May 25, 2023 by the high resolution camera on Mars Reconnaissance Orbiter (MRO). The scientists describe these cones as “longitudinally aligned cones,” but this is puzzling since the alignment runs from the northwest to the south east, not north-south along the longitude.

No matter. The alignment is in itself the mystery, especially because the full image shows many more strings of cones in this area, all running from the northwest to the southeast. The strings also are all curved in the same way, sagging to the southwest as if expressing a wave flowing in that direction.

What could create these strings of cones? The overview map below gives us a hint.
» Read more

Chandrayaan-3 completes fourth engine burn in Earth orbit

Chandrayaan-3's mission profile

According to India’s space agency ISRO, engineers have successfully completed the fourth of about six engine burns designed to raise Chandrayaan-3’s Earth orbit in preparation for sending it on its path to the Moon.

As shown in the graphic to the right, these adjustments are relatively small, but each increases the speed of the spacecraft at its orbit’s closest point to the Earth. That extra velocity thus reduces the amount of fuel needed for that trans-lunar-injection burn.

If all the maneuvers continue to go as planned, the landing attempt will occur around August 23, 2023.

South Korean researchers turn simulated lunar soil into building blocks

Using simulated lunar soil, South Korean researchers have developed the engineering that turns that soil into building blocks shaped as needed.

The researchers first produce simulated moon soil by grinding black volcanic rock from Cheorwon County bordering the North. They then use a microwave to turn the sand-like simulant into solidified blocks. Lee said the team has developed a technique to make blocks by heating the soil in a mold to more than 1,000 degrees Celsius in two to three hours and cooling them. In space, the process could be powered by nuclear energy.

The article at the link also provides a nice summary of the status of South Korea’s entire space effort.

Unknown Mars

MRO context camera mosaic
Click for interactive global mosaic.

Cool image time! The picture to the right was created from a global mosaic of all the context camera images taken by Mars Reconnaissance Orbiter (MRO) since it entered Mars orbit in 2006. It shows an unnamed 17-mile-wide-depression located only about seven miles south of the southern rim of Valles Marineris.

I highlight this particular depression because, despite seventeen years in orbit, MRO’s high resolution camera has at this time still not taken any pictures inside or around it. This is a place on Mars that remains unstudied in detail, in any way, even though its depth is comparable to the Grand Canyon and its features strongly suggest its is a collapse feature, created when the roof over an underground void gave way. If so, it suggests an origin for Valles Marineris that conflicts with present theories.
» Read more

Hubble image shows several dozen boulders flung from Dimorphos

Boulders drifting from Dimorphos
Click for original image.

Using the Hubble Space Telescope, astronomers have photographed several dozen boulders that were flung off of the asteroid Dimorphos following the impact by the space probe DART. The picture to the right, reduced and brightened to more clearly show those boulders, was taken on December 19, 2022, four months after DART’s impact.

These are among the faintest objects Hubble has ever photographed inside the Solar System. The ejected boulders range in size from 1 meter to 6.7 meters across, based on Hubble photometry. They are drifting away from the asteroid at around a kilometre per hour.

The blue streak is the dust tail that has streamed off of Dimorphos since the impact, pushed away from the sun by the solar wind.

The possibility of more than one exoplanet sharing the same orbit

PDS 70, as seen by ALMA
The Trojan debris clouds around PDS 70, as seen by ALMA

The uncertainty of science: Astronomers have detected evidence that suggests the possibility of more than one exoplanet sharing the same orbit around PDS 70, a star 400 light years away.

This young star is known to host two giant, Jupiter-like planets, PDS 70b and PDS 70c. By analysing archival ALMA observations of this system, the team spotted a cloud of debris at the location in PDS 70b’s orbit where Trojans are expected to exist.

Trojans occupy the so-called Lagrangian zones, two extended regions in a planet’s orbit where the combined gravitational pull of the star and the planet can trap material. Studying these two regions of PDS 70b’s orbit, astronomers detected a faint signal from one of them, indicating that a cloud of debris with a mass up to roughly two times that of our Moon might reside there.

The press release — as well as most news reports — touts the possibility that they have found a second planet in this orbit. They have not, and are likely not going to. As noted above, the data indicates the presence of “a cloud of debris”, which is most likely a clustering of Trojan asteroids, just as the more than 12,000 asteroids we see in the two Trojan points in Jupiter’s orbit.

Nonetheless, this is the first detection of what appears to be a Trojan clustering in the accretion disk of a young star.

Scientists discover in archival data a slowly pulsing object that has been beating since 1988

The uncertainty of science: Using archival data, scientists have discovered a previously undetected but very strange slowly pulsing object that has been doing so since 1988.

Astronomers have found an ultra-slow, long-lasting source of radio-wave pulses, and they are perplexed as to its true nature. While “regular” radio pulsars have very short periods, from seconds down to just a few milliseconds, this source emits a brief pulse of radio waves about three times per hour. What’s more, it has been doing this for decades. “I do not think we can say yet what this object is,” says Victoria Kaspi (McGill University), a pulsar researcher who was not involved in the new study.

Natasha Hurley-Walker (Curtin University, Australia) and her colleagues discovered the mysterious source in data from the Murchison Widefield Array (MWA) observatory in Western Australia. They carried out follow-up observations with the MWA and with other radio observatories in Australia and South Africa. Known as GPM J1839-10, the tardy blinker is located at a distance of some 18,500 light-years away in the constellation Scutum. Archival data from the Very Large Array in New Mexico and the Indian Giant Metrewave Radio Telescope reveal that it has been pulsating at least since 1988, with a period of just under 22 minutes (1,318.1957 seconds, to be precise).

In a sense, the object is a pulsar, since on a very basic level it does what all pulsars do, send a radio beat in our direction in a precise pattern. The problem is that according to present theories that say pulsars are actually magnetized neutron stars rotating quickly, this object is rotating too slowly to be one.

Ancient lava vent high on a Martian volcano

Ancient lava vent high on a Martian volcano
Click for original image.

Today’s cool image illustrates the once violent and active volcanic past of Mars, now long dormant. The picture to the right, cropped, reduced, and sharpened to post here, was taken on May 11, 2023 by the high resolution camera on Mars Reconnaissance Orbiter (MRO). It shows what the scientists label as a “vent and channel” located high on the northeast flanks of the giant volcano Arsia Mons.

The rim around the vent suggests that lava had once bubbled up out of the vent and hardened around it, as most of the lava flowed downhill along the channel. And though this vent appears to be the source of this channel, it is not. The channel continues to the southwest uphill until it reaches the edge of Arsia Mons’ caldera, a region where there are many such vents, many much larger and deeper than this one.
» Read more

Stanford president resigns due to research fraud allegations

The president of Stanford University, Marc Tessier-Lavigne, has now resigned because of allegations of fraud and data manipulation in papers published by him and others.

The report finds that overall Tessier-Lavigne “did not have actual knowledge of any manipulation of research data” and “was not reckless in failing to identify” the problems in the papers. Yet it concludes that he did not respond adequately when concerns were raised about the papers on PubPeer or by a colleague at four different points over 2 decades—most recently in March 2021. For example, it chides him for failing to follow up when Science did not publish the corrections he submitted.

The report also faults Tessier-Lavigne for his “suboptimal” decision not to correct or retract the 2009 Nature paper, despite “vigorous discussions” about what to do; instead, he and colleagues published follow-up papers revising the findings. Without “an appropriate appetite” for corrections, “the often-claimed self-correcting nature of the scientific process will not occur,” the report says.

In other words, he too often looked the other way when associates were sloppy or were found to have faked data.

This story is an addendum to one I posted yesterday, where a researcher in 2020 had found 1 in 4 clinical trials to be either unreliable or fraudulent. His revelation however was ignored by the medical community, just as Tessier-Lavigne ignored fraud or sloppiness at his own lab.

Nor has anything really changed in the medical research community. Though Tessier-Lavigne has stepped down, the actual perpetrators of the fraud are facing no punishment.

Despite the findings of data manipulation, the report does not assign responsibility to any specific members of Tessier-Lavigne’s lab or determine whether the data manipulation fit the federal definition of research misconduct, “fabrication, falsification, fabrication, or plagiarism.” Whether the findings should be reported to the federal Office of Research Integrity will be up to Stanford, Filip says.

It appears we can trust little from the modern medical research community. There is certainly good work being done, but telling the difference between the good and the bad is now very difficult, if not impossible.

Astronomers detect white dwarf star with two faces

The uncertainty of science: Astronomers using ground-based telescopes have discovered a white dwarf star in which the surface chemistry of its two hemispheres are very different, one strongly dominated by hydrogen while the other instead dominated by helium.

The team used the Low Resolution Imaging Spectrometer (LRIS) on the Keck I Telescope to view Janus in optical wavelengths (light that our eyes can see) as well as the Near-Infrared Echellette Spectrograph (NIRES) on the Keck II Telescope to observe the white dwarf in infrared wavelengths. The data revealed the white dwarf’s chemical fingerprints, which showed the presence of hydrogen when one side of the object was in view (with no signs of helium), and only helium when the other side swung into view.

The article lists a lot of proposed explanations, most of which suggest the star’s magnetic field is acting to segregate the materials. All assume these observations are certain and that there is no mixing at all, something we should doubt considering the resolution of the data (a mere point that is rotating).

Glacial evidence in the dry equatorial regions of Mars?

Is this evidence of glacial ice in the Martian dry equatorial regions?
Click for original image.

Cool image time! The picture to the right, rotated, cropped, rotated, and sharpened to post here, was taken on June 3, 2023 by the high resolution camera on Mars Reconnaissance Orbiter (MRO). It shows the eastern half of a six-mile-wide unnamed crater with a depth of about 1,500 to 2,000 feet from rim to floor.

What makes this picture significant is the patchy material in the center of that crater floor, some of which looks almost like very old peeling paint. It also resembles the kind of glacial features routinely seen in many craters poleward of 30 degrees latitude on Mars.

Is this another example of such glacial features? If so, its location is what makes it significant.
» Read more

The results of one in four medical clinical trials are probably fraudulent or unreliable

In 2020 a researcher in Great Britain decided to analyze the raw data used by 500 medical clinical trials, and found that one in four contained fraudulent or unreliable data.

Carlisle, an anaesthetist who works for England’s National Health Service, is renowned for his ability to spot dodgy data in medical trials. He is also an editor at the journal Anaesthesia, and in 2017, he decided to scour all the manuscripts he handled that reported a randomized controlled trial (RCT) — the gold standard of medical research. Over three years, he scrutinized more than 500 studies.

For more than 150 trials, Carlisle got access to anonymized individual participant data (IPD). By studying the IPD spreadsheets, he judged that 44% of these trials contained at least some flawed data: impossible statistics, incorrect calculations or duplicated numbers or figures, for instance. And 26% of the papers had problems that were so widespread that the trial was impossible to trust, he judged — either because the authors were incompetent, or because they had faked the data.

Carlisle called these ‘zombie’ trials because they had the semblance of real research, but closer scrutiny showed they were actually hollow shells, masquerading as reliable information. Even he was surprised by their prevalence. “I anticipated maybe one in ten,” he says.

There is the real story, however.

Carlisle rejected every zombie trial, but by now, almost three years later, most have been published in other journals — sometimes with different data to those submitted with the manuscript he had seen. He is writing to journal editors to alert them, but expects that little will be done.

In other words, the peer-review medical community continues to allow fake research to be published, even when it has been warned that research is fake.

But of course, we must trust everything they tell us. They are SCIENTISTS, and we must “follow the SCIENCE!”

Flat-topped Martian mesa

Flat-topped mesa on Mars
Click for original image.

Cool image time! The picture to the right, rotated, cropped, and reduced to post here, was taken on April 18, 2023 by the high resolution camera on Mars Reconnaissance Orbiter (MRO). It shows only one of many flat-topped mesas in a chaos terrain region dubbed Oxia Chaos.

The mesa top is about 540 feet above the floor of the canyon to the north, which in turn is about 840 feet below the flat terrain north of it. That flat terrain to the north is not part of the chaos terrain, however, but the northern rim of the plateau that surrounds the chaos. Moreover, this particular piece of rim is separating from the plateau, as shown near the top of this January 16, 2008 context camera image from MRO. At some point in the future it will break off and fall into that canyon and on top of this mesa.
» Read more

Chandrayaan-3 completes second orbital maneuver

Chandrayaan-3's mission profile

According to India’s space agency ISRO, its lunar lander/rover Chandrayaan-3 today completed second orbital maneuver, raising the spacecraft’s orbit around the Earth from 41,762 by 173 kilometers to 41,603 x 226 kilometers.

The graphic to the right shows the entire mission profile of Chandayaan-3. It still has three more orbital adjustments to make in Earth orbit before it does its trans-lunar-injection burn to send it to the Moon. Once it arrives in lunar orbit it will then have to make six orbital adjustments to lower its orbit before making the descent to the surface.

The lunar landing itself is presently scheduled for August 23, 2023.

Another look at the vastness of Valles Marineris on Mars

The vast Valles Marineris
Click for interactive map.

This week I have returned several times to the giant Valles Marineris canyon on Mars in an attempt to capture its incomprehensible and glorious scale. Without question this canyon is going to become one of the prime tourist spots when humans begin living and working throughout the solar system. Fortunately, its vast size will mean that it will take many many centuries before it even becomes close to crowded there.

Today I try a different approach, using the global mosaic created by scientists at Caltech from the context camera images taken by Mar Reconnaissance Orbiter (MRO). That mosaic processes the images to allow one to see the surface from an oblique angle. The picture to the right covers one small part of the eastern end of Valles Marineris (the white rectangle in the inset), but though small the scale once again is gigantic.

The three white dots are our reference points, one on the north rim, one on the south, and one in the middle on the peak of that central mountain chain. Beginning from the south, the distance from the rim to the middle mountain peak is 43 miles, with the elevation dropping almost 13,000 feet to the floor of the south canyon, than rising almost 10,000 feet to the middle peak. The northern canyon is smaller. From the peak to the north rim is 27 miles, dropping about 9,300 feet and then rising about 8,500 feet to the north rim.

From rim to rim the distance is about 70 miles. Since the middle mountain chain about 18 miles wide, it fills only about 25% of the entire canyon.

In every case, the Grand Canyon would be merely be a small side canyon here. The depths are twice as deep, and the distances are many times larger. In width alone at this point Valles Marineris is seven times wider than the widest part of the Grand Canyon, and this is by far not Valles Marineris’s widest point.
» Read more

India successfully launches Chandrayaan-3


Click for interactive map.

India today successfully launched its Chandrayaan-3 lunar lander/rover probe toward the Moon, carried aloft by its LV-M3 rocket (a variation of its GSLV) from its coastal spaceport in Sriharikota.

Chandrayaan-3 carries the Vikram lander, which will bring the Pragyan rover to the surface. Pragyan will spend about two weeks operating on the lunar surface. The location is indicated by the red dot on the map to the right, in the high southern latitudes. The white cross marks the lunar south pole. Russia’s Luna-25 is scheduled to launch sometime in mid-August.

It will take time to get Chandrayaan-3 into the right lunar orbit for landing, which is presently scheduled for August 13, 2023.

For India this was its fifth successful launch for the year, the most since 2019, before it panicked over COVID. The leaders in the 2023 launch race:

46 SpaceX
26 China
9 Russia
5 Rocket Lab
5 India

American private enterprise still leads China in successful launches 52 to 26, and the entire world combined 52 to 45, while SpaceX by itself still leads the rest of the world (excluding other American companies) 46 to 45.

1 31 32 33 34 35 276