Infeeder to a Martian paleolake

Click for original image.
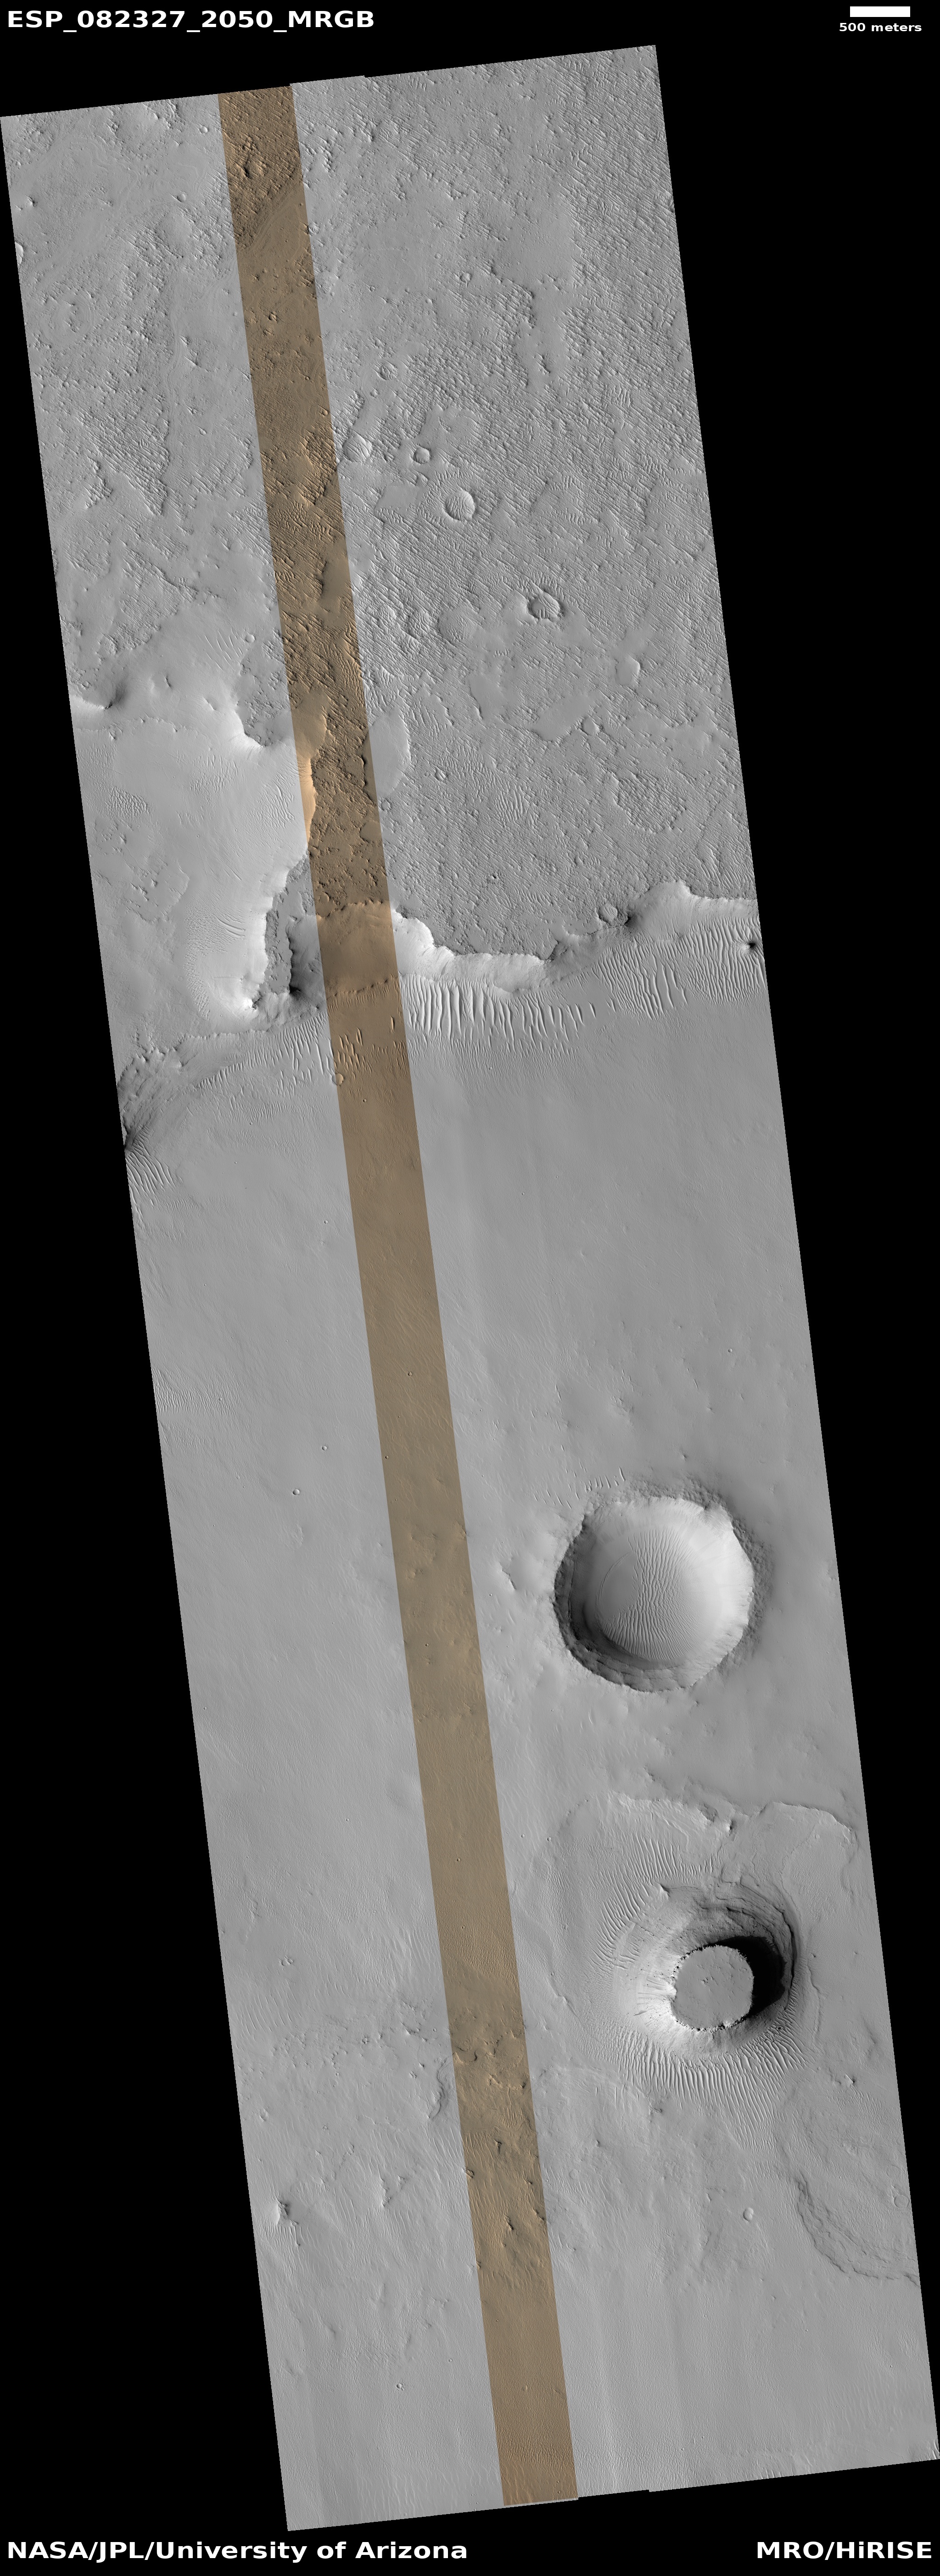
Cool image time! The picture to the right, rotated, cropped, and reduced to post here, was taken on December 21, 2023 by the high resolution camera on Mars Reconnaissance Orbiter (MRO). It shows what the scientists label as an “inlet to a paleolake.” I have used this context camera lower resolution image taken January 14, 2023 to fill in the blank central strip caused by a failed filter on the high resolution camera.
The elevation difference between the plateau on the lower left and the lake bottom on the upper right is about 700 feet. The inlet channel floor is about 200 feet below the plateau. We know it is ancient because of the number of small craters within it as well as on the lakebed below. It has been a very long time since any water or ice flowed down this channel to drain into the lake to the north.
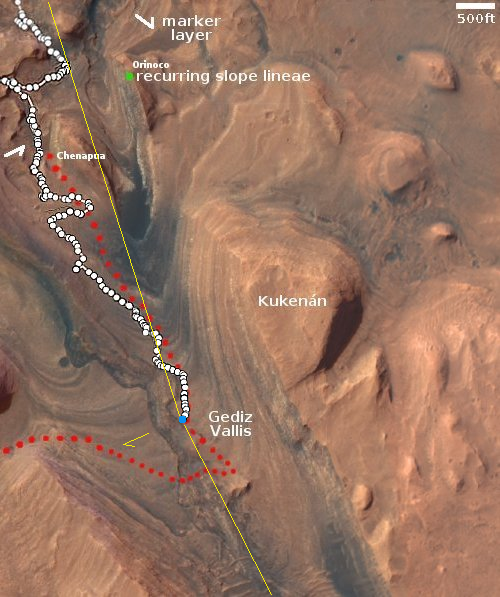
While a lot of analysis of orbital data has found numerous examples of paleolakes in the dry equatoral regions of Mars (see here, here, here, here, and here , this particular example is so obvious not much analysis is needed, as shown in the overview map below.
» Read more