
Land of dust devils

Click for original image.
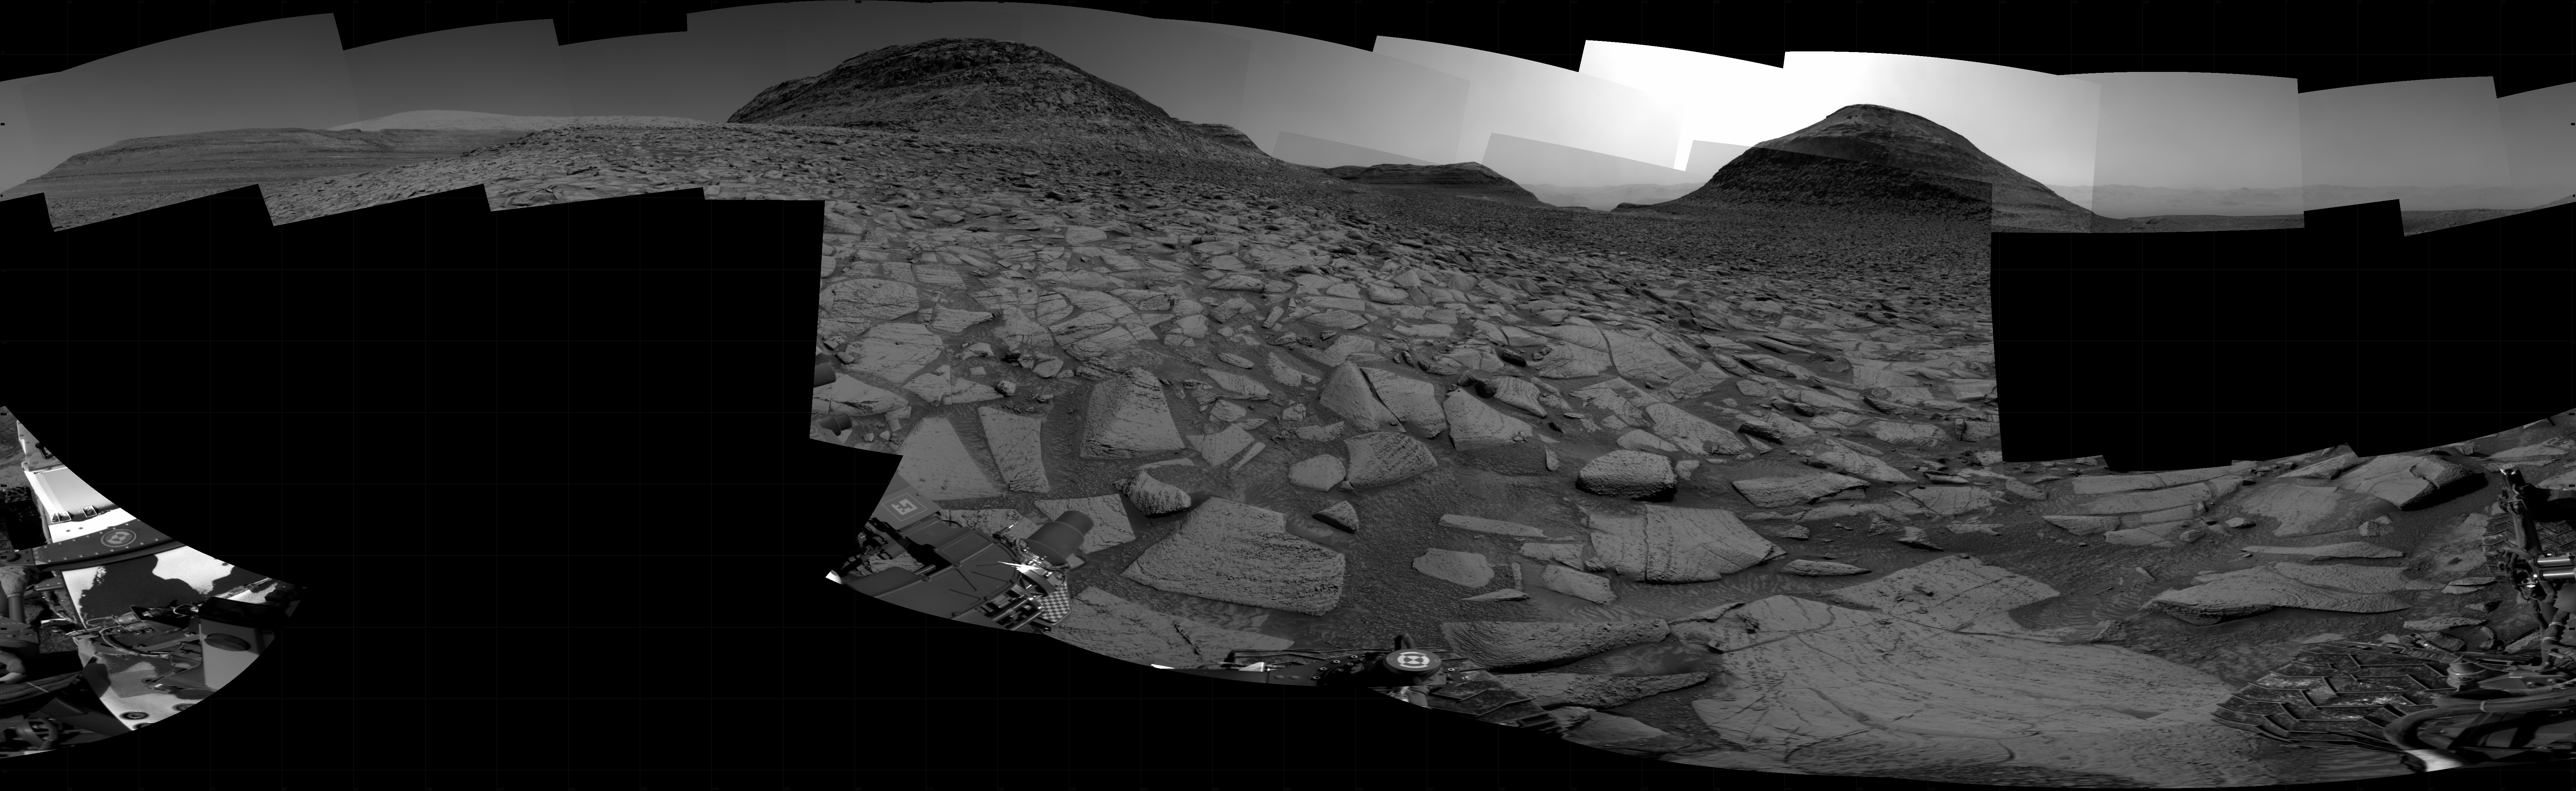
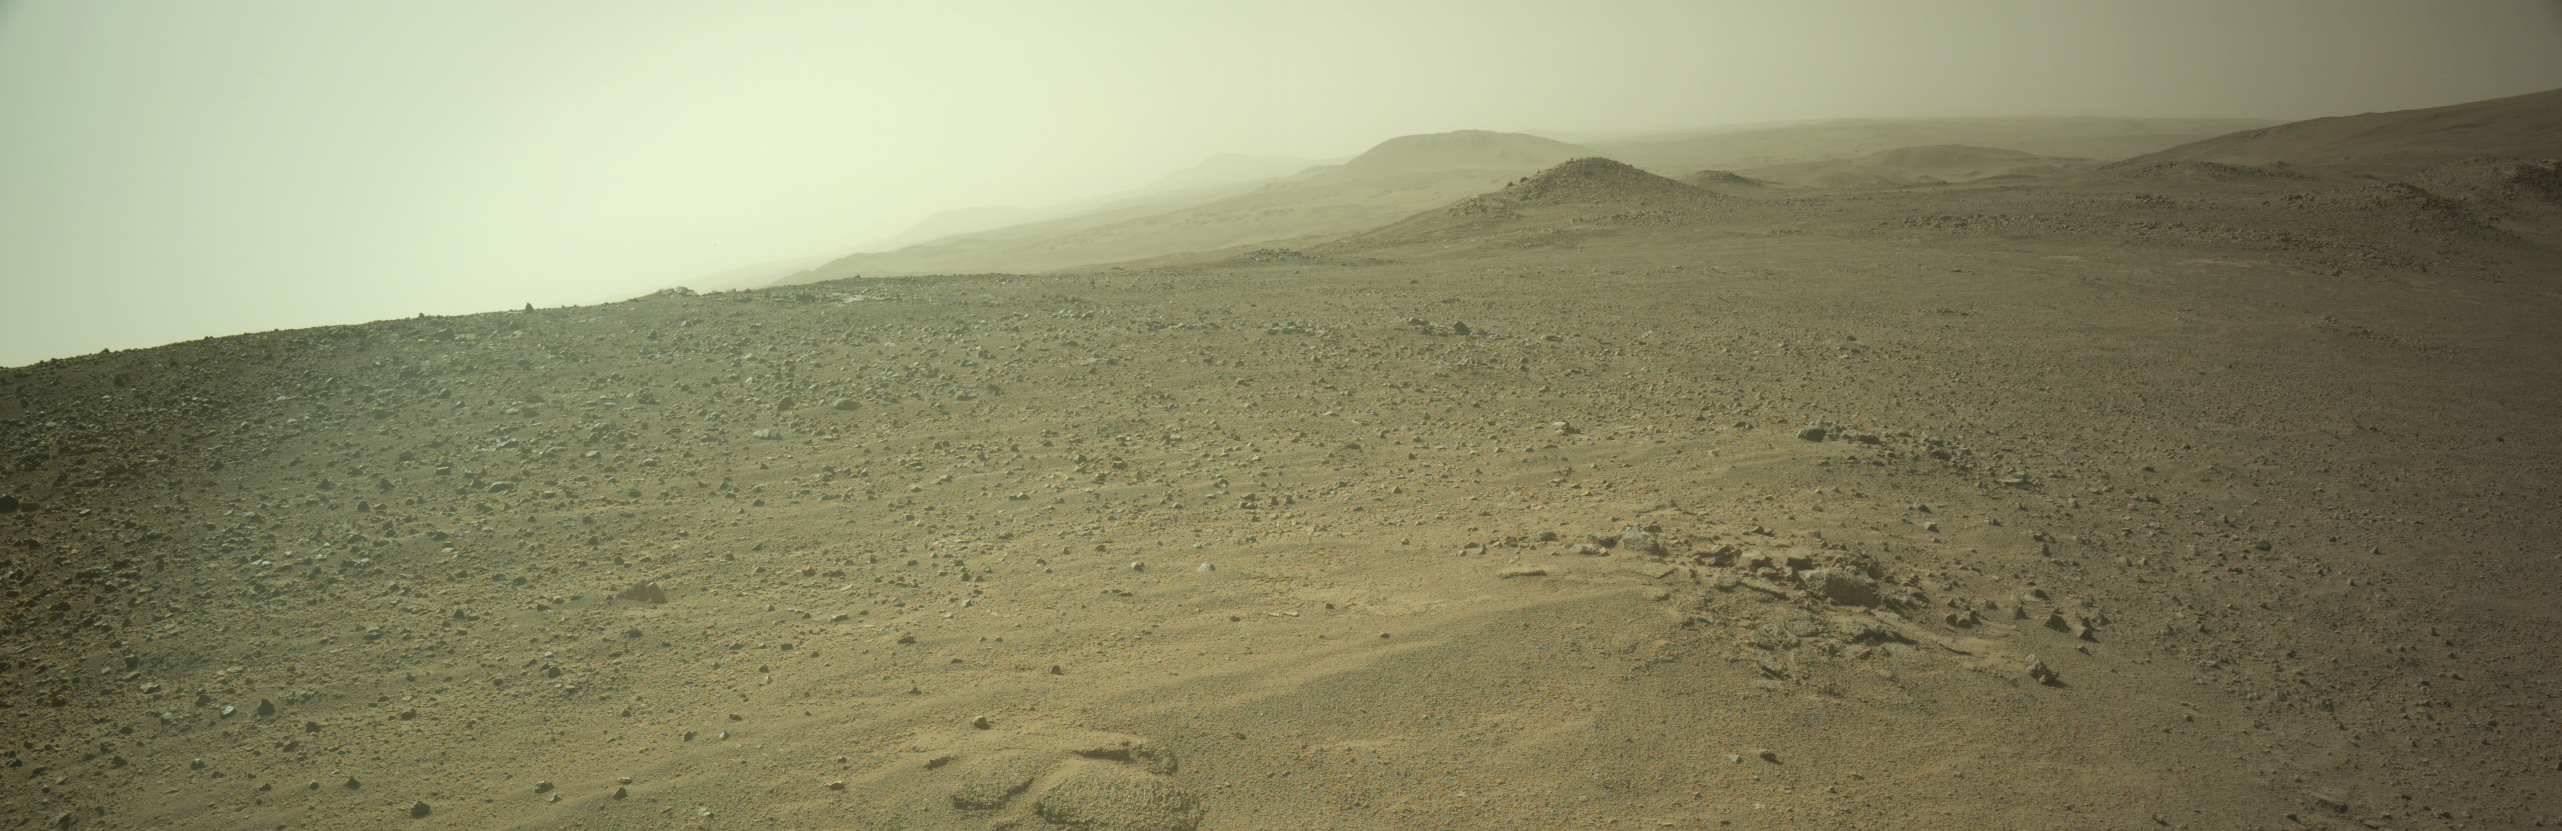
Today’s cool image to the right demonstrates that the atmosphere and climate of Mars is truly different in different places. The picture, rotated, cropped, reduced, and sharpened to post here, was taken on July 22, 2024 by the high resolution camera on Mars Reconnaissance Orbiter (MRO). Labeled simply as a “terrain sample”, it was likely taken not as part of any specific research project but to fill a gap in the camera’s schedule in order to maintain its proper temperature.
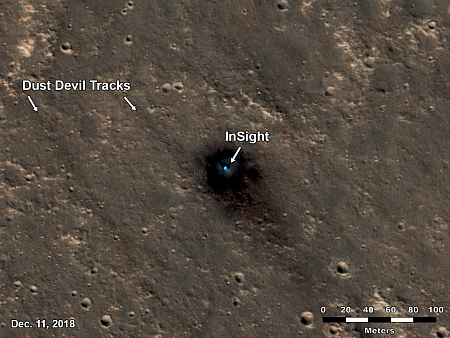
I post it today almost to illustrate the difference between this location and the spot where the lander Insight landed on Mars. Earlier this week the MRO camera team released a short movie created by images of the lander taken over six years, showing how the dust around it had changed over time. I noted further how those images showed a very small number of dust devil tracks, which explained why no dust devil every crossed over the lander’s solar panels to clean them of dust.
For the picture on the right, however, there are a lot of dust devil tracks, so many near the bottom that they almost completely darken the ground.
» Read more


