
Location of mud volcanoes in Martian chaos terrain suggest past existence of mud lake
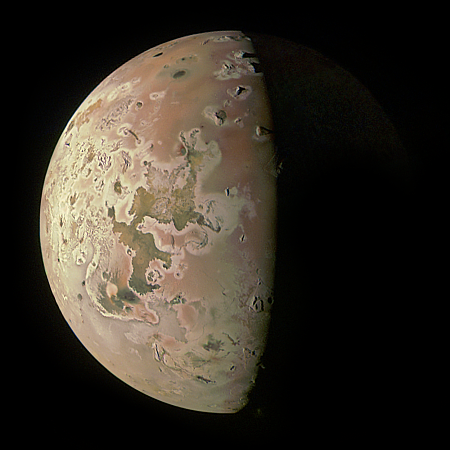
Scientists mapping the location of mud volcanoes in chaos terrain in the dry equatorial regions of Mars have found numerous mud volcanoes, adding weight to the theory that an intermittent shallow lake once existed there.
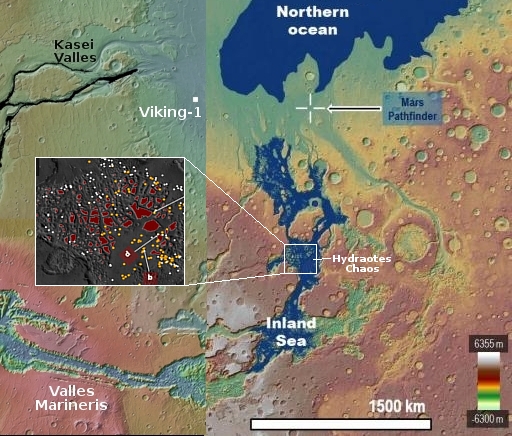
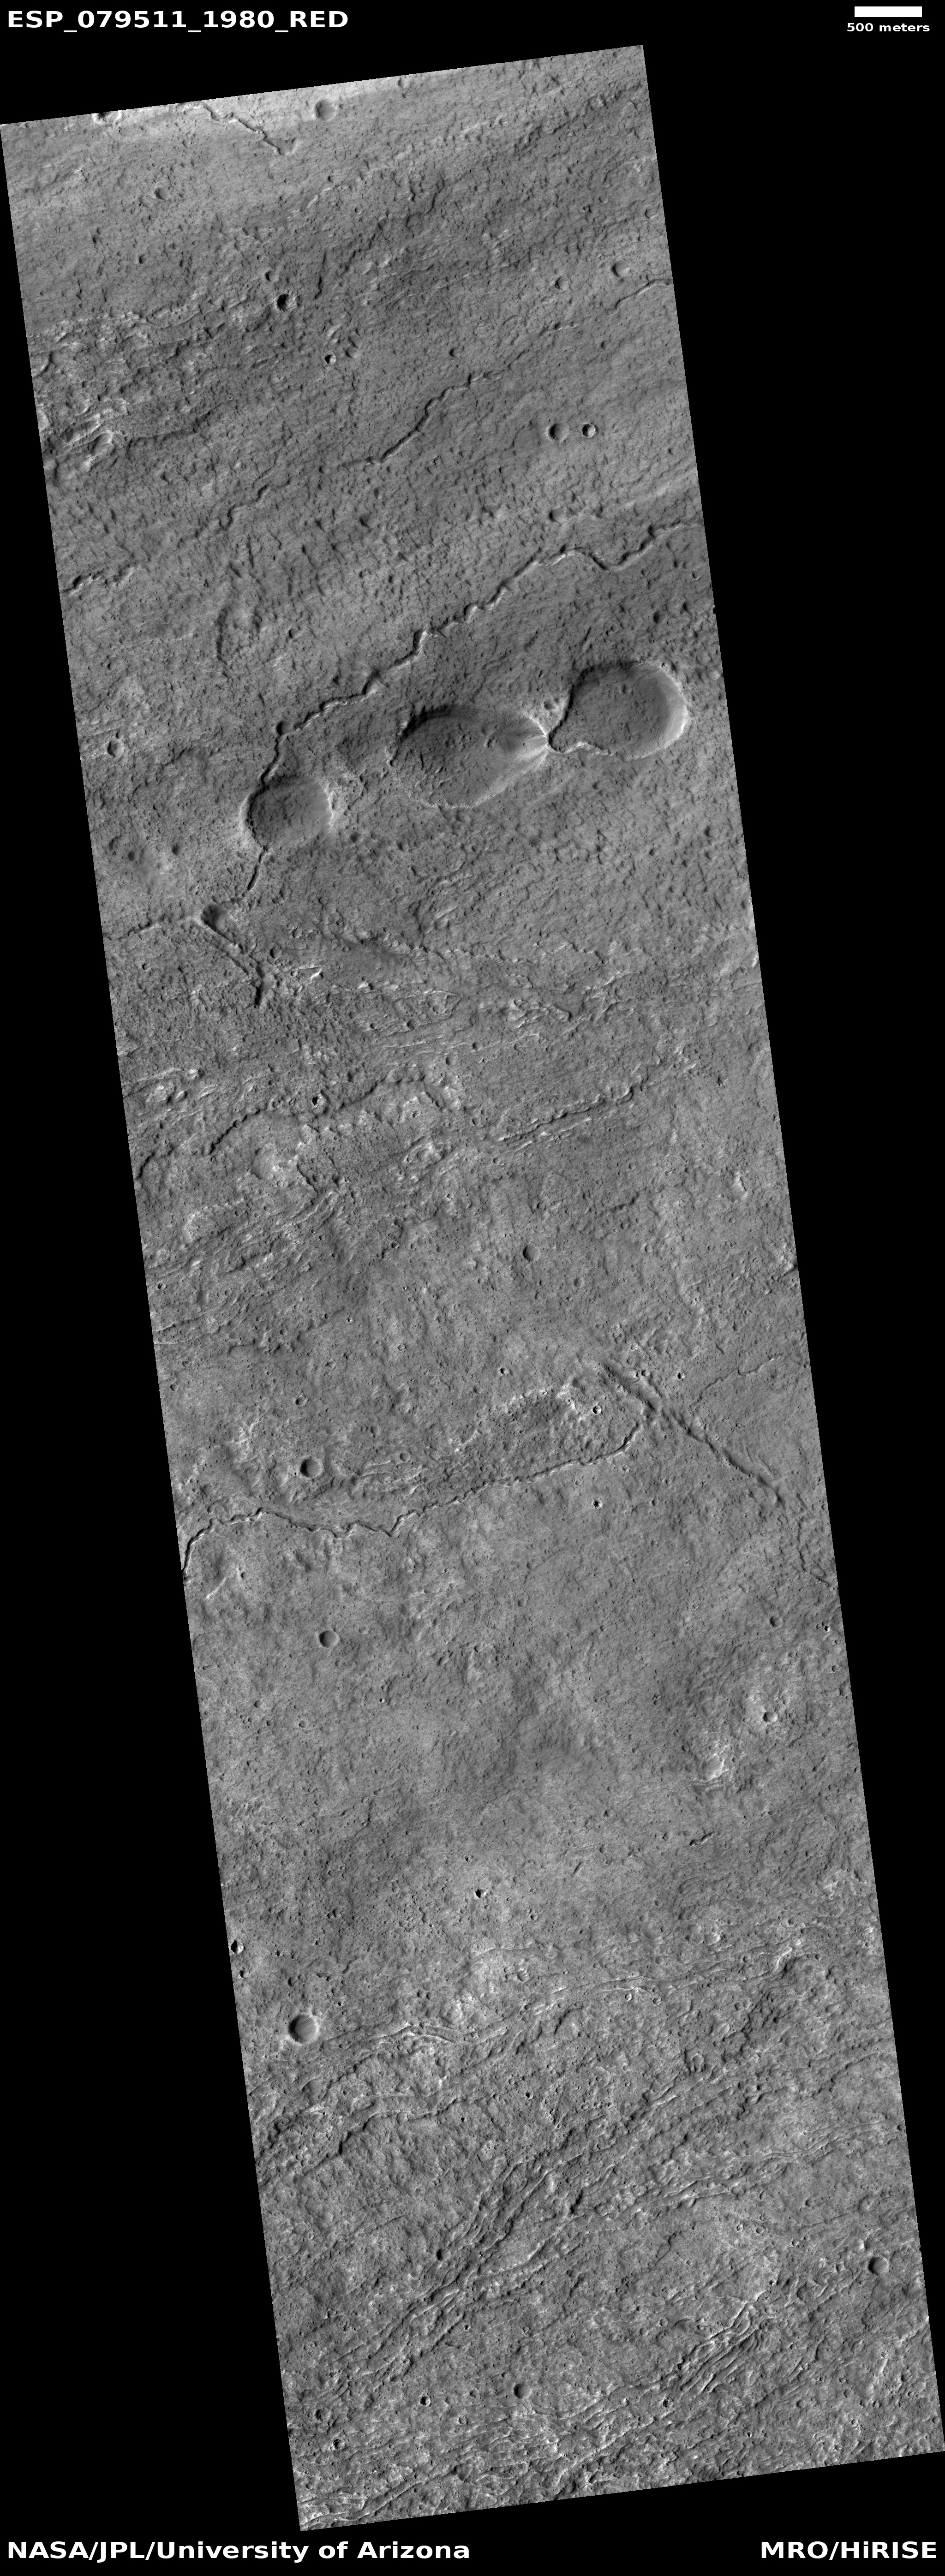
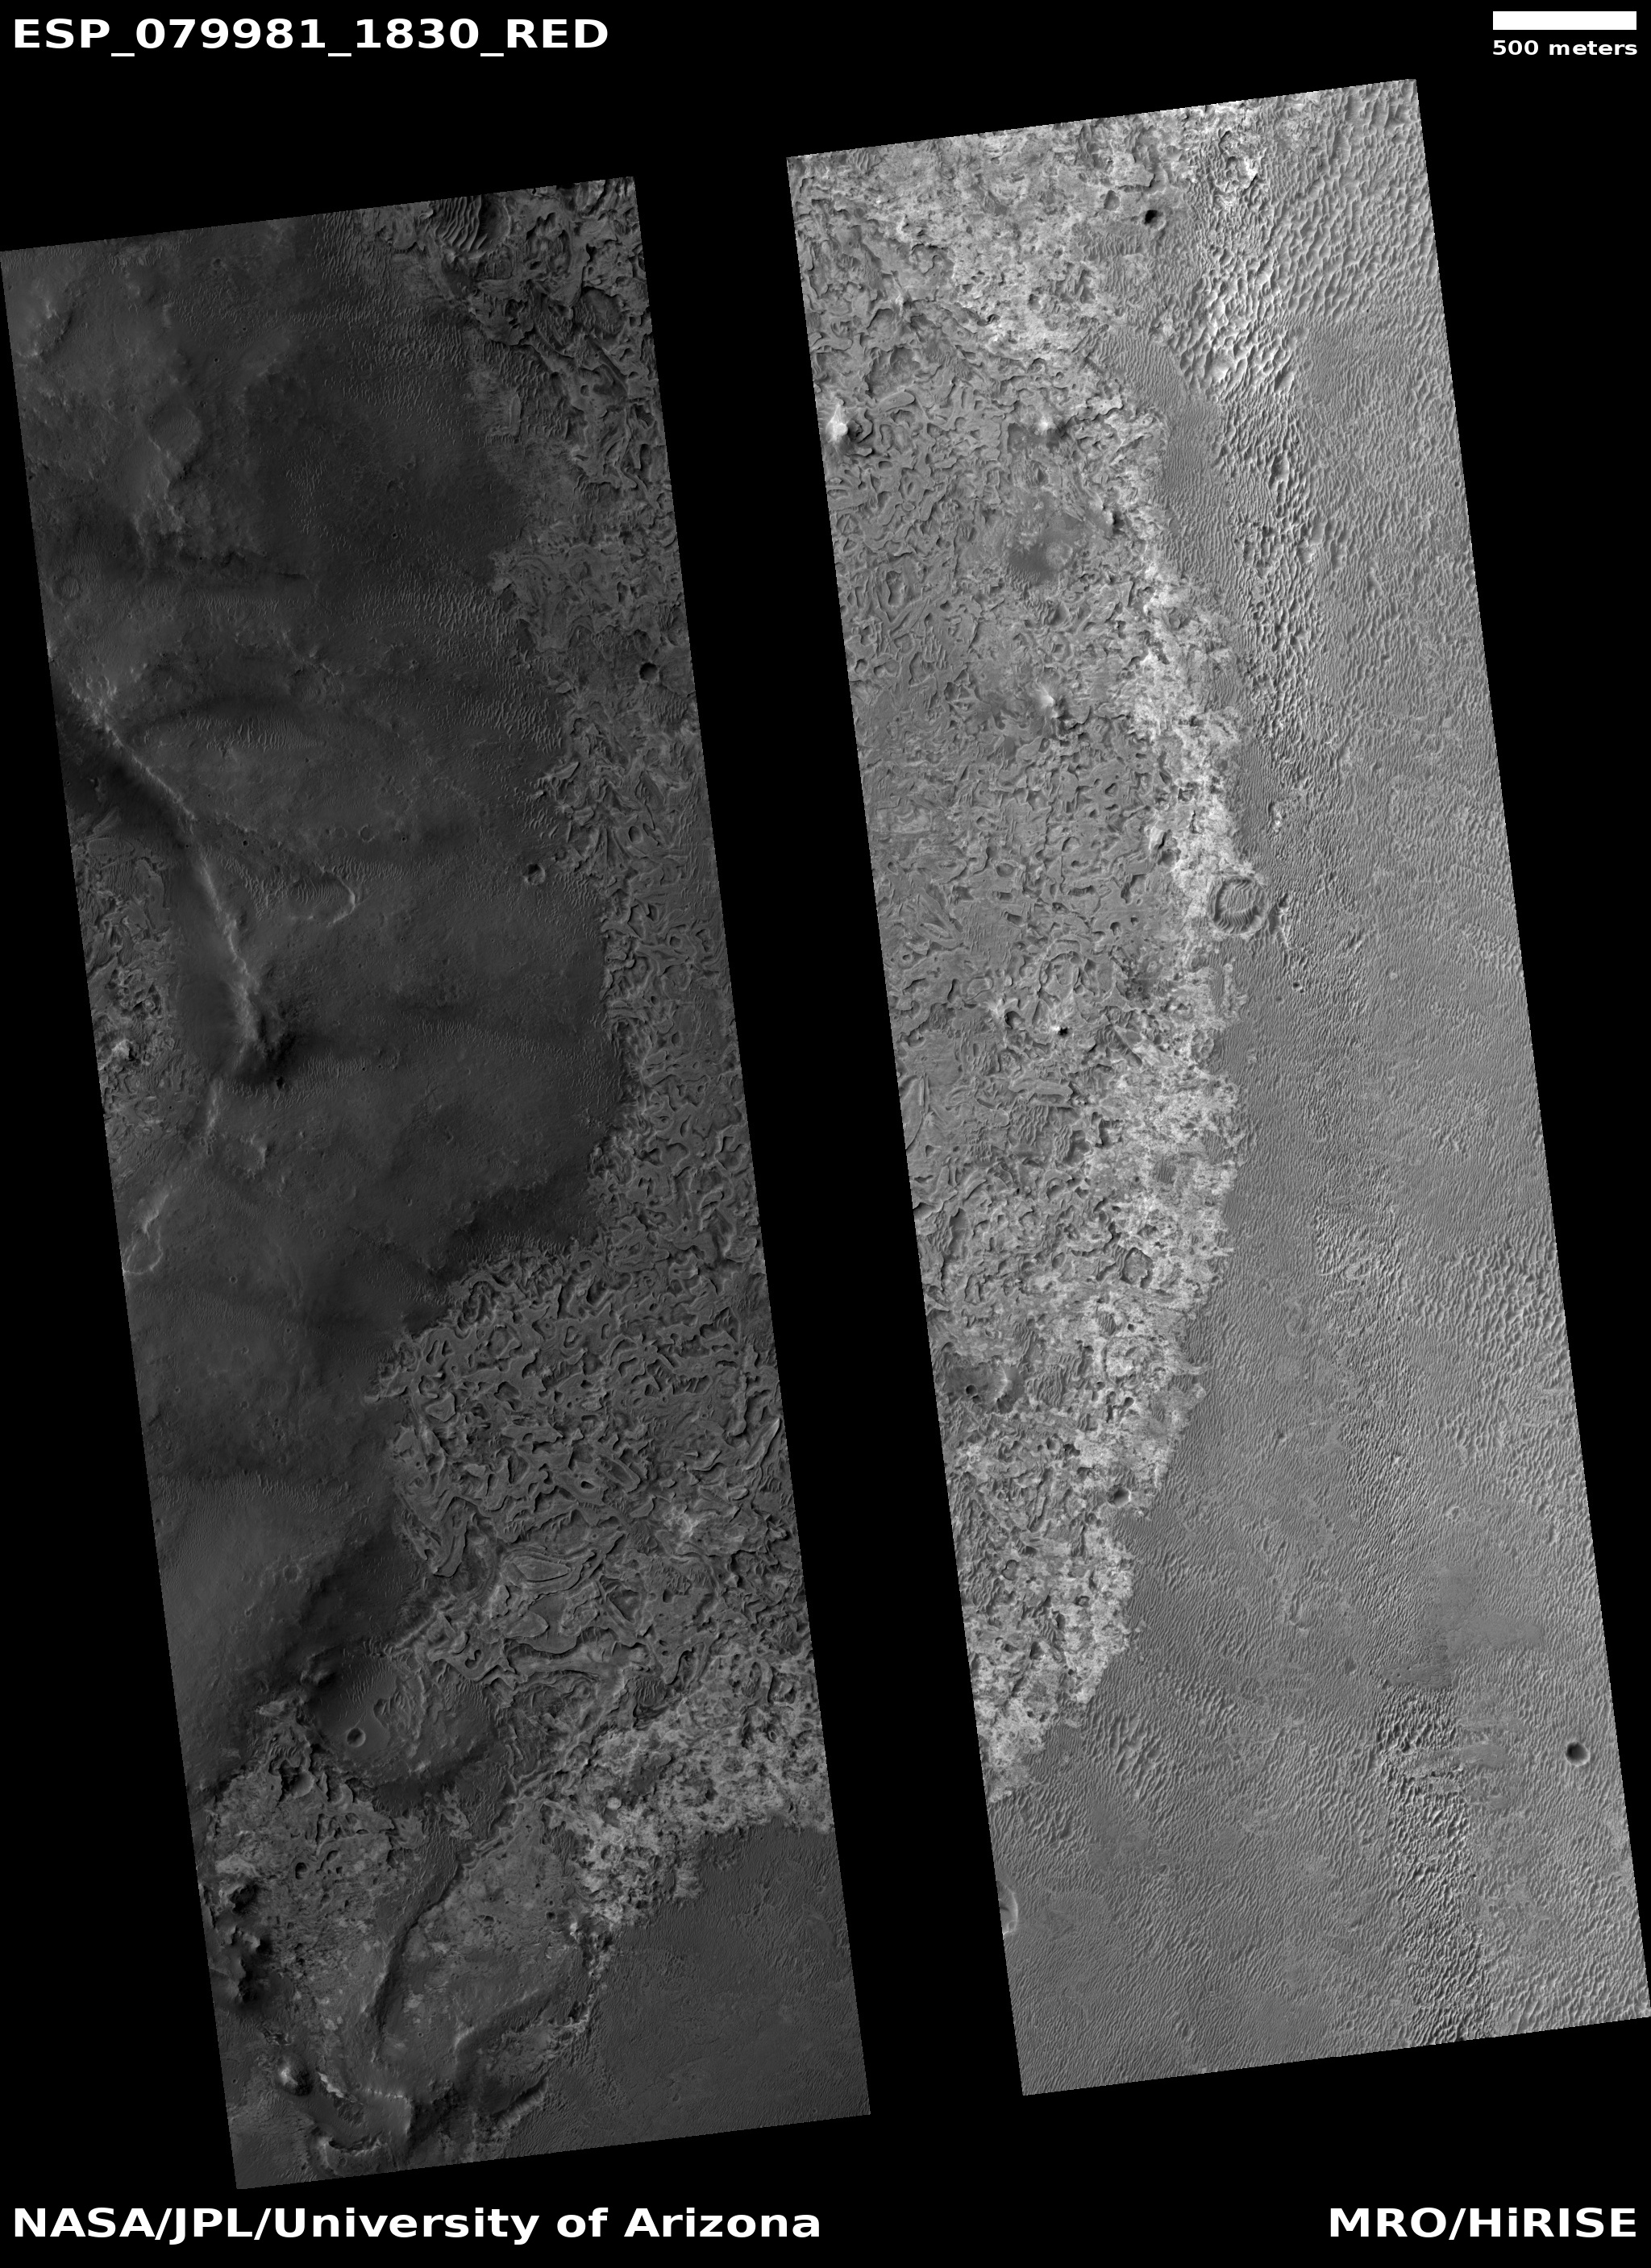
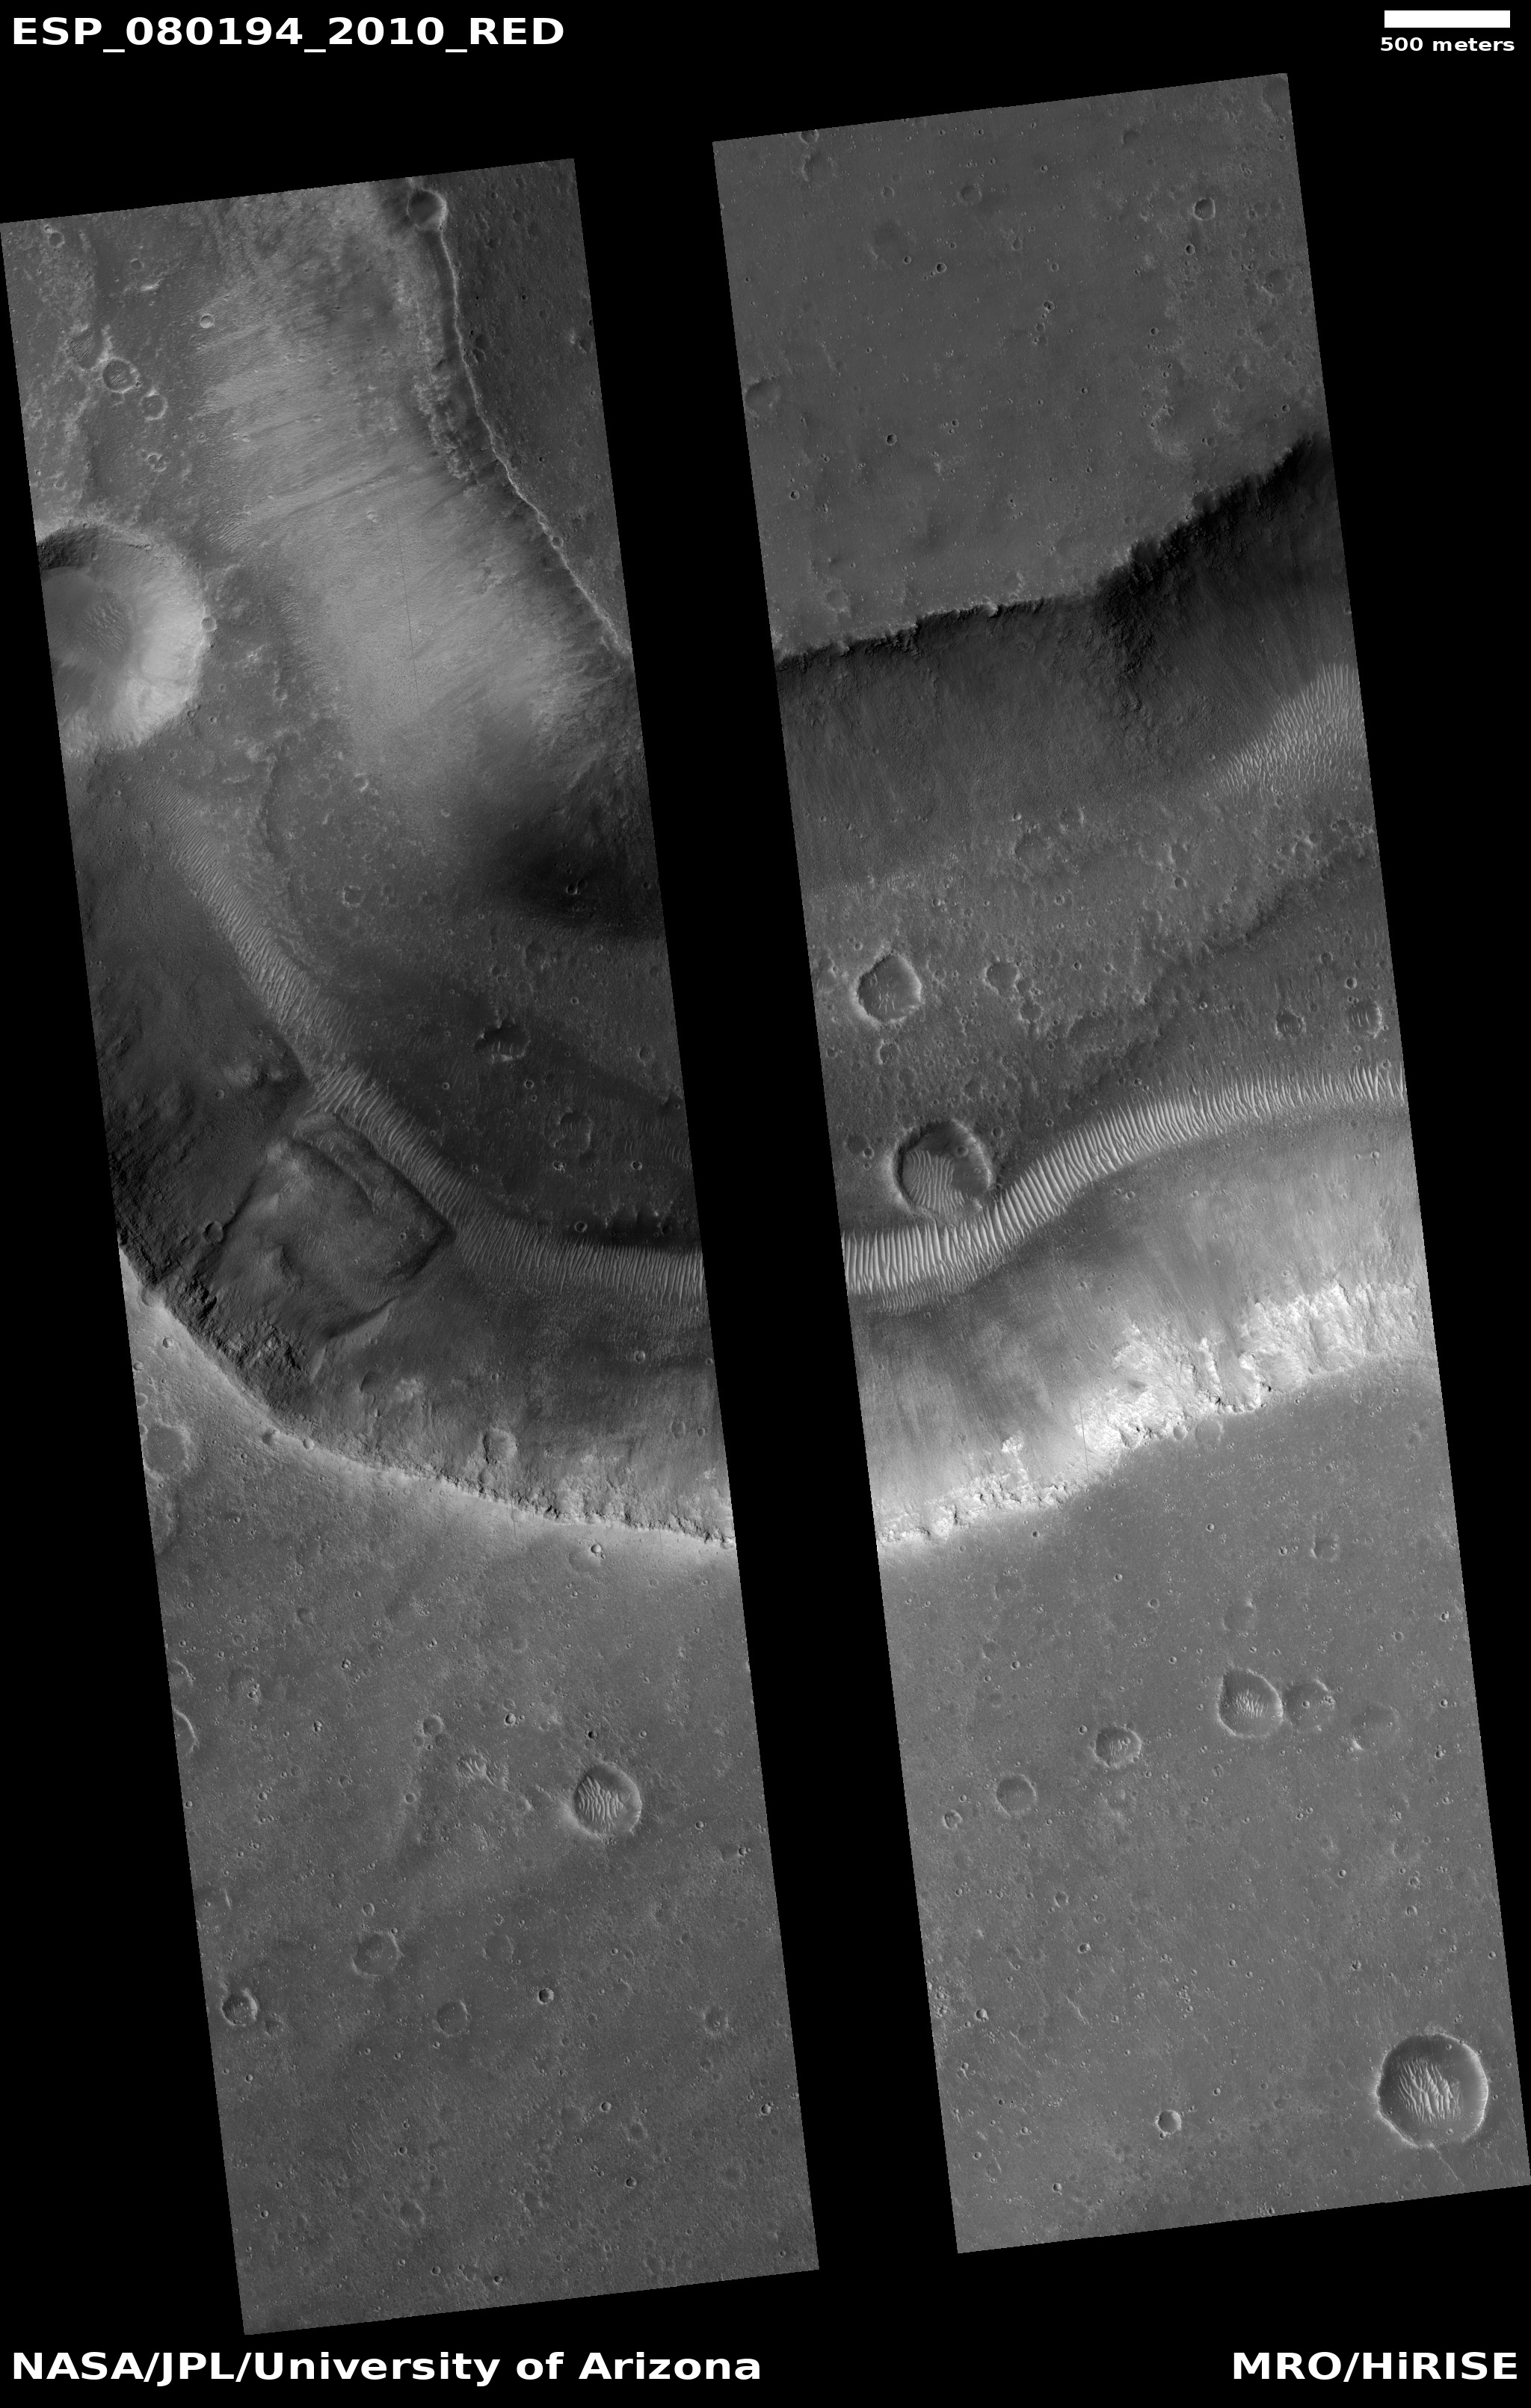
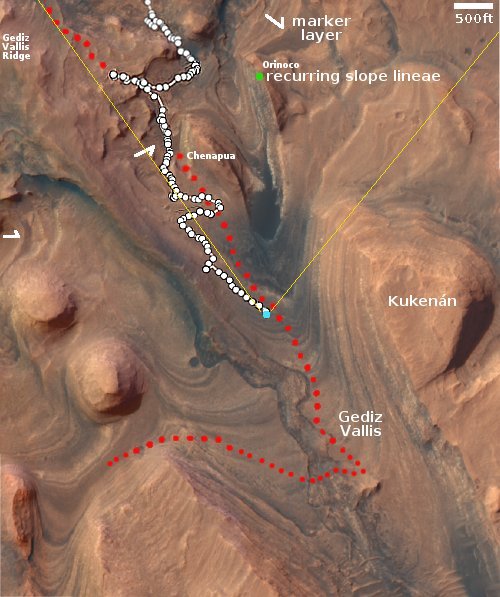
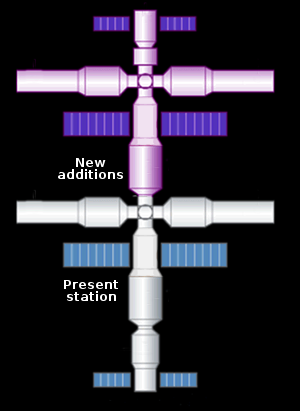
The inset on the overview map to the right indicates the location of those mud volcanoes (of two types) in white and orange dots. What is significant is that none of the volcanoes are found on the mesas within this chaos terrain, only in the low flats below. From the caption:
Both feature types result from sedimentary volcanism – instead of magma upwells and eruptions, wet sediments, and salts reach and breach the surface, forming mounds and flows. Interestingly, these mounds only occur over the chaotic terrain floor materials and not on the mesas (red-shaded areas) they embay. This suggests a material composition link rather than a genesis by regional extensional forces generated by magmatic rises.
The blue areas are where this same science team think an intermittent inland sea once existed. This new data reinforces that hypothesis.
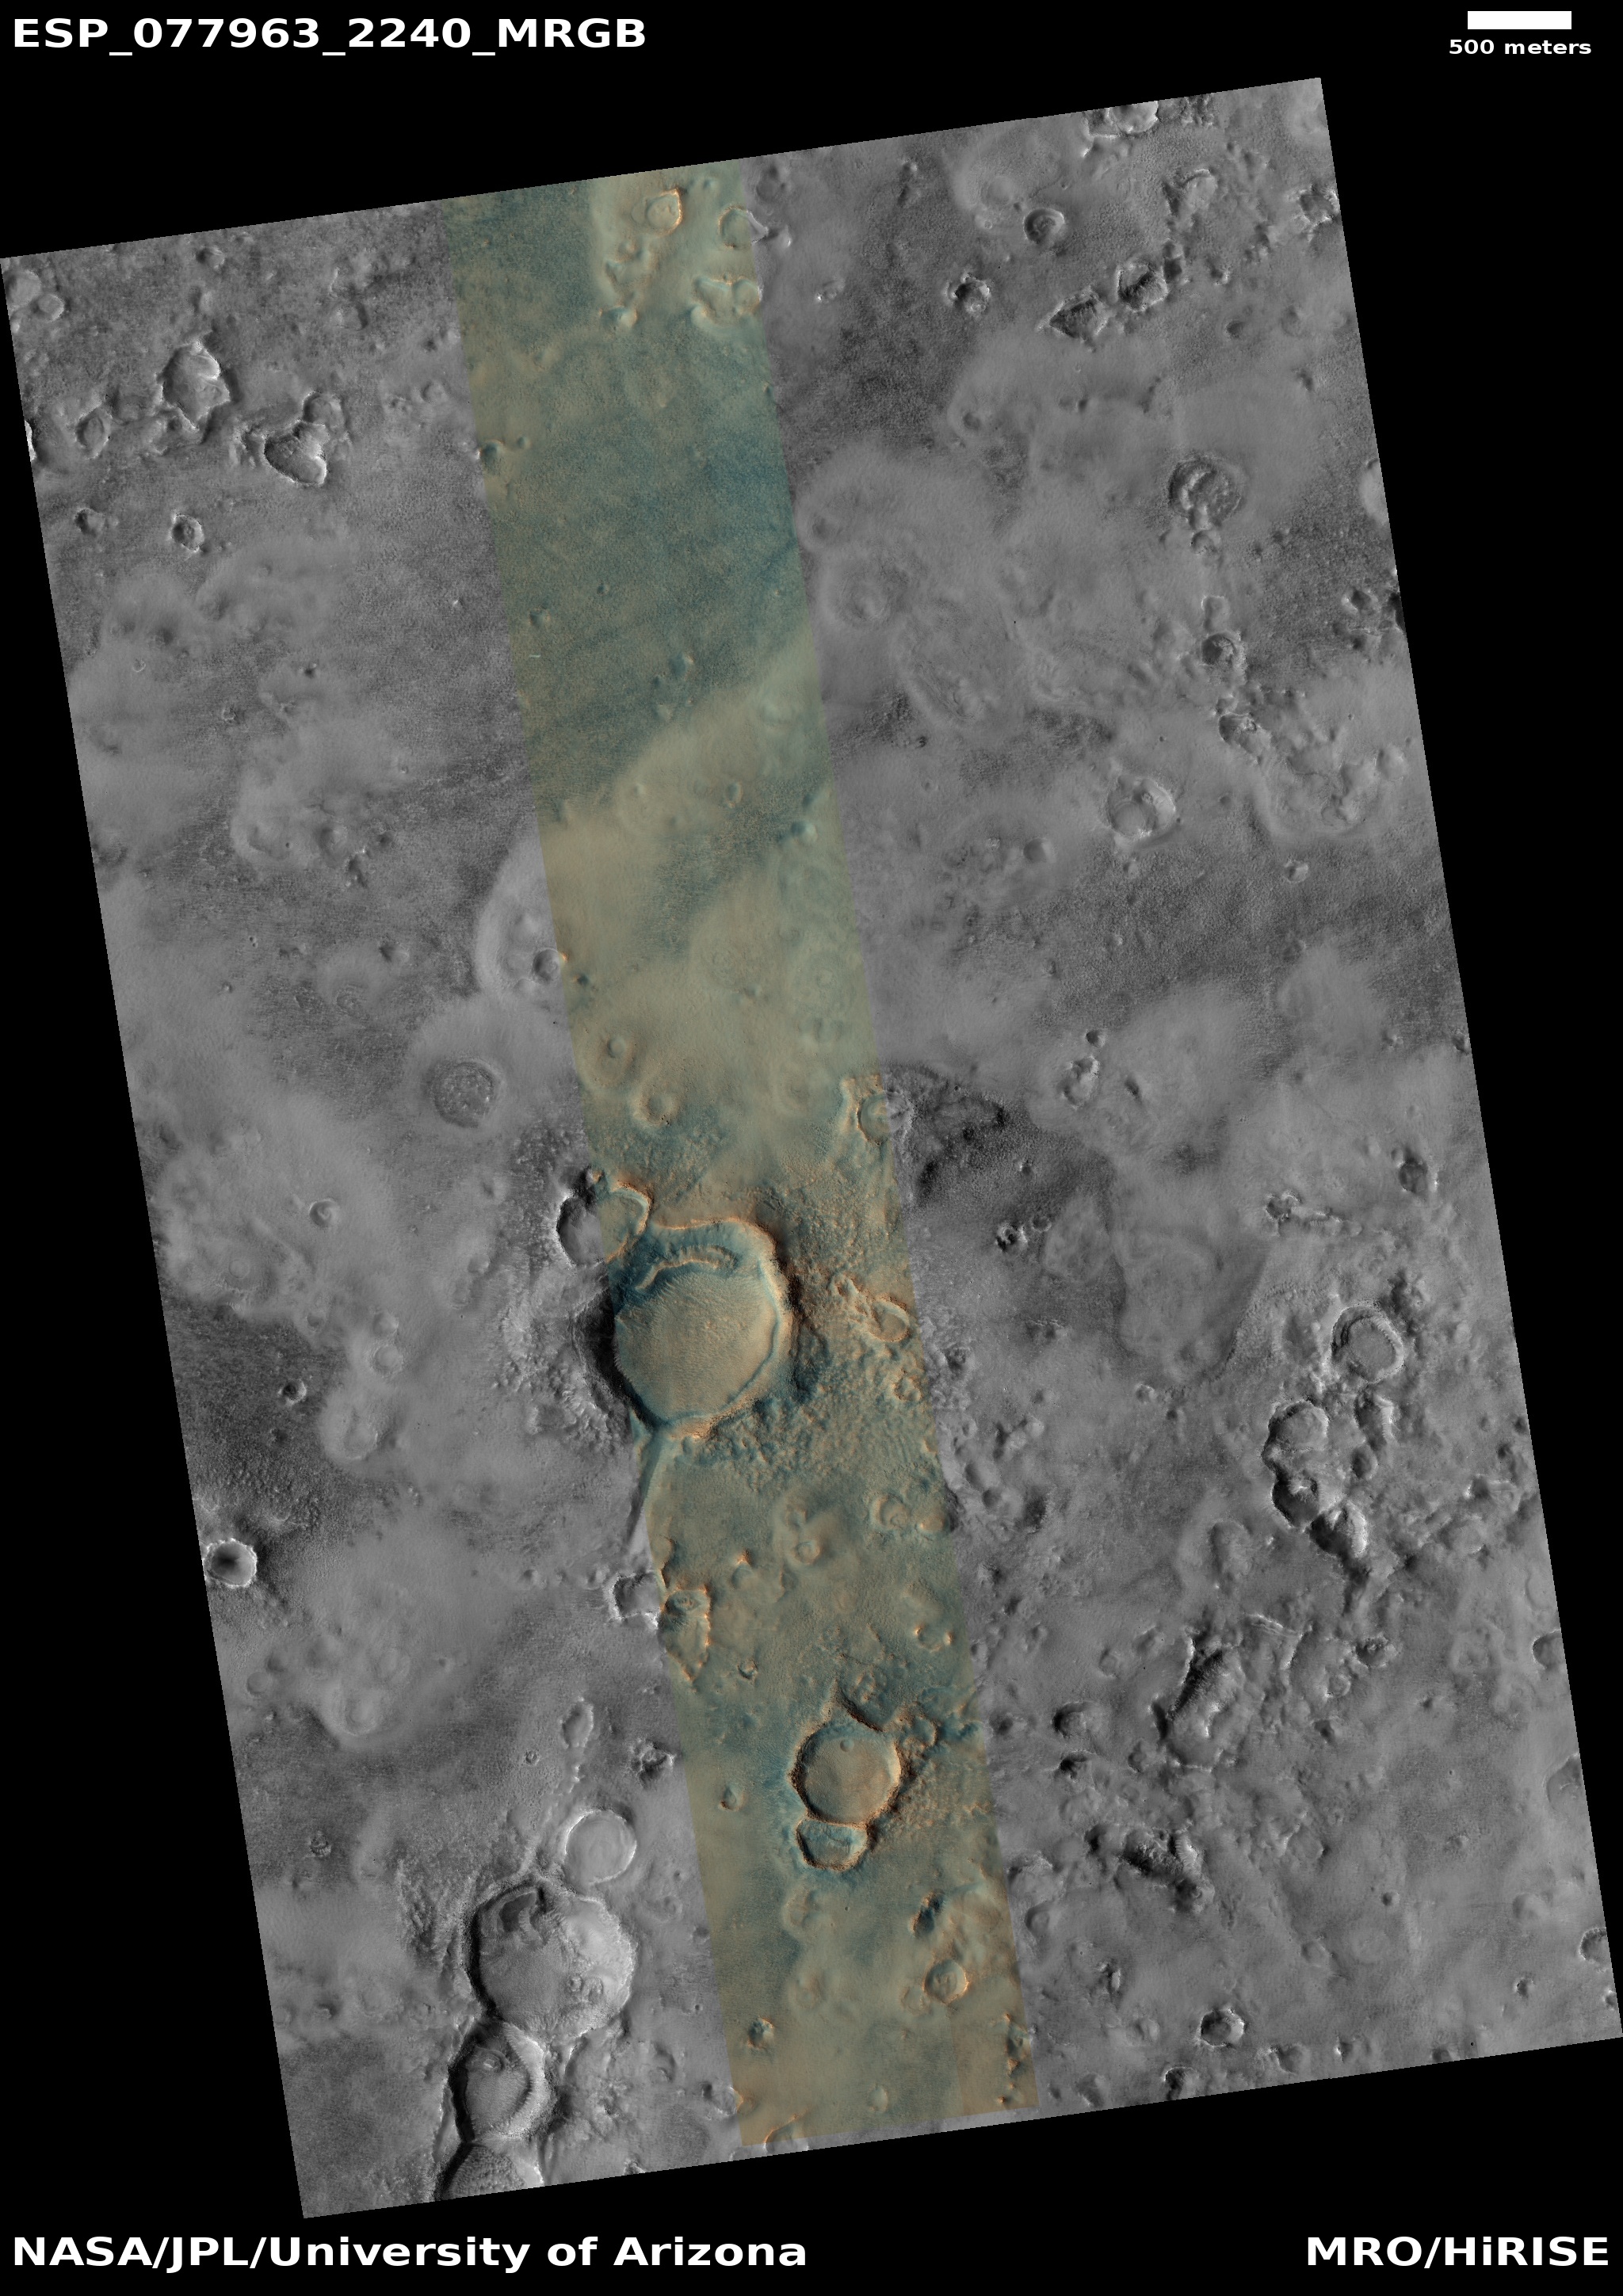
Features that look like mud volcanoes are common in the icy northern lowland plains. Finding them in the dry equatorial regions strengthens the theory that water was once common there. For this reason the scientists are proposing a mission to this location, especially because the possibility of water might increase the chances of discovering past life.


