
The new Rubin telescope discovers over 11,000 new asteroids in first observations
Click for full animation.
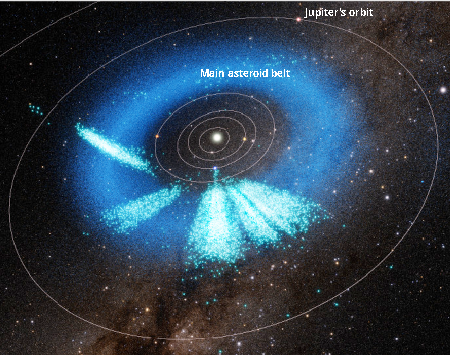
The new Rubin Observatory, a ground-based telescope in Chile, has discovered over 11,000 new asteroids in its first preliminary observations, with most in the main asteroid belt but a large number in the Kuiper Belt beyond Neptune and 33 previously unknown near-Earth asteroids.
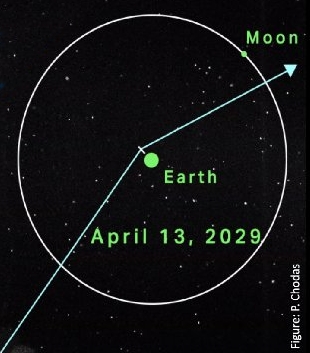
The graphic to the right, annotated by me to post here, shows all of Rubin’s asteroid detections in light blue.
The submission to MPC [Minor Planet Center] comprises approximately one million observations, taken over the span of a month and a half, of over 11,000 new asteroids and more than 80,000 already known asteroids, including some that had previously been observed but were later “lost” because their orbits were too uncertain to predict their future locations. You can interact with all of Rubin’s asteroid discoveries in the Rubin Orbitviewer, which uses real data to provide an intuitive way to explore the structure of our cosmic backyard in three dimensions and in real time. Also, visit the Rubin Asteroid Discoveries Dashboard to learn about the new objects Rubin has uncovered.
…Among the newly identified objects are 33 previously unknown near-Earth objects (NEOs), which are small asteroids and comets whose closest approach to the Sun is less than 1.3 times the distance between Earth and the Sun. None of the newly discovered NEOs pose a threat to Earth, and the largest is about 500 meters wide.
Astronomers predict that Rubin will eventually find 90,000 new near-Earth objects, with some expected to pose a risk of hitting the Earth. It does this by repeatedly surveying the southern sky with its large mirror, then identifying new objects with its sophisticated software.

