The October 2010 sunspot graph

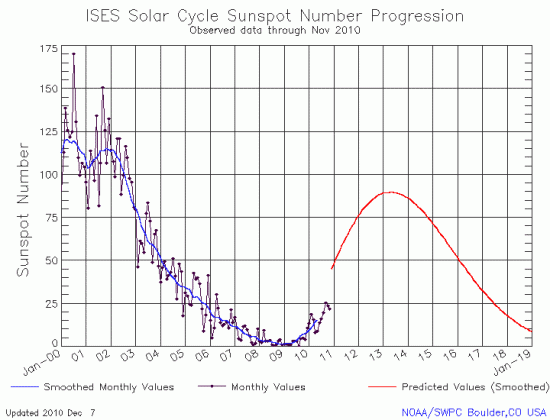
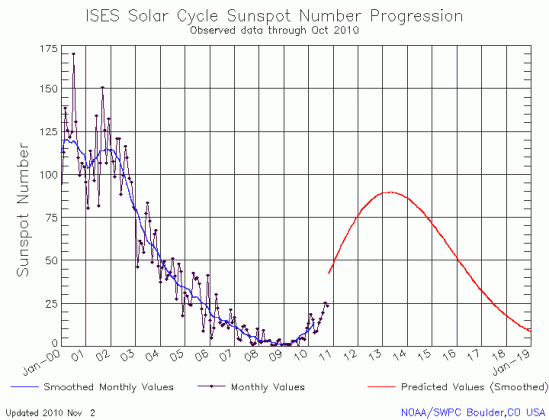
Yesterday NOAA’s Space Weather Prediction Center published its October monthly graph, showing the sun’s developing sunspot cycle in comparison with the consensis prediction made by the solar science community in May 2009.

October Sunspot graph

Sunspot activity in September clearly jumped, though it still remains far below predictions. Prepare for the weakest solar maximum since the 1810s!

Note also that today the Sun is blank, with no sunspots, the first time this has happened since August. At that time I speculated that this might “be the last time the Sun will be blank for years as it continues to ramp up to its next solar maximum.” Obviously not. The question now is whether today will be the finale in blankness for this minimum.

The state of the Sun, September 30, 2010

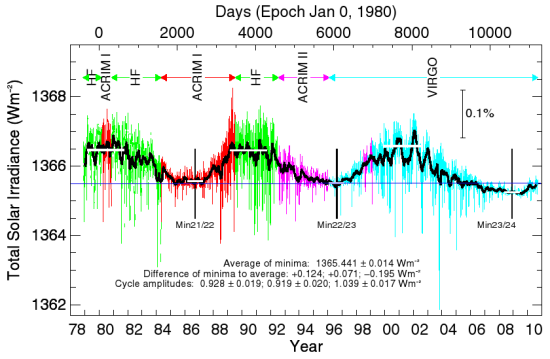
Time to update the state of the Sun, as seen by satellite data (the last update was in July). The graph below, posted today by Physikalisch- Meteorologisches Observatorium Davos (PMOD), shows the variation in the Sun’s Total Solar Irradiance since 1978. I have added a blue horizontal line to show that even now, two years after the Sun reached the lowest point in its most recent solar minimum, it has still not brightened enough to equal the lowest point in the two previous minimums. (Note that if we included the minimum from 1976, the Sun would still be below that as well.)

solar cycle as of Sept 30, 2010

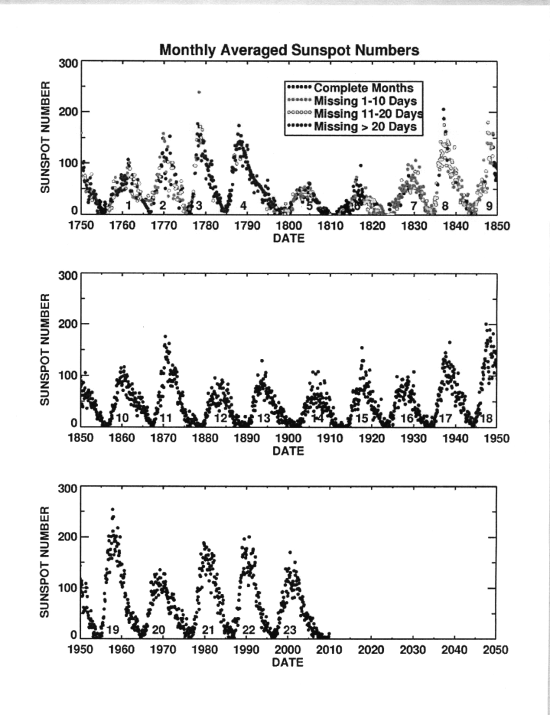
Once again, the evidence is building that the Sun might be heading towards the weakest maximum seen to two centuries. And when that happened, things got very cold on Earth.

the sunspot cycle

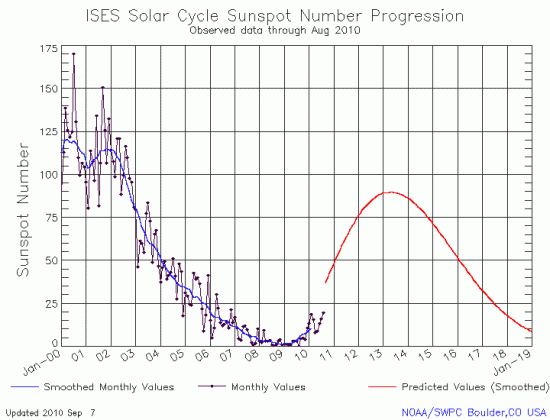
The September monthly sunspot graph

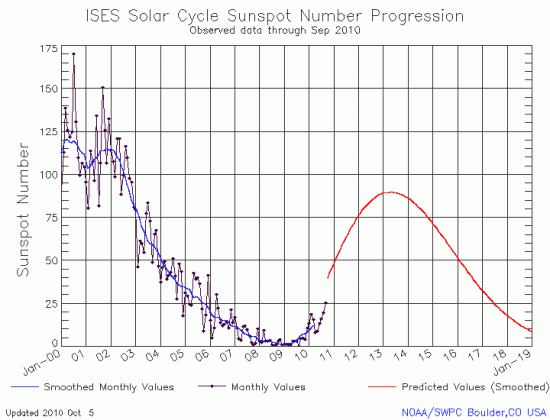
The Sun continues to show a reluctance to come out of its solar minimum. Today NOAA’s Space Weather Prediction Center published its monthly graph, showing the sun’s developing sunspot cycle in comparison with the consensis prediction made by the solar science community in May 2009. As you can see below, actual sunspot activity remains far below what was predicted by the red line.

September 7, 2010 Solar Cycle progression

As I noted when I posted the July and August graphs, the Sun’s ramp up to solar maximum continues to be far slower and weaker than predicted. After two hundred years of watching a vibrant and strong solar cycle, it appears increasingly likely that we are heading towards some quiet time on the Sun.

The August monthly sunspot graph

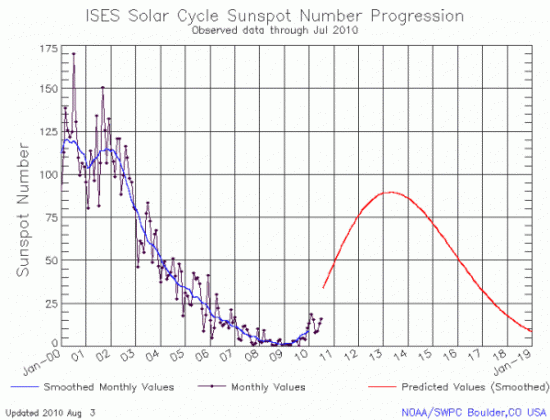
Waking up is hard to do. Today NOAA’s Space Weather Prediction Center once again published its monthly graph, showing the progress of the sun’s sunspot cycle in comparison with the consensis prediction made by the solar science community in May 2009.

August 3, 2010 Solar Cycle progression

As I noted when I posted the July graph, the data continues to show that the Sun’s ramp up to solar maximum is far slower and weaker than predicted, despite the stories this week about how Sunday’s coronal mass ejection demonstrates that the sun is “waking up.”

The sun remains quiet

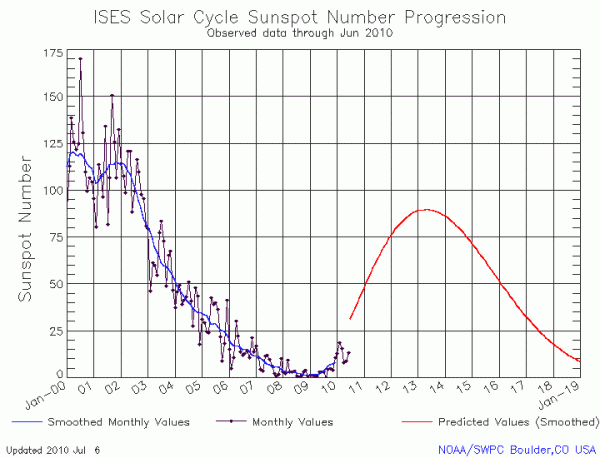
On July 6 NOAA’s Space Weather Prediction Center published its monthly graph, showing the progress of the sun’s sunspot cycle in comparison with the consensis prediction made by the solar science community in May 2009.

July 6, 2010 Solar Cycle progression

The graph shows clearly that, despite press-release-journalism stories like this, the sun remains in a very quiet state, with the number of sunspots far less than predicted by the red line on the graph. If these trends persist (as they have for the last three years), the next solar maximum will either be much later than expected or far weaker. In fact, the upcoming solar maximum might very well be the weakest seen in almost two centuries. Note also that the prediction shown on this graph is a significant revision downward from the science community’s earlier prediction from 2007.

1 8 9 10