New data suggests Sun undergoing fundamental changes
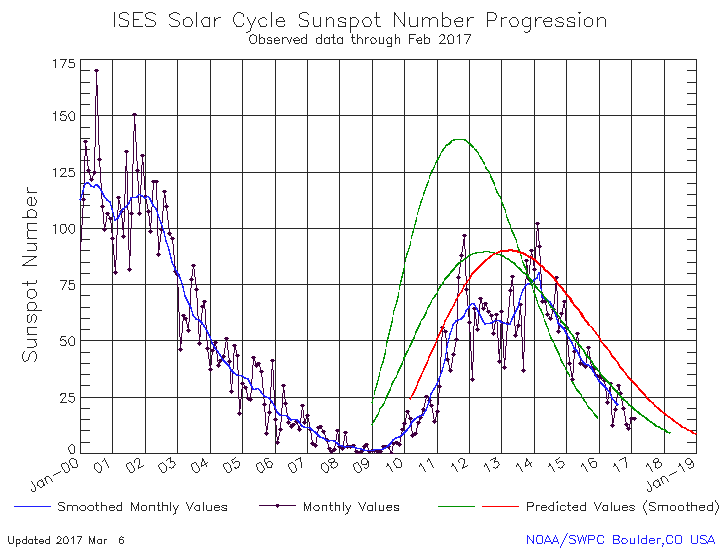
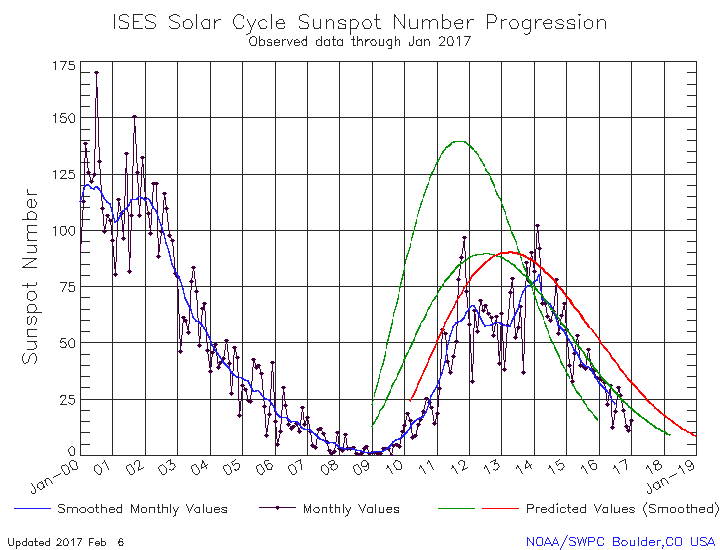
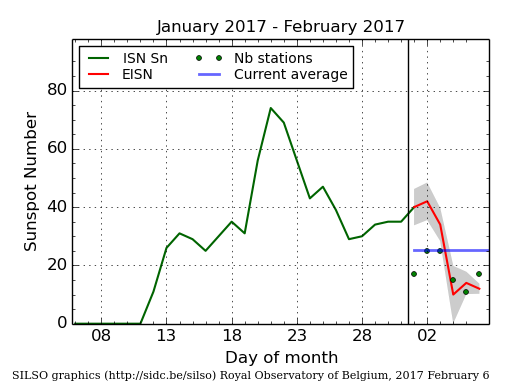
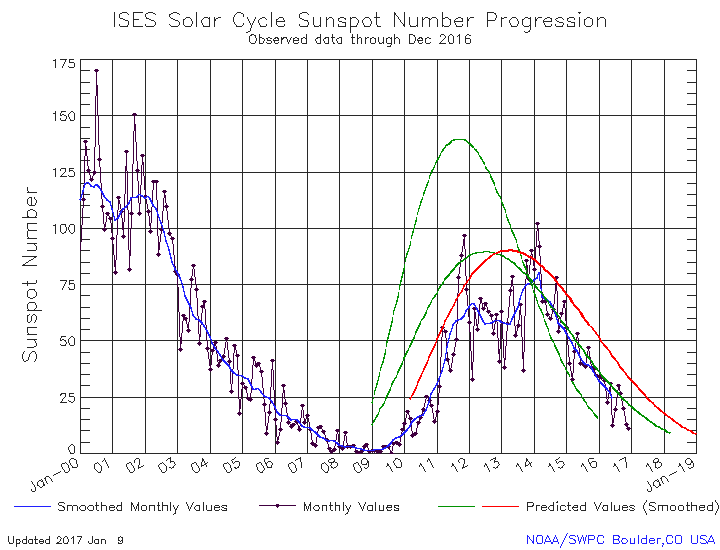
The uncertainty of science: New data, when compared with similar data collected over decades, suggests the Sun’s solar cycle is undergoing some fundamental changes.
In work just published in the Monthly Notices of the Royal Astronomical Society, the team shows that the interior of the Sun has changed in recent years, and that these changes persist in the current cycle. In combination with theoretical models, the observations suggest that the magnetic field distribution in the outer layers may have become a bit thinner. Other seismic data shows that the rotation rate of the Sun has also undergone some changes in the way the Sun rotates at different latitudes.
“Again, this is not how it used to be and the rotation rate has slowed a bit at latitudes around about 60 degrees. We are not quite sure what the consequences of this will be but it’s clear that we are in unusual times. However, we are beginning to detect some features belonging to the next cycle and we can suggest that the next minimum will be in about two years,” says Elsworth.
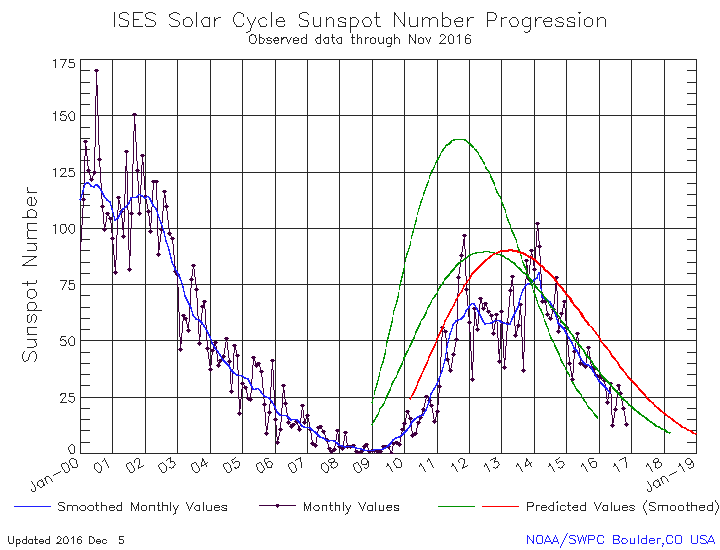
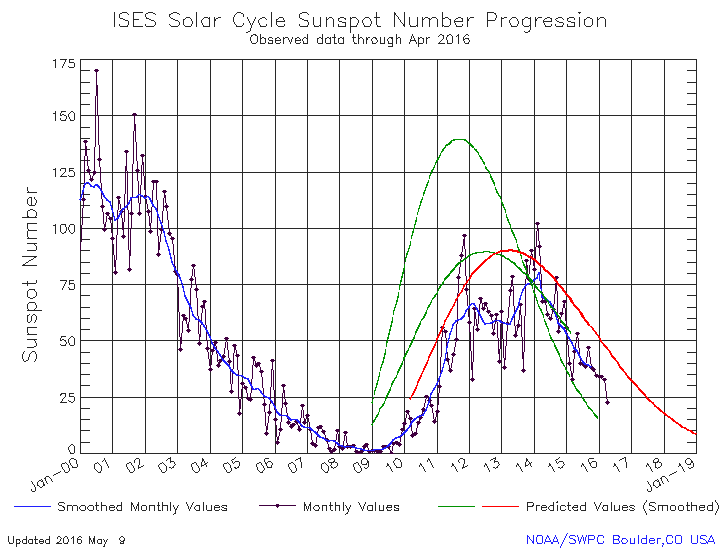
First, they don’t know what will happen because of these changes. Second, their data confirms that the solar minimum will occur in about two years, which would make this cycle only 9 years long, one of the shortest but also one of the weakest that has been observed, two things that previously had never gone together.

