
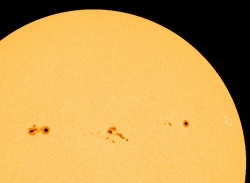
The largest sunspot in years appears on the sun
The largest sunspot in years has appeared on the sun.
The largest sunspot in years has appeared on the sun.
The largest sunspot in years has appeared on the sun.
Though it has been very clear for the past few months that the sun has finally transitioned from solar minimum and begun its ramp up to solar maximum, that ramp up has also been very slow and wimpy.
On October 9, 2011 the scientists at Physikalisch- Meteorologisches Observatorium Davos (PMOD) posted an updated summary of the satellite data that has been carefully measuring the variation of the sun’s total solar irradiance since 1978. The graph below, which can be found here [pdf], brings that data up through the present. (I had posted the previous update about a year ago.)
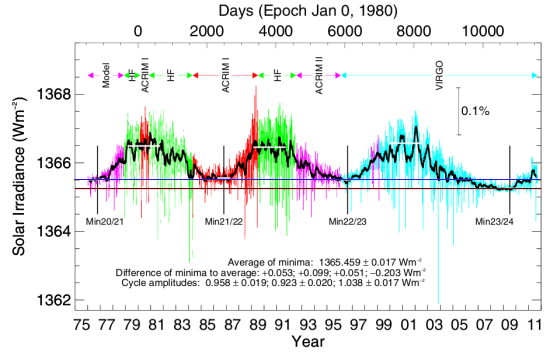
I have added a brown line to illustrate how deep the recently ended solar minimum was, compared to previous minimums. Note also that this most recent minimum would also be far below the minimum prior to 1975. I have also added a blue line to show that the sun has only very recently finally brightened enough to finally exceed the previous minimum. All told, the sun remained dimmer than the previous minimum for over five years!
» Read more
Today NOAA’s Space Weather Prediction Center released its monthly graph of the Sun’s solar cycle sunspot activity. Posted below, it shows the Sun’s activity finally leaping upward in September, after several months of less than expected performance.
It is interesting to see how the sun’s rising sunspot activity for the past year has followed a consistent fluctuating pattern, whereby a sudden monthly jump in sunspots is then followed by several months of decline. If this pattern repeats itself again, we should expect to see the numbers ease off again in October and November.
Regardless, the higher sunspot counts for September are more in line with past predictions. In fact, the solar scientists at the Marshall Space Flight Center have increased their prediction for the time and intensity for the peak of the sun’s maximum. Last month they had called for a peak in May 2013 with a sunspot number of 70. Now, they are predicting the peak will come in April 2013 with a number of 77. They note however that even this higher number will result in the weakest maximum in more than a hundred years.

Giant sunspot 1302 turns its aim towards Earth.
The monthly graph from NOAA’s Space Weather Prediction Center of the Sun’s solar cycle sunspot activity is out and I have posted it below. Though activity increased for the second month in a row, the totals are still below the activity levels of March and April 2011.
I am beginning to think that I sound like a broken record. This monthly graph once again suggests that the next solar maximum will be weak, possibly weaker than the most up-to-date predictions for the next solar maximum. And even if that prediction is correct, the data continues to point towards a quieter Sun, with the likelihood of a long period of no sunspots beginning in the next decade.
Based on past history, the consequences of a long Maunder-type minimum, where there are no sunspots for decades, should be very profound. Every time the Sun has gone this quiet in the past, the Earth’s climate has cooled. Furthermore, new results just released add weight to this conclusion. A less active Sun allows more intergalactic cosmic rays to hit the atmosphere, and the CLOUD experiment at CERN strongly suggests that the higher rate of cosmic rays could in turn increase the atmosphere’s cloudiness, thereby reflecting more light and energy and making the Earth colder.
Though it is not yet official, it appears the sun is blank of sunspots today, for the first time since January 16.
Solar scientists have concluded that the solar minimum of the past four years has ended and that the sun is now moving towards solar maximum. The recent activity in August has seemed to confirm this. However, once the minimum has ended, the sun should not have any further blank days until the maximum is over and the sun is ramping back down to solar minimum. That the sun should appear blank again during its ramp up to solar maximum is quite unusual, probably unprecedented, and is further evidence that the sun is heading towards a period of little or no solar activity.
As it does every month, NOAA’s Space Weather Prediction Center released today its monthly updated graph of the Sun’s solar cycle sunspot activity. I have posted the July graph below.
For the first time in four months there was a increase in sunspot activity, albeit small. The sun has been even more active in August, as shown by the flurry of sunspots on its face from August 1 (shown on the left) and the August 8 solar flare, the most powerful produced in four years.
This monthly graph, however, continues to suggest that the next solar maximum will be very very weak, even weaker than the most up-to-date predictions for the next solar maximum.

The sun unleashed its largest solar flare in years on Tuesday.
Stand by for space weather: three coronal mass ejections were released by the sun in the past few days and are aimed directly at the earth. The first hit tonight, without doing much damage.
Though it is important to prepare for these solar storms, don’t expect them to do much harm. Power companies use the warnings to protect their grids. What you can expect is an increased chance of seeing the aurora at lower latitudes.
The chief of CERN has prohibited its scientists from drawing any conclusions from a major experiment that appears to prove that solar activity and the resulting ebb and flow of cosmic rays has a direct effect on the climate.
Two points:
First, the results described provide strong evidence that the sun is a much more important component in climate change than any climate model has previously predicted. These results could help explain the Little Ice Age, which took place around 1700 at exactly the same time the sun became very quiet and stopped producing sunspots for decades. They could explain the Medieval Warm Period around 1000 AD, when cosmic ray activity declined (which also suggests the sun become more active) and the earth apparently warmed. And they might very well even explain the recent cooling during the past decade, which also took place during a period of solar inactivity and a comparable increase in cosmic ray activity.
» Read more
The monthly updated graph of the Sun’s solar cycle sunspot activity was released today by NOAA’s Space Weather Prediction Center. I have posted the June graph below.
For the third month in a row, there was a decline in sunspot activity. Though the sun is producing sunspots quite regularly and there hasn’t been a blank day since January 16, the numbers of sunspots continue to fall far below the predicted level of activity as indicated by the red line.
All this is no longer a surprise or unexpected. As the solar science community noted last month, they have now gathered enough data to convince them that the sun appears to be going quiet, and might even follow this very weak solar maximum — the weakest possibly in 200 years — with a decades-long period of no sunspots at all.
This graph, however, is very intriguing. Even with an expected weak solar minimum, the sun should be producing more sunspots each month, not less, as shown on the graph. This suggests that the most up-to-date predictions for the next solar maximum might still be too high.

It’s that time of year again, buckos. Every June, like clockwork, stories and op-eds like these start to flood the media:
Not surprisingly, these stories always happen about the same time our federal bureaucracy puts together a one day June propaganda event called the Space Weather Enterprise Forum, designed to sell to journalists the idea that we are all gonna die if we don’t spend gazillions of dollars building satellites for tracking the sun’s behavior. Along with this conference come numerous press releases, written by the conference’s backers. Here for example is a quote from a press release emailed to me and many journalists:
Recent activity on the Sun, captured in stunning imagery from the Solar Dynamics Observatory, and the resulting threat of significant radiation storms and radio blackouts here on Earth are vivid reminders of our need to better understand the science, improve our forecasts and warnings, and better prepare ourselves for severe space weather storms as the next solar maximum approaches.
The problem for these fear-mongers, however, is that shortly before their forum the scientists who actually study the sun held another press conference, where they laid out in exquisite detail the sun’s astonishing recent decline in activity, and how the next solar maximum will likely be the weakest in centuries and might very well be the last maximum we will see for decades to come.
In other words, the annual effort by government bureaucrats to drum up funding for more space weather facilities has collided head on with the facts.
That there are science journalists from so many major news organization so easily conned into buying this fear-mongering is pitiful enough. More significant, however, is the fact that this annual effort at crying wolf has not been very successful. For years Congress has not funded any new space weather satellites, and doesn’t appear ready to do so in the future, especially with the present budget crisis.
» Read more
The revelation last week that the sun is very likely about to go into a period of little or no sunspot activity has made a lot of global warming advocates, both scientists and journalists, very nervous. For years these climate activists have declared that the Earth’s climate is getting warmer, and that this warming trend was going to do us great harm. Putting aside whether these claims are based on fact (they are not), the possibility that the Earth might instead become cooler because of a dimming of the sun puts this political agenda under threat, and requires some form of immediate action to defuse that threat. See for example this short podcast (with full transcript) from Scientific American. The key quote:
A cooler sun might mean a drop in global average temperatures of at most 0.3 degree Celsius. But the carbon dioxide already in the atmosphere today will add 0.6 degree Celsius to global average temperatures by the end of the century. And more, since greenhouse gas emissions show no signs of diminishing. So the slightly cooler sun won’t counteract a much hotter Earth.
In order to discredit the threat that solar variation poses to global warming, the journalist here acts to minimize any danger from a dimming sun. Unfortunately, he does so by extrapolating a result (warmer climates) based on a very weak foundation: an unproven theory and our very limited knowledge of the climate.
» Read more
At a press conference today at the 2011 meeting of the Solar Physics Division (SPD) of the American Astronomical Society (AAS) in Las Cruces, New Mexico, solar scientists predicted that not only will the next solar maximum in 2013 be the weakest in centuries, it is very likely that it will be followed by another long Maunder Minimum, a period of decades without sunspots. “The sun may be going into hiatus,” says Dr. Frank Hill, associate director of the NSO’s Solar Synoptic Network. You can read the press releases for this announcement here and here.
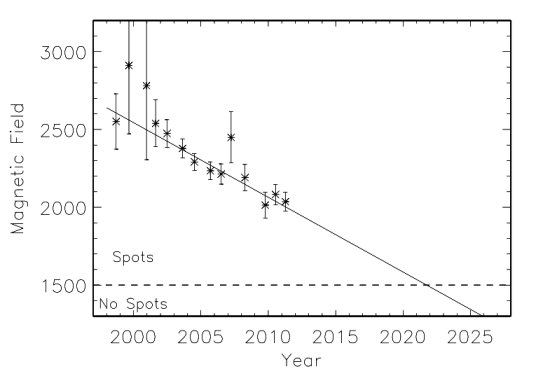
These conclusions are based on three lines of evidence:
Space weather expert downplays threat to Earth from solar flare.
My god, a reporter actually talked to a scientist on this subject, instead of the normal political hacks swilling for bigger budgets, and found out that we aren’t going to die!
Time again for the monthly updated graph of the Sun’s solar cycle sunspot activity. Posted today by NOAA’s Space Weather Prediction Center, you can see the May results in the graph below.
After a three month steady rise in sunspot activity in January, February, and March, the numbers plummeted during April and May. Though the Sun remains active, with only one blank day since January 16, the pattern of activity as it ramps up to solar maximum continues to suggest that we are looking for the weakest solar maximum in two hundred years, as now predicted by solar scientists at the Marshall Space Flight Center.
Whether this weak maximum foreshadows another Maunder-like minimum, with no sunspots occurring for decades, remains unknown. Only time will tell. However, if such a thing should happen, it will be a marvelous opportunity for scientists to finally pin down precisely the actual influence of the Sun on the Earth’s climate. Up until now they can only guess at how much the Sun varies in brightness. Another Maunder Minimum will tell them.
Did a spotless sun cause the Little Ice Age after all?
The monthly updated graph for April of the Sun’s solar cycle sunspot activity was posted yesterday by NOAA’s Space Weather Prediction Center. You can see it below.
Though the Sun remained active, you can see that the steep increase in sunspot activity that occurred in March has ceased. At the moment it looks as if the Sun’s sunspot activity is following the most recent scientific prediction, more or less exactly, though the small dip in April puts the numbers slightly below that prediction.
All in all, we still appear to be headed to the weakest solar maximum in two hundred years.

After literally years of inactivity, well below all initial predictions, the Sun truly came to life this past month. Below is the March monthly update of the Sun’s sunspot cycle, published by NOAA’s Space Weather Prediction Center. The red curve is the prediction, while the dotted black line shows the actual activity.
As you can see, the Sun’s sunspot activity shot up precipitously. Though I don’t have the data from past years, the March jump appears to me to probably be one of the fastest monthly rises ever recorded.
Does this mean the newest prediction from the solar scientists at the Marshall Space Flight Center calling for a weak solar maximum in 2013 is wrong? Probably not, though of course in this young field who knows? I would say, however, that the overall trend of the data still suggests the next maximum will be very weak.
Stay tuned! The next few months should finally give us a sense of where the next maximum is heading.

Earlier this week NOAA’s Space Weather Prediction Center published its monthly update of the Sun’s sunspot cycle. As I do every month, I’ve posted the newest graph below, showing the continuing slow rise in sunspots (blue/black lines) in comparison with the consensis prediction made by the solar science community in May 2009 (red line).
» Read more
Did you hear the news? Scientists have solved the mystery of the missing sunspots!
You didn’t? Well, here’s some headlines and stories that surely prove it:
The trouble is that every one of these headlines is 100 percent wrong. The research, based on computer models, only found that when the plasma flow from the equator to the poles beneath the Sun’s surface slows down, the number of sunspots declines.
» Read more
An evening pause: On February 15, 2011, the Sun emitted its strongest flare in four years. Though the Sun continues to act relatively wimpy as it ramps up towards solar maximum, this flare was spectacular, mostly because we now have some amazing instruments in space to image and study it. This video does an excellent job explaining what was happening, as it happened. Watch, and enjoy.
And note, as powerful as this flare was, and despite the fact that it was pointed right at the Earth, it represented a relatively minor threat to our technological society, despite what some doomsayers might be claiming. A very active Sun can cause us problems, especially with power systems and electrical grids, but based on past experience during previous solar maximums, most power companies have taken careful steps to protect themselves from this risk. And with the Sun as weakly active as it is, the risks are further reduced. The doomsayers are simply shilling for more government research dollars.
The sleepy kitten awakes! The Sun released its most powerful solar flare since 2006 last night.
Get those winter coats out of storage! Yesterday NOAA’s Space Weather Prediction Center published its monthly update of the Sun’s sunspot cycle. I’ve posted the newest graph below, showing the continuing slow rise in sunspots (blue/black lines) in comparison with the consensis prediction made by the solar science community in May 2009 (red line).
Though the sunspot count made a slight recovery in January, it was not enough to make up for the plunge in December. Essentially, the Sun continues to act like a sleepy kitten that really doesn’t want to wake up. This suggests that even the newest and wimpiest prediction for the next solar maximum, from solar scientists at the Marshall Space Flight Center, is still overstating the Sun’s upcoming sunspot activity.
In the past a wimpy Sun has been linked to cold weather, for reasons that scientists as yet don’t quiet understand. And this next solar maximum continues to look like the wimpiest in more than 200 years (see the graph on this page)!

Solar scientists at the Marshall Space Flight Center have once again revised downward their prediction for the intensity of the next solar maximum. Key quote:
Current prediction for the next sunspot cycle maximum gives a smoothed sunspot number maximum of about 59 in June/July of 2013. We are currently two years into Cycle 24 and the predicted size continues to fall.
If this prediction holds, the upcoming solar maximum could be the lowest since the cycle came back to life in around 1715 following the Maunder Minimum.
For today, and today only, the Sun was blank. This blankness ended, however, when a sunspot rotated into view from the far side.
As I asked the last time the Sun was blank in December, will this be the last blank day of the just-ended but very prolonged solar minimum?
The monthly update of the Sun’s developing sunspot cycle was published tonight by NOAA’s Space Weather Prediction Center. You can see the newest graph below, which shows the slow rise in sunspots (blue/black lines) in comparison with the consensis prediction made by the solar science community in May 2009 (red line).
Not only does the Sun’s generally quiet trend continue, its activity took an additional plunge in December, dropping significantly from the previous month. This drop is probably due to the seven days of no sunspots that took place in mid-December.
All in all, we continue to head for the weakest maximum in two hundred years (see the graph on this page), which in the past meant very cold weather. Though scientists do not yet understand why the Sun does this or how these changes in solar activity influence the climate as much as they do, that this in now happening at a time when we have the technology to truly study it is an opportunity that must not be missed.

Though I have been saying that the Sun’s lack of sunspots the last two years suggests the possibility of that we might be facing an extended period without solar activity, I am not a solar scientist. Today, in a paper published today on the Los Alamos astro-ph website, a solar scientist says just that. Key quote:
One method that has yielded predictions consistently in the right range during the past few solar cycles is that of K. Schatten et al., whose approach is mainly based on the polar field precursor. The incipient cycle 24 [on-going right now] will probably mark the end of the Modern Maximum, with the Sun switching to a state of less strong activity.
After six blank days, the Sun is once again showing spots. As I have mentioned several times in 2010, this might be the last time the Sun is blank for years to come as it ramps up to solar maximum. However, don’t bet on it, as the Sun’s activity has been way below all predictions. The upcoming solar maximum might very well be the first in centuries with blank days interspersed throughout.