
Webb spots aftermath of collision of two galaxies

Click for source.
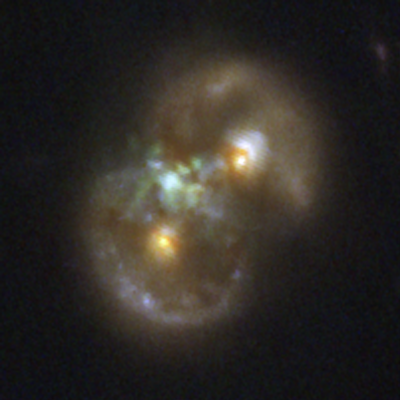
Using the Webb Space Telescope, astronomers have discovered the collision of two spiral galaxies that appears to have caused a supermassive black hole to collapse in its wake.
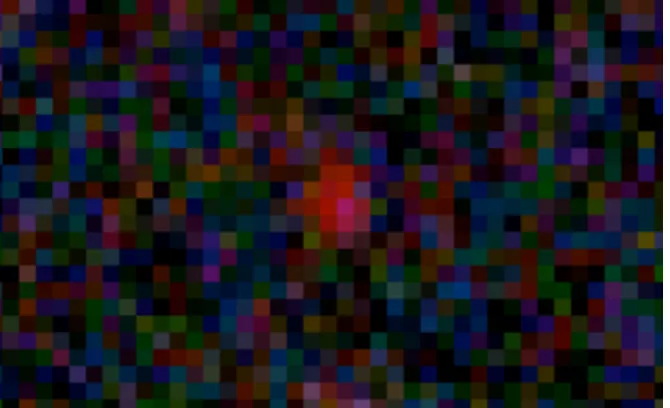
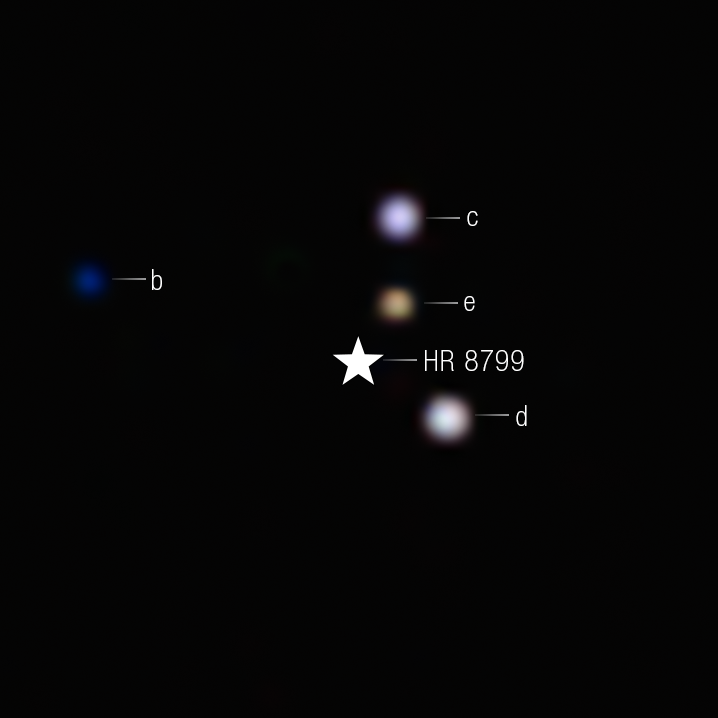
The Webb false-color infrared image to the right shows the two galaxies as the red dots, both surrounded by a ring, with the supermassive black hole the bluish spot in between but offset somewhat to the left. Follow-up radio observations suggested that this bluish spot was a supermassive black hole, having a mass of a million suns and sucking up matter from the giant gas cloud that surrounds it.
The team proposes that the black hole formed there via the direct collapse of a gas cloud – a process that may explain some of the incredibly massive black holes Webb has found in the early universe.
This hypothesis however has enormous uncertainties, and requires a lot more observations to confirm. The black hole could simply exist unrelated to the galaxy collision, having come there from elsewhere. Or it could be from a third galaxy in this group that these initial observations have not yet detected.
The image however is quite cool.
Click for source.
Using the Webb Space Telescope, astronomers have discovered the collision of two spiral galaxies that appears to have caused a supermassive black hole to collapse in its wake.
The Webb false-color infrared image to the right shows the two galaxies as the red dots, both surrounded by a ring, with the supermassive black hole the bluish spot in between but offset somewhat to the left. Follow-up radio observations suggested that this bluish spot was a supermassive black hole, having a mass of a million suns and sucking up matter from the giant gas cloud that surrounds it.
The team proposes that the black hole formed there via the direct collapse of a gas cloud – a process that may explain some of the incredibly massive black holes Webb has found in the early universe.
This hypothesis however has enormous uncertainties, and requires a lot more observations to confirm. The black hole could simply exist unrelated to the galaxy collision, having come there from elsewhere. Or it could be from a third galaxy in this group that these initial observations have not yet detected.
The image however is quite cool.


