Sunspot update April 2019: Not quite minimum
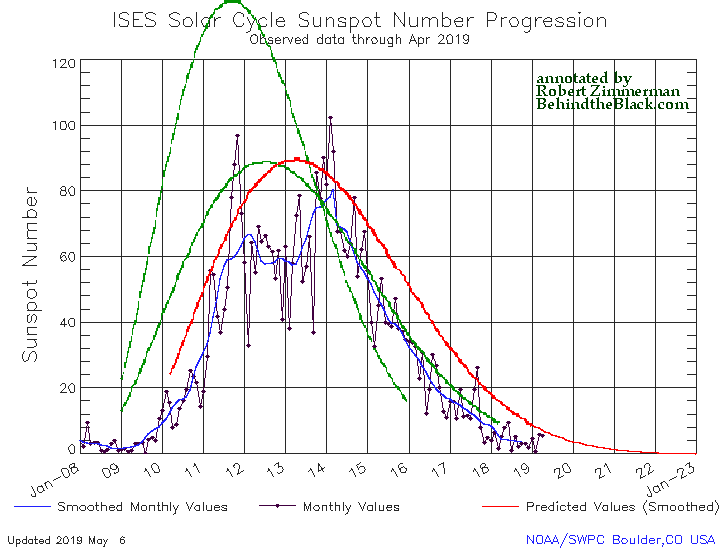
Time for the monthly sunspot update: NOAA yesterday released its the monthly update for the Sun’s sunspot cycle, adding sunspot activity for April 2019 to its graph. As I do every month, I have annotated that graph to give it some context and am posting it below.
While the Sun is clearly at the beginning of what might be an extended or very extended solar minimum, the continuing uptick in activity in both March and April illustrates that we have still not arrived at full minimum.

The graph above has been modified to show the predictions of the solar science community for the previous solar maximum. The green curves show the community’s two original predictions from April 2007, with half the scientists predicting a very strong maximum and half predicting a weak one. The red curve is their revised May 2009 prediction, extended in November 2018 four years into the future.
As the Sun ramps down to minimum it will have months where there is no activity, as happened in February 2019, and months, such as in March and April, where more sunspots appear.
Eventually the quiet months will become dominate, and soon thereafter, when activity increases again (assuming it does), the solar science community will then announce the date of true minimum.
We are not there. Normally it can take a year or more for the Sun to settle down. If activity declines as indicated by the red curve, it could take as long four years, which would be a record-long minimum. The difference will tell us whether the eleven-year solar cycle is continuing, or the Sun is heading into a grand minimum, with no significant sunspots for decades.
And as I have said repeatedly in the past five years, a grand minimum could significantly impact the global climate, cooling it. Or not. It is that unknown that will be answered should a grand minimum occur. Circumstantial data suggests an inactive Sun cools the planet, and the arrival of a new grand minimum will allow scientists to confirm or refute that circumstantial data.
On Christmas Eve 1968 three Americans became the first humans to visit another world. What they did to celebrate was unexpected and profound, and will be remembered throughout all human history. Genesis: the Story of Apollo 8, Robert Zimmerman's classic history of humanity's first journey to another world, tells that story, and it is now available as both an ebook and an audiobook, both with a foreword by Valerie Anders and a new introduction by Robert Zimmerman.
The print edition can be purchased at Amazon or from any other book seller. If you want an autographed copy the price is $60 for the hardback and $45 for the paperback, plus $8 shipping for each. Go here for purchasing details. The ebook is available everywhere for $5.99 (before discount) at amazon, or direct from my ebook publisher, ebookit. If you buy it from ebookit you don't support the big tech companies and the author gets a bigger cut much sooner.
The audiobook is also available at all these vendors, and is also free with a 30-day trial membership to Audible.
"Not simply about one mission, [Genesis] is also the history of America's quest for the moon... Zimmerman has done a masterful job of tying disparate events together into a solid account of one of America's greatest human triumphs."--San Antonio Express-News


Waiting with baited breath for empirical data!
This graph is for January 8 to 23
Ingrid Cummings; Those are not days, those are years. The graph covers the period from January 2008 to December 2023.
Thanks.
Fingers crossed for another Carrington Event!
Back in 2004, I believe, Space News had an article that explained that the currents on the Sun (not just sunspots) had been observed scientifically since about 1890 and that such observations enabled accurate predictions of sunspot activity over the following 20 years or so.
And they said that the latest observations of the currents showed them to be at The Lowest Level Ever Recorded. The prediction was that circa 2020 the sunspot activity would be unusually low.
I mentioned this to an gentleman I worked with at the time; he had a degree in astronomy. He responded that meant lower Solar output. It was interesting to me that the Space News article omitted this aspect, but of course the article was not about Global Warming. But then again no one else I am aware of has mentioned this aspect either.