
Sunspot update for August 2018: The slide to minimum
As it does the first Sunday of each month, yesterday NOAA posted its monthly update of the solar cycle, covering sunspot activity for August 2018. And as I do every month, I am posting it below, annotated to give it some context.
The Sun in August had a slight uptick in sunspot activity, but not a very significant one. As such, the slide to solar minimum continues. Right now the lack of sunspot activity in 2018 is heading to match or even exceed 2007, the year in which the previous solar minimum began.
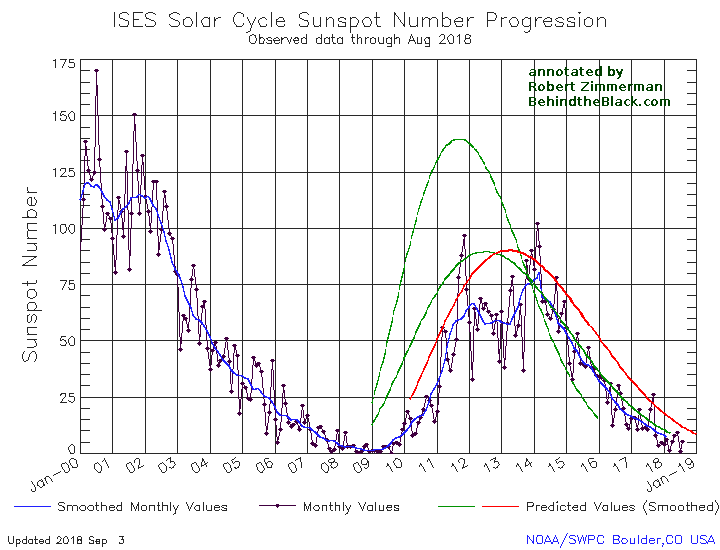
The graph above has been modified to show the predictions of the solar science community. The green curves show the community’s two original predictions from April 2007, with half the scientists predicting a very strong maximum and half predicting a weak one. The red curve is their revised May 2009 prediction.
If you look at the original graph at NOAA, you will see that we are getting very close to the right edge of the graph. I expect that sometime in the next few months NOAA will update the graph, a necessary act that will in one sense be a shame, as they have been adding monthly updates to this graph since the beginning of the last solar minimum. This has allowed everyone to see a standard visual, month to month, for comparing solar activity. It has also allowed me to annotate the graph properly to show how the 2007 and 2009 predictions held up against actual activity. Once the graph changes it will be more difficult to do this.
Anyway, it is very clear we are entering solar minimum, and that the solar cycle we are now completing will be both a short and weak cycle. What happens next is really the big question. Will the Sun sunspot activity recover? Or will we enter the first grand minimum since the 1600s? Either way, for solar scientists the coming years are going to be very exciting.
Posted on interstate 10 going from Tucson to Phoenix, on the way to the wooded northern forests of Arizona, where Diane and I will spend a couple of days visiting friends at their upstate cabin/home.

On Christmas Eve 1968 three Americans became the first humans to visit another world. What they did to celebrate was unexpected and profound, and will be remembered throughout all human history. Genesis: the Story of Apollo 8, Robert Zimmerman's classic history of humanity's first journey to another world, tells that story, and it is now available as both an ebook and an audiobook, both with a foreword by Valerie Anders and a new introduction by Robert Zimmerman.
The print edition can be purchased at Amazon or from any other book seller. If you want an autographed copy the price is $60 for the hardback and $45 for the paperback, plus $8 shipping for each. Go here for purchasing details. The ebook is available everywhere for $5.99 (before discount) at amazon, or direct from my ebook publisher, ebookit. If you buy it from ebookit you don't support the big tech companies and the author gets a bigger cut much sooner.
The audiobook is also available at all these vendors, and is also free with a 30-day trial membership to Audible.
"Not simply about one mission, [Genesis] is also the history of America's quest for the moon... Zimmerman has done a masterful job of tying disparate events together into a solid account of one of America's greatest human triumphs."--San Antonio Express-News
The yellow line compares the present activity with the activity during solar minimum in 2008 and 2009.
What yellow line?
(And thanks for keeping us updated on this!)
Kirk: The yellow line was from a previous post, which I forgot to remove. Now fixed. Thank you.
Curves with data from the start of solar monitoring would be useful. To see the Maunder and the Dalton minimums on one graph along with current data would be informative. I have seen a presentation by Dr. Ken Tapping (Canada NRC) which also has temperature data. The relationship between data sets was interesting to say the least. The data set for the 10.7 cm band now is growing to several decades. Still too early to make predictions. Current research is looking into other indices for future monitoring. However, until there is data for several hundreds of years (as the sun spot data has) true predictions are difficult.
@Phill O
Here’s a plot from the beginning to 2016. I note that the last through looks like the widest since the Dalton Minimum early 19th century. And the double peak on the current cycle now ending looks unusually wide too, there’s a through in the peak.
https://en.wikipedia.org/wiki/Solar_cycle#/media/File:Sunspot_Numbers.png
What I noted above might be an illusion. The noise in the sunspot number has decreased with time, maybe because of better observations.
If we were to see another Little Ice Age as a result of another solar minimum like the Maunder Minimum, going on what happened last time if the solar minimum starts now we can expect the resulting LIA to start around 1968.
Thanks Localfluff. This is the graph I have seen before. Tapping also had a graph showing temperatures correlated. There was a temperature dip associated with the Dalton minimum, but not to the same extent as that for the Maunder min.
There was talk by a Nova Scotian who had a grandfather that walked across a frozen Bedford Basin in the 1800s. This is where many WWII convoys were staged and also the site of the largest non-nuclear explosion in history. I can only imagine the L I A temperatures.
This time, if the sun spots cycle remains low, we may be able to define the time required for the glaciers to start advancing after the long period of recession we have gone though. This would be an exciting time for scientists. Just think, evaluating something scientifically that is real!
By the way, can I ask Bob to include this link in future posts? I send this link out to many skeptics of the AGW theory, but they do not know any of the scientific information that refutes that theory.
@Phill O
The Soviet Moon rocket N1 explosion, the one at the launch pad right after start, has been said to be the largest non-nuclear detonation ever. But that seems to assume that all of the kerosene and oxygen detonated. Seems to have been only 15% of it. It still makes the top-ten list. A BFR maybe breaks that record one day. Methane should be more volatile than kerosene. I lit up an old (methane) gas oven too late once, and damn, the paintings and decorative plates fell off the walls. I heard later that a neighbor had died from heart attack, which made me a bit nervous, but it turned out to have happened the day before.
It will be hard to beat the Halifax explosion, the result as follows:
At 9:05 a.m., in the harbor of Halifax in the Canadian province of Nova Scotia, the most devastating manmade explosion in the pre-atomic age occurs when the Mont Blanc, a French munitions ship, explodes 20 minutes after colliding with another vessel.
source:
https://www.history.com/this-day-in-history/the-great-halifax-explosion
From localfluff’s graphs;
https://en.m.wikipedia.org/wiki/Solar_cycle#/media/File%3ASynoptic-solmag.jpg
Notice a decrease in the intensity of this cycle’s Sun spots. The dim magnetic field on north and south pole of the sun as compared to the other cycles.
The prediction of an unusual cycle has strong evidence in my opinion.