
The August monthly sunspot graph
Waking up is hard to do. Today NOAA’s Space Weather Prediction Center once again published its monthly graph, showing the progress of the sun’s sunspot cycle in comparison with the consensis prediction made by the solar science community in May 2009.
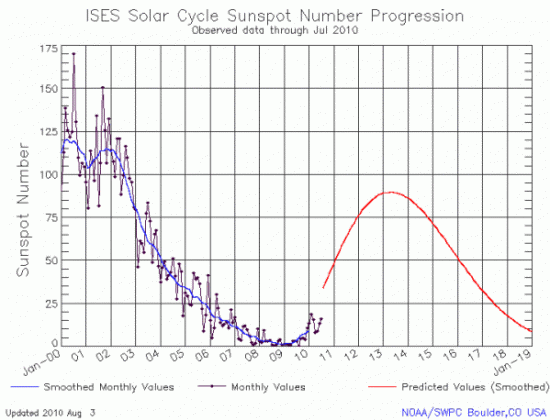
As I noted when I posted the July graph, the data continues to show that the Sun’s ramp up to solar maximum is far slower and weaker than predicted, despite the stories this week about how Sunday’s coronal mass ejection demonstrates that the sun is “waking up.”

On Christmas Eve 1968 three Americans became the first humans to visit another world. What they did to celebrate was unexpected and profound, and will be remembered throughout all human history. Genesis: the Story of Apollo 8, Robert Zimmerman's classic history of humanity's first journey to another world, tells that story, and it is now available as both an ebook and an audiobook, both with a foreword by Valerie Anders and a new introduction by Robert Zimmerman.
The print edition can be purchased at Amazon or from any other book seller. If you want an autographed copy the price is $60 for the hardback and $45 for the paperback, plus $8 shipping for each. Go here for purchasing details. The ebook is available everywhere for $5.99 (before discount) at amazon, or direct from my ebook publisher, ebookit. If you buy it from ebookit you don't support the big tech companies and the author gets a bigger cut much sooner.
The audiobook is also available at all these vendors, and is also free with a 30-day trial membership to Audible.
"Not simply about one mission, [Genesis] is also the history of America's quest for the moon... Zimmerman has done a masterful job of tying disparate events together into a solid account of one of America's greatest human triumphs."--San Antonio Express-News
Predictions for the coming sun spot cycle vary from very mild to extreme. The latest New Scientist has recognized that the sun does have an influence on our climate, albeit, not as extreme as our emissions. It will be very interesting if we have an El Nino sometime between 2012-2014. The sun, the El Nino plus the ever increasing Carbon dioxide in the air will all contribute to Arctic melting. That may just possibly be the year when we will see a pretty well ice free arctic with the accompanying acceleration of the melting of Greenland. Interesting days.