
No warming in U.S. since 2005
Click for full image.
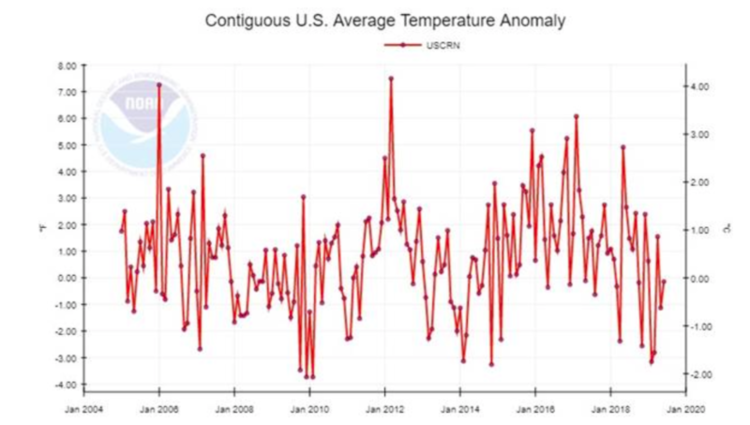
Using temperature stations specifically picked to eliminate as many biases and temperature errors as possible, NOAA has found that since 2005 the continental United States has experienced no warming at all.
The graph at the right, reduced to post here, illustrates this.
In January 2005, NOAA began recording temperatures at its newly built U.S. Climate Reference Network (USCRN). USCRN includes 114 pristinely maintained temperature stations spaced relatively uniformly across the lower 48 states. NOAA selected locations that were far away from urban and land-development impacts that might artificially taint temperature readings.
Prior to the USCRN going online, alarmists and skeptics sparred over the accuracy of reported temperature data. With most preexisting temperature stations located in or near urban settings that are subject to false temperature signals and create their own microclimates that change over time, government officials performed many often-controversial adjustments to the raw temperature data. Skeptics of an asserted climate crisis pointed out that most of the reported warming in the United States was non-existent in the raw temperature data, but was added to the record by government officials.
The USCRN has eliminated the need to rely on, and adjust the data from, outdated temperature stations. Strikingly, as shown in the graph below, USCRN temperature stations show no warming since 2005 when the network went online. If anything, U.S. temperatures are now slightly cooler than they were 14 years ago.
What is significant about this data is how it reveals the dishonesty of the adjustments that NOAA and NASA have been making to the temperature data. Those adjustments, supposedly done to make the data more accurate, have always cooled the past and warmed the present, a pattern that by itself is very suspicious.
These temperature stations were chosen to create a reliable baseline, picking stations that needed no adjustment and would thus give scientists a measure for justifying any alterations they impose on the raw data. Not only does this data suggest strongly that the claims of global warming year after year (“This year was the hottest on record!”) are suspect, it also shows that there is something seriously wrong with their adjustments. If their modifications to the raw data was correct, then this set of data should have matched it. It does not.
Will this mean they will readjust the overall data to eliminate the cooling in the past and the warming in the near present to make the data better fit what these results prove? Don’t be silly! That would show that there is little merit to the theories of the global warming alarmists, something that cannot be tolerated. It might cause those big government contracts to be cancelled. Worse, it will make it more difficult for these leftists to use the data to justify reshaping society into their vision of a socialist utopia.
No, what I expect to happen is that the scientists at NOAA (who also happen to be the ones who have been tampering with all the other data) to begin altering the temperature data from these baseline stations, to make them fit their theories. Or as Democratic presidential candidate Joe Biden recently put it, “We choose truth over facts.”

On Christmas Eve 1968 three Americans became the first humans to visit another world. What they did to celebrate was unexpected and profound, and will be remembered throughout all human history. Genesis: the Story of Apollo 8, Robert Zimmerman's classic history of humanity's first journey to another world, tells that story, and it is now available as both an ebook and an audiobook, both with a foreword by Valerie Anders and a new introduction by Robert Zimmerman.
The print edition can be purchased at Amazon or from any other book seller. If you want an autographed copy the price is $60 for the hardback and $45 for the paperback, plus $8 shipping for each. Go here for purchasing details. The ebook is available everywhere for $5.99 (before discount) at amazon, or direct from my ebook publisher, ebookit. If you buy it from ebookit you don't support the big tech companies and the author gets a bigger cut much sooner.
The audiobook is also available at all these vendors, and is also free with a 30-day trial membership to Audible.
"Not simply about one mission, [Genesis] is also the history of America's quest for the moon... Zimmerman has done a masterful job of tying disparate events together into a solid account of one of America's greatest human triumphs."--San Antonio Express-News
And, since 2005, how much of the AGW increase of CO2 has there been? — what, with China and India coming on line.
OK, after looking at some graphs, it seems as though the portion of the anthropogenic CO2 which has occurred since 2005 is 22%. So, essentially no increase in surface temperatures despite a 22% increase in anthropogenic CO2? Unless there is a substantial delay, it seems like surface temperatures should have increased noticeably.
DougSpace,
Let’s see…..
1955 – 313 ppm
2005 – 380 ppm 6.6 ppm per year average from 1955
2019 – 409 ppm 2.07 ppm per year from 2005
Claimed tipping point in 2006 – 550 ppm
At current rate from last 14 years it will tip in 68 years….
While surface measurements show global temperature increases since 2005, I haven’t been able to find any graphs for the contiguous states that (eyeballing) appear to show a temperature rise. Perhaps someone here knows of a site that clearing shows what the adjusted contiguous states temperatures are doing since 2005 so we have a direct comparison between these selected sites and the rest after any adjustments.
Short of being able to make such a direct comparison there’s no evidence offered above to support Mr. Zimmerman’s speculations about the appropriateness of adjustments made in the contiguous states temperature records.
DougSpace,
You cannot depend on the anthropogenic numbers as they are created from subtracting the assumed natural numbers from the total.
Here is an example how they are off.
https://youtu.be/NYoOcaqCzxo
I believe the number is further off by the sunspot effects of cloud formations that this study does not include.
As our knowledge of natural forces of climate increases, the anthropogenic effects shrinks.
Speaking of data quandaries:
Does anyone know of any measurements for the “output of the sun”. Or more specifically how much radiated power is hitting the earth in various points on the earth over time (days, months, years decades)?
I would expect this data would have power / square meter units and perhaps a spectral component.
there would also need to be information on the local weather as well.
Perhaps there is data from satellites?
I wonder if this is available and perhaps can correspond to the the sun spot data.
I also wonder how good the coverage is across the earth and how far back the data goes.
Sorry not quandaries —- queries
Chris–
(I like the way you think. I assume the “pro’s” keep track of these variables, but I wonder some times, ya know?!)
This has come up before in parts (the magical solar-road if memory serves, and other posts)–The output of the sun is a known quantity and it’s a huge number (like 10 to the 24th power) More relevant, if I recall correctly, we get “about” 500 watts/square meter, at the surface, –depending on weather, season, location (height) etc. But I would defer to anyone who actually knows, and don’t quote me.)
If you want to know how much strikes the upper atmosphere– I don’t know, but I assume that’s a known quantity as well.
–Is WeatherUnderground still operating? Their personal weather-stations kept track of solar radiation reaching the ground.
Above the atmosphere it’s about 1361 W/m^2, that varies by about 0.05% throughout the solar cycles. At noon on a clear day near the equator about 1000W/m^2 gets to the surface, Earth’s Bond albedo is about 0.3, because Earth is a sphere the average W/m^2 of the surface is 1/4 that of the disc. What’s hitting the earth in various points on the earth over time (days, months, years decades) is obviously not a simple answer, but’s essential to know and plug into models to get any sort of results.
This from Berkeley Earth, it only goes up to 2014 but it’s clear adjustments make very little difference over just a decade or so and that from 2005 – 2014 us temperatures were declining no matter what data set is referenced.
http://berkeleyearth.org/wp-content/uploads/2015/04/Figure1.png
I had the same thought a year or two back and figured the DSCOVR satellite might be a source of such data. DSCOVR seems to have four radiometers that allow it to track how much solar energy is reflected or black-body radiated by the Earth, but I wasn’t able to discover any indication that it has any kind of direct-reading instrument on its outboard side that measures incident solar radiation. That would seem to me to make reflectivity/radiated energy measurements less useful. But DSCOVR, which, at the time it was funded and built, was given the nickname Goresat after our Warmist-in-Chief former Vice President, always seemed to me to be more an exercise in political polemics than in science anyway.
Andrew_W,
You wrote: “Short of being able to make such a direct comparison there’s no evidence offered above to support Mr. Zimmerman’s speculations about the appropriateness of adjustments made in the contiguous states temperature records.”
Actually, the fact (or truth, as Biden prefers to call it) that the temperature data sets had been altered and released without notification of any changes is the very definition of fudging the data. Had the adjustments been appropriate, then they would have been announced in advance and each adjusted data point publicly justified by the time of release, and the changes would not have had to been discovered by the surprised scientists receiving the altered data sets. Fudging data is never scientifically appropriate. But I have pointed out this fact (truth) to you before, so in saying so again now, I do not expect you to change your biased mind. You accept without question any statements that support your viewpoint and reject out of hand all others.
I have worked in the scientific field and am appalled by the horrific treatment that the world’s climate data has received over the years. Not only has data been fudged but some data has been mislaid after a statement that it would be lost rather than be made available for examination, and inappropriate proxies have been used in order to confirm the biases of some researchers.
The attitude that you have, Andrew_W, belies Biden’s claim that “we choose science over fiction.” Rejecting skepticism is not scientific but is clinging to a hypothesis (a guess, perhaps a fiction) without the science to back it up. That the world’s climate journals now refuse to publish skeptical papers shows that climate science is no longer a science but is a fiction. That the news media likewise refuses to acknowledge any scientific skepticism (e.g. The Los Angeles Times refuses to publish any opinions that are contrary to Anthropogenic Global Warming or Climate Change) is just as bad, as it disavows that science relies upon skepticism in order to confirm scientific findings.
Nobel Prizes have been awarded to people whose theories were later disproved. This is how important skepticism is to science and how tragic it can be to postpone or avoid the skeptical review of the science. If we spend Billions or Trillions of dollars mitigating something that turns out to be unfounded, then we squandered money and resources that would have been better spent on other problems, such as finding a cure for cancer. What a terrible thing it would be to think that a fiction is a science.
Robert, the “pristine” CRN sites themselves are susceptible to encroachment by artificial infrastructure. Fortunately it’s only one of the 114 sites and one of a pair of closely located sites that has been compromised. See the research article I wrote last year.
https://wattsupwiththat.com/2018/04/09/infrastructure-encroachment-at-a-noaa-climate-reference-uscrn-site-makes-the-data-warmer/
Gary: Nice work.
The bottom line from my perspective is that the whole climate field is presently badly compromised, in every way. Their data is suspect, their methods are suspect, their motives are suspect, and their conclusions are suspect. This on top of the very simple fact that the subject matter is incredibly complex with gigantic known uncertainties and unknowns that make any prediction at this point worthless.
But politicians tell us the science is settled and that “the world is going to end in 12 years [now only 11 years and 5 months] if we don’t address climate change.” We of course must believe them and do everything they say.
Edward, well there’s a dilemma: Do we just accept that, (a) as would be expected and has been the case in the past, that the raw and adjusted data converge so that within a decade of the contemporary date there’s very little difference between the two, as the graph I link to shows, or (b) do we go with the theory that there’s a huge conspiracy of scientists that realize they’ll be caught out if they suddenly increase the difference between the resent raw data and adjusted data even though there’s never been a huge difference between the two in the data within a decade of the contemporary date before?
Well that’s a toughie, I’ll go with (a) because I’m not a fan of flaky conspiracy theories.
Thanks Andrew
So 1361 W/m^2 is for a location on the equator – but about 30% gets to the surface (0.3 albido – am i missing this point?)
So does the power hitting the surface match with the model of a sphere being radiated by a point source 8 million miles away at various points on the earth?
On the question of how this measurement varies over time at each measurement point on the earth – i wonder what the data history is here? (or there) And what the number of points there are. I also wonder about the model of a uniform source for the sun providing a uniform power (flux density?) to each m^2 on the earth. Good assumption; but known? – I don’t know. Has this changed over time? over geography?
Thanks for the Berkley Earth data – However I didn’t get much from it other than the data converges from 1980 on World and from 2000 in US. Does this reflect differing metrology efforts in he US and globally or perhaps an increase in the number of collection points? – the variances are small – a few tenths. Is this data across the globe – varying latitudes into 1900? I suspect the coverage on the number of collection points on he surface of the earth is lower earlier and may explain the variance in the raw vs adjusted data.
” . . . but about 30% gets to the surface (0.3 albido – am i missing this point?).”
About 70% would get to the surface if there were no clouds, taking clouds into account wiki says: “Other sources indicate an “Average over the entire earth” of “164 Watts per square meter over a 24 hour day” “, given the surface area of a sphere is 4 times the surface area of a disc of the same diameter that would mean that 4 x 164 = 565 Watts out of that 1361 W gets to the surface, most of that which is blocked (by the gases in the atmosphere rather than by clouds) is in the IR and (to a much lesser extent) UV.
So does the power hitting the surface match with the model of a sphere being radiated by a point source 8 million miles away at various points on the earth?
No idea what you’re getting at. Though you have reminded me to mention that that 1361 Watt figure is for Earth at its Semi-major axis distance from the center of the Sun of about 149,600,000 km, actual insolation at perihelion is about 7% more than at aphelion.
On the question of . . .
I couldn’t make substantive claims because those are details I’m not conversant with, ask the experts.
Thanks for the Berkley Earth data – However I didn’t get much from it other than the data converges from 1980 on World and from 2000 in US. Does this reflect differing metrology efforts in he US and globally or perhaps an increase in the number of collection points?
I can only offer this link:
https://judithcurry.com/2014/07/07/understanding-adjustments-to-temperature-data/
There are links to the two additional articles by Zeke Hausfather at the bottom of the article:
“Understanding Time of Observation Bias” and “Assessing U.S. temperature adjustments using the Climate Reference Network”
There is also a link to The Pairwise Homogenization Algorithm and codes used in making adjustments in the article.
Certainly the confidence in the temperatures calculated from measurements for the early part of the data sets is far lower than that for later measurements due in part to the sparsity of land and ocean measurements that were taken back then.
Correction to above: “given the surface area of a sphere is 4 times the surface area of a disc of the same diameter that would mean that 4 x 164 = 565 Watts out of that 1361 W gets to the surface,”
Should have been: “given the surface area of a sphere is 4 times the surface area of a disc of the same diameter that would mean that 4 x 164 = 656 Watts out of that 1361 W gets to the surface,” (about 1/2).
Thanks Andrew
So does the power hitting the surface match with the model of a sphere being radiated by a point source 8 million miles away at various points on the earth?
The 8 million should be 93 million – distance from the earth to the sun
a brief digression….
Jordan Peterson’s thoughts on ‘Climate Change’
https://youtu.be/nV6_5IDdZGU
12:57
So does the power hitting the surface match with the model of a sphere being radiated by a point source 8 million miles away at various points on the earth?
I’ve no idea what you’re getting at, as you say, the Sun is much further away than that.
Andrew_W wrote: “or (b) do we go with the theory that there’s a huge conspiracy of scientists that realize they’ll be caught out if they suddenly increase the difference between the resent raw data and adjusted data even though there’s never been a huge difference between the two in the data within a decade of the contemporary date before?”
Not such a toughie, considering that NOAA actually did release tampered data without notification or justification of the adjustments, we see that (b) actually happened. They fudged the data, released it, and didn’t care that they got caught, because they knew that there would be no adverse consequences, and there weren’t.
Further supporting this option are the East Anglia emails that were made public in 2009.
This conspiracy is not even a hidden conspiracy. There are publications that have announced that they will not publish anything that contradicts AGW. Many non-scientists have publicly announced that “the debate is over,” yet there are still many, many skeptics still to be heard — the debate is only over because AGW proponents have been unsuccessful in debating the topic and have stopped engaging in debate. The open conspiracy extends beyond scientists.
But then again, you never pay attention, so you don’t know these things. And still don’t, because you didn’t pay attention as you read this.
Not such a toughie, considering that NOAA actually did release tampered data without notification or justification of the adjustments, we see that (b) actually happened.
Are you referring to the error that Steve McIntyre discovered in January 2000? That error was acknowledged and corrected.
If you’re referring to some other incident of “tampered data” please share the details – as you understand them.
There are publications that have announced that they will not publish anything that contradicts AGW.
What publications choose to publish is their business, not evidence supporting your conspiracy theory.
Do you think there aren’t publications that won’t publish anything supporting AGW as real? That’s also their choice.
AGW proponents have been unsuccessful in debating the topic
In terms of the science the AGW “proponents” are far ahead, in the US the public propaganda campaign by contrarians has had considerable success.
Andrew_W,
You asked: “Are you referring to the error that Steve McIntyre discovered in January 2000?”
No.
“If you’re referring to some other incident of “tampered data” please share the details – as you understand them.”
Once again, you do not pay any attention. I have already done this. Robert has done this.
“What publications choose to publish is their business, not evidence supporting your conspiracy theory.”
It is their business, but it is also evidence of the open conspiracy, which is also their business. Indeed, it is proof that they are participating in keeping alternate possibilities from being discussed.
“Do you think there aren’t publications that won’t publish anything supporting AGW as real?”
Possibly, but that makes it much harder to discuss such supporting evidence. It would also be their business for any publication that wants to outright deny that there is any AGW, but ignoring supporting evidence denies them the ability to refute it, making it difficult to make their case, just as it is difficult for AGW advocates to make their case when they allow debate or alternate possibilities.
“In terms of the science the AGW ‘proponents’ are far ahead, in the US the public propaganda campaign by contrarians has had considerable success.”
Once again, you have not paid attention. The success you see is only the lack of debate and the lack of acknowledgement of alternate possibilities. You make my case for me.
What is the solar irradiance?
From Wikipedia;
“The Sun’s rays are attenuated as they pass through the atmosphere, leaving maximum normal surface irradiance at approximately 1000 W /m2 at sea level on a clear day. When 1361 W/m2 is arriving above the atmosphere (when the sun is at the zenith in a cloudless sky), direct sun is about 1050 W/m2, and global radiation on a horizontal surface at ground level is about 1120 W/m2.[26] The latter figure includes radiation scattered or reemitted by atmosphere and surroundings. The actual figure varies with the Sun’s angle and atmospheric circumstances. Ignoring clouds, the daily average insolation for the Earth is approximately 6 kWh/m2 = 21.6 MJ/m2.”
The solar race takes place in Australia because it averages 1000 W per meter squared (ten, 100 Watt lightbulbs in a meter sized box) The land is flat with seldom having clouds. Summer, when the earth is closest to the sun. Perfect conditions for a solar powered car.
The amount of energy reaching the ground is so variable that each region has its own rating calculated by how much solar collectors absorb or how much power produced in a years time on a photovoltaic panel. Every seller of solar panels has a calculator to tell you how economical it would be in your area.
https://pvwatts.nrel.gov/
Your tax money has been working on this problem since the Carter administration, solving the energy crisis. They’ve been claiming to have the solution coming very soon for 30 years, they just need a few billion more dollars.
It still takes more energy to manufacture and install solar panels, then the energy they create in their lifetime.
Energy and space wasted on a unfulfilled promise for the appearance of us doing something useful when we are actually harming the environment. In 20 to 30 years, when the solar panels are oxidized and useless, it will take more energy then manufacturing the panels in the first place, to tear them down and dispose of the toxic waste that landfills won’t take. A problem no one has addressed yet. Who’s gonna pay for the removal of all those useless panels? In my opinion, it’s like buying a boat with a hole in it. You are disappointed the moment you take ownership.
There has never been shown a relationship between CO2 and atmospheric heating. Even in Al gore’s movie it shows a temperature rise hundreds of years “before” the CO2 begins to rise. Most likely due to the release of CO2 from icemelt. (Frozen water loves carbon dioxide, ice is full of it)
95% of greenhouse gases is water vapor. H402 ( H2O ) it’s so much larger of a molecule than CO2 collecting energy in the same bandwidth,covering 30% or more of the planet continuously. 300,000 ppm versus 400 ppm. It’s obvious the climatologist are barking up the wrong tree. Therefore, demonizing carbon dioxide for illusionary problem has its foundations in a motive for scaring people into a control situation manufactured most likely for the purpose of population control. Would you kill to save the planet? First they must convince you that the planet needs saving, otherwise it’s just killing for killing sake. That is evil. So they must convince you of a moral righteous higher purpose otherwise their future is as bleak as Hitler. Control is resisted and lost. This way when the killing is done, the holy survivors can pat themselves on the back because the planet will still be here, they think they have saved It!
The future dark age.
No one will turn off their heat in the winter or stop eating food or driving their cars. The solution is clear, only way to cut back on energy consumption it’s to remove the consumer. The demand will dry up.
This is why when I hear environmentalist complain about carbon dioxide, I will hand them a plastic bag to tie over their heads and tell them to be an example, to do something about it. Live your religion, don’t just talk about others doing it. Don’t force others to live the way you do not. That is the mark of a false conman religion. Even the pope can’t sell it…
To my point about Conservative / Republican politicos paying more attention to the issue of pollution in general and specifically plastics in the environment. I encounter this now every day as I interact with the public, both Left and Right.
https://www.reuters.com/article/us-environment-poll-republicans/surge-in-young-republicans-worried-about-the-environment-survey-idUSKCN1VJ17V
This is an issue that the Conservatives / Republicans can easily rest from the Left and actually do something positive and effective. The media contagieon that permeates the publics mind combined with the imagery of piles of plastic bags and bottles on beautiful beaches, and the visceral imagery of dead dolphines and fish due to their ingesting those plastics is real.
To ignore this now appaently documented and growing in the minds of the young politically active turks who vote issue is to ignore a political opportunity to increase the likelyhood of success now and in the future. And the end result can be a cleaner environment for both the left and the Right.
Climate change proponent’s are the only group of “scientists” who accept data that has been altered without any explanation and proof as to why.
I was wondering though. Since water levels are not rising fast enough to keep people from buying ocean front property, are the deserts increasing instead?