The discovery of new caves on the Moon keep coming. Today I have two new stories. The first is a discovery by professional scientists of a giant lava tube cave in the Oceanus Procellarum or Ocean of Storms. The second is the detection of a plethora of caves and sinks on the floor of the crater Copernicus, found by a NASA engineer who likes to explore the gobs of data being accumulated by Lunar Reconnaissance Orbiter and made available to all on the web.
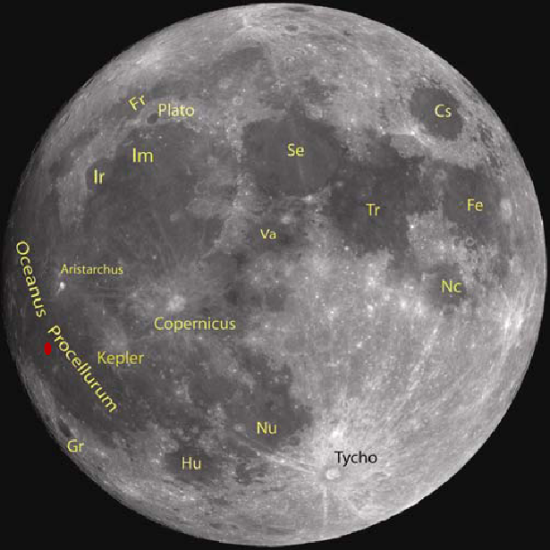
The image below of the Moon’s near side, taken by India’s Cartosat-2A satellite and taken from the science paper, shows the location of lava tube in Oceanus Procellarum (indicated by the red dot) and the crater Copernicus.
First the professional discovery. Yesterday, the Times of India reported the discovery of lava tube more than a mile long on the Moon. I did not post a link to the article because I didn’t think the news story provided enough information to make it worth passing along. Today however, fellow caver Mark Minton emailed me the link where the actual research paper could be downloaded [pdf]. This I find definitely worth describing.
» Read more