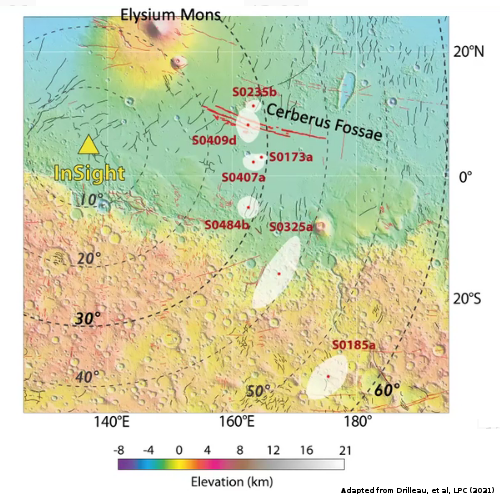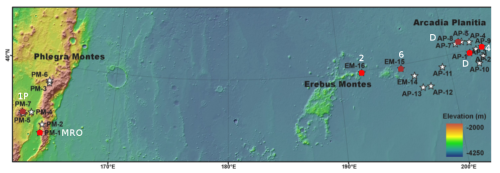
Capitalism in space: During this week’s 52nd Lunar and Planetary Science Conference, one poster [pdf] caught my eye as something significant. It was titled “SpaceX Starship Landing Sites on Mars.” The map to the right is figure 1 from that poster, annotated slightly by me based my earlier stories about SpaceX’s use of the high resolution camera on Mars Reconnaissance Orbiter (MRO) to research potential Martian landing sites for its Starship spacecraft. The stars indicate MRO images, most of which were described and linked to in my last major post about this SpaceX effort in November 2019.
The red spots covering some stars are the big story: SpaceX has narrowed its choice for its Starship landing site to four prime locations (indicated by the bright red spots) and three backup locations (indicated by the dark red spots). The images under the red spots numbered 2, 4, and 6 were linked to in my November 2019 post. The images under red spots marked by a “D” are earlier images taken by MRO when SpaceX was researching a potential Dragon landing site. The images under red spots labeled 1P and MRO are subsequent images taken by MRO since November 2019, with the 1P image previously linked to in a post in April 2020 entitled “The icy Phlegra Mountains: Mars’ future second city.”
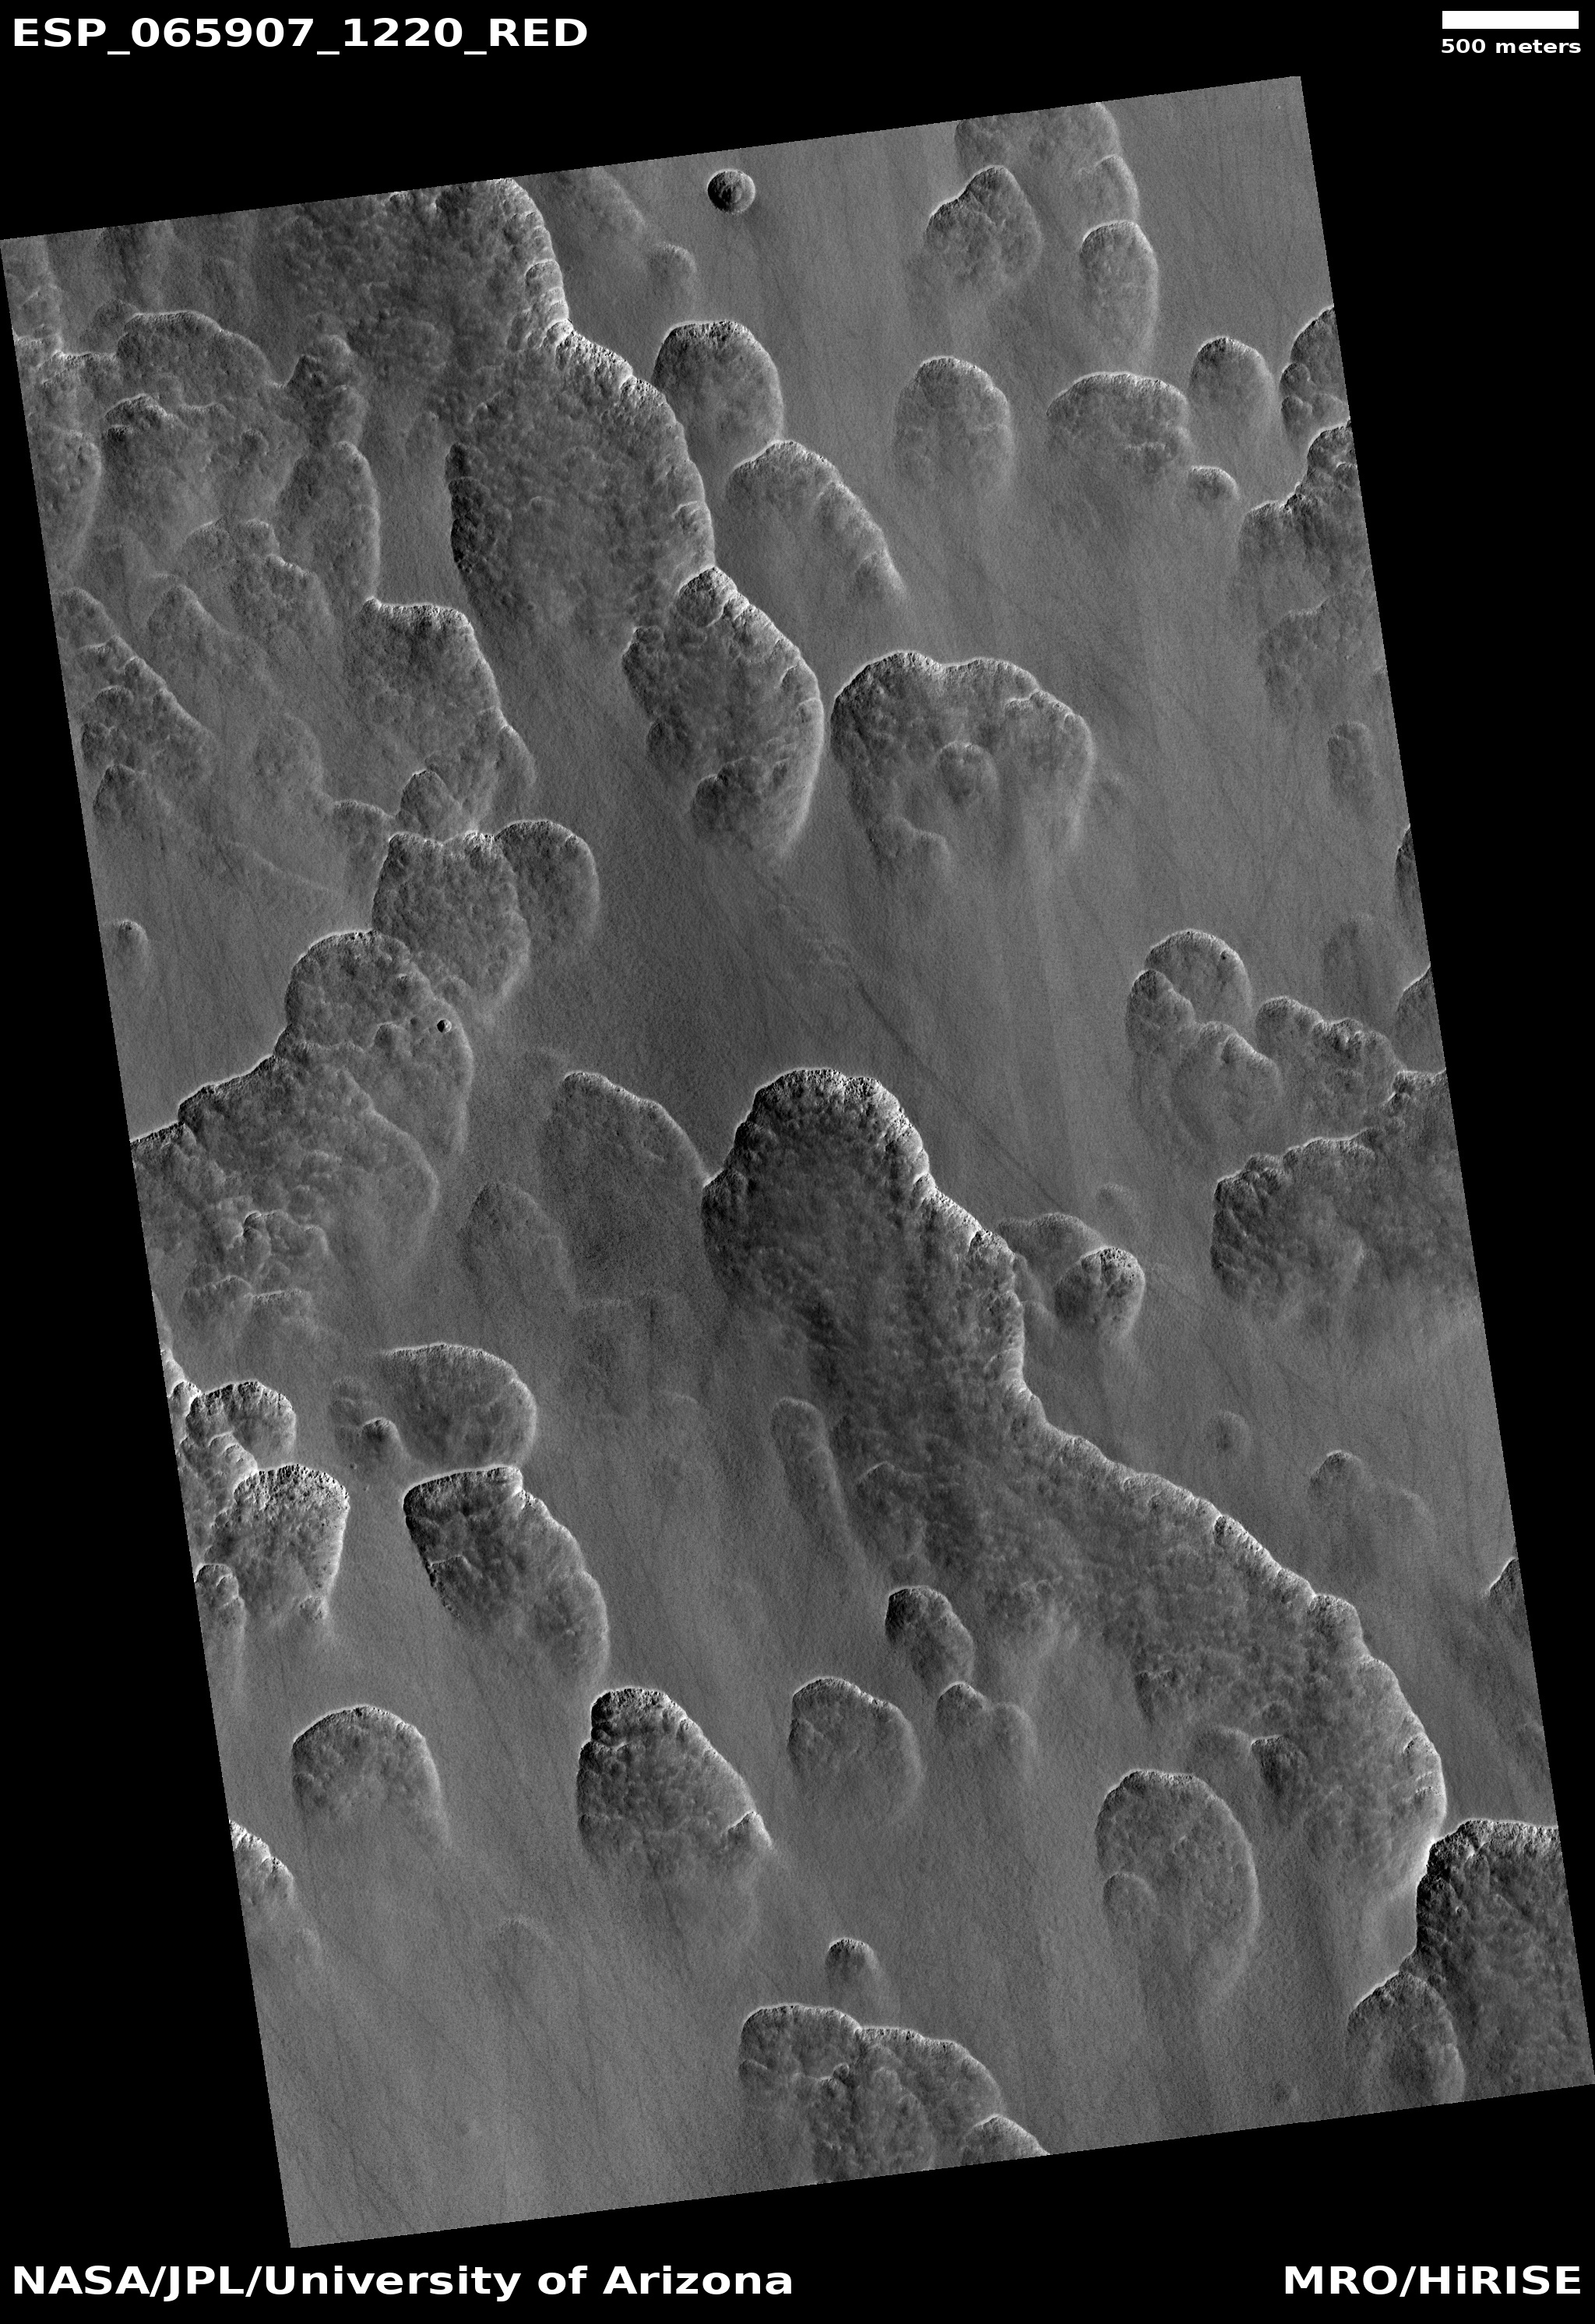
The poster outlined why the prime candidate sites — PM1, EM16, AP1, and AP9 — were favored. For example, PM-1 in the Phlegra Mountains “…has the lowest latitude and elevation of the group, a clear association with LDAs [lobate debris aprons that resemble glacial features], well developed polygons, and has the highest SWIM [Subsurface Water Ice Mapping] score for geomorphic indicators of ice.”
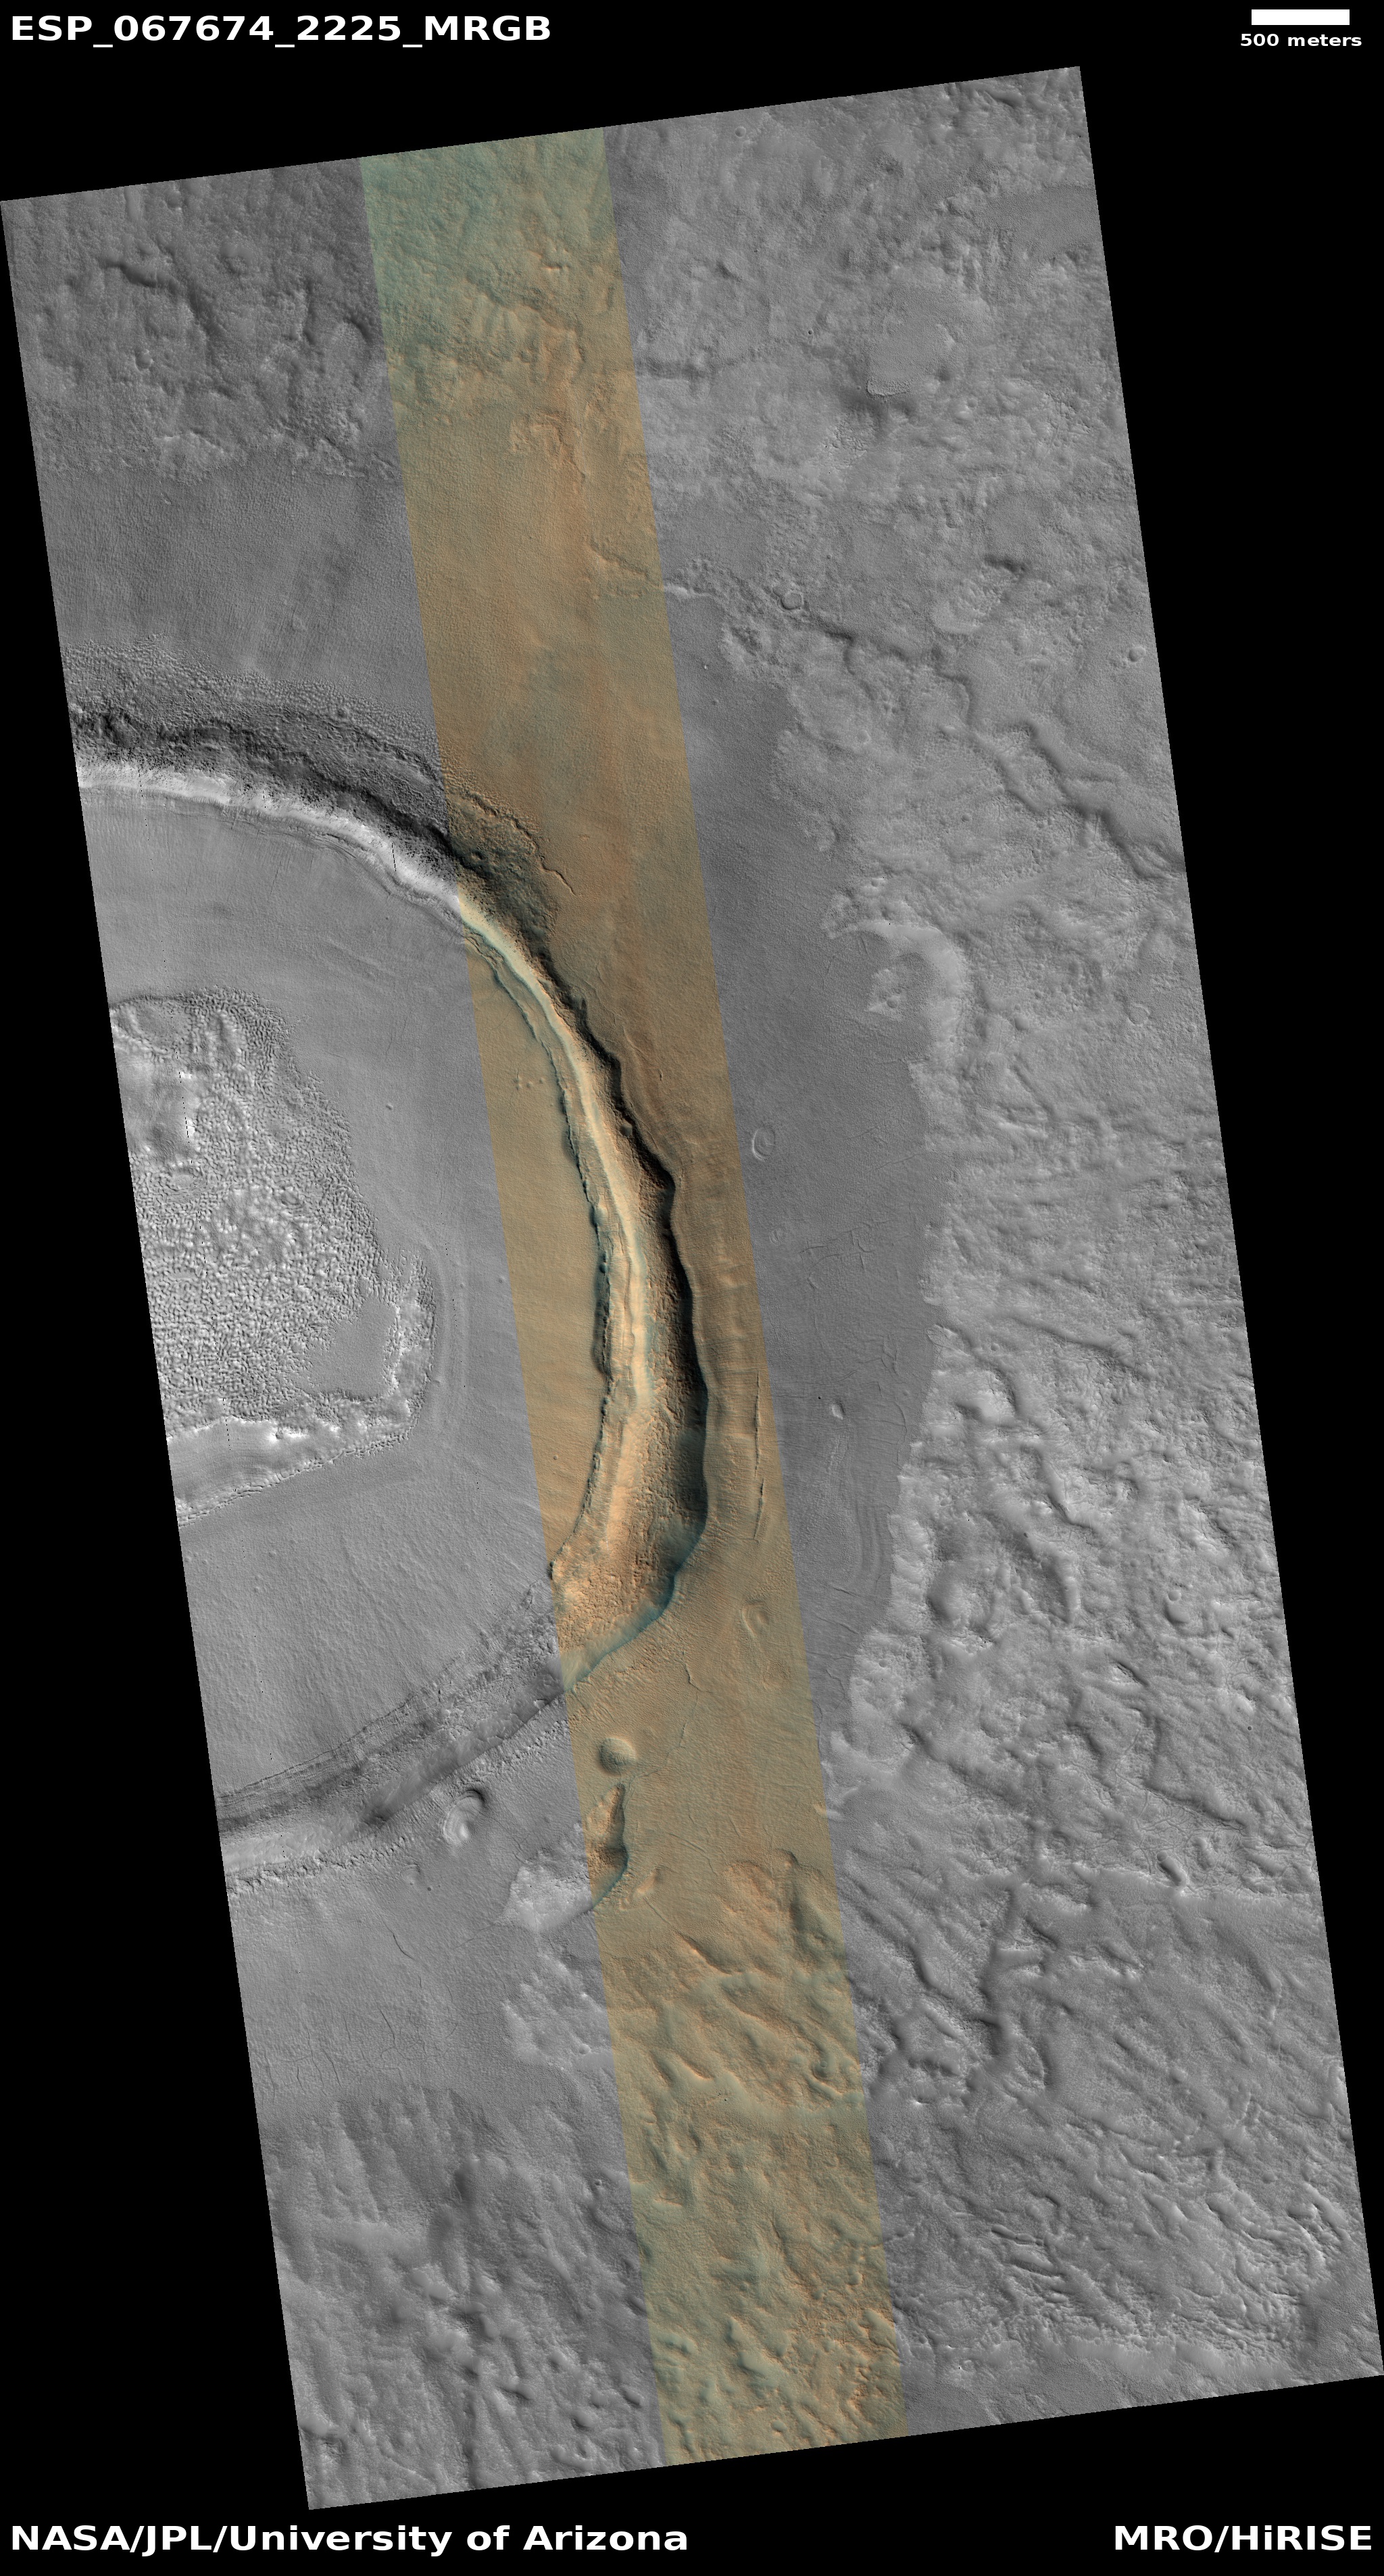
EM 16 “…has a clear association with an LDA with nearby brain terrain and the strongest radar return for shallow ice and the highest combined SWIM score.”
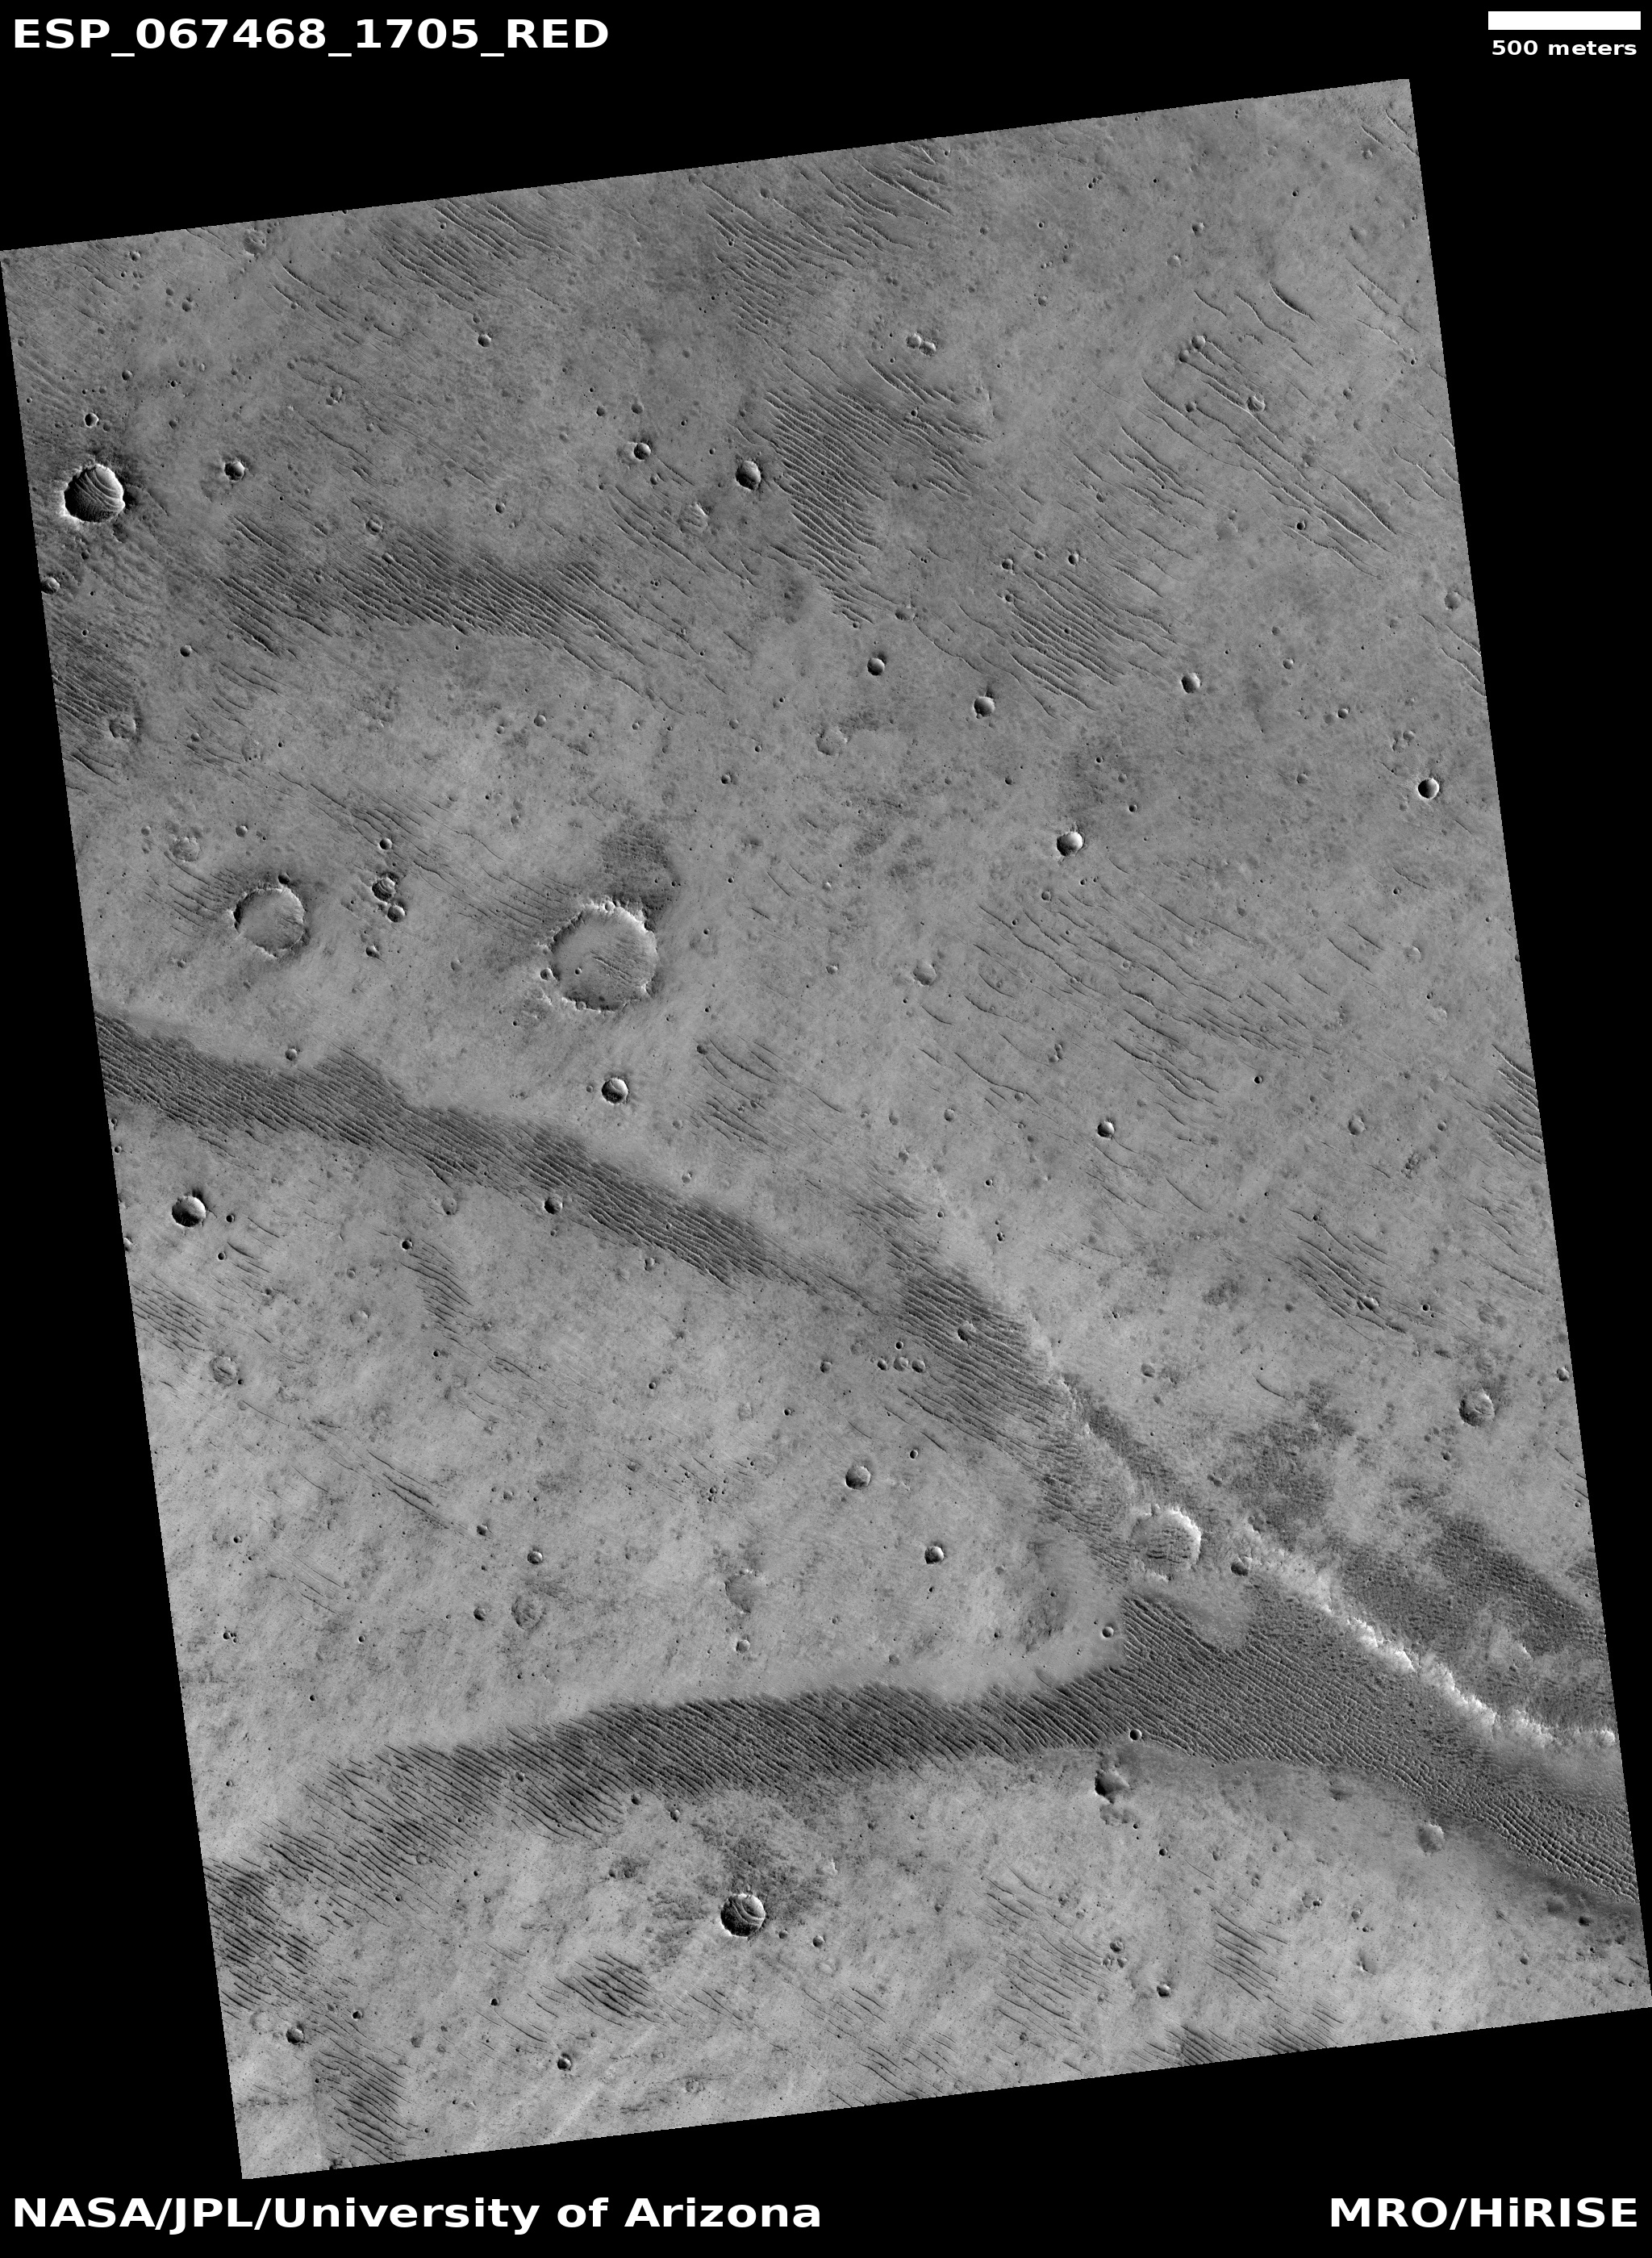
AP1 “…appears to be the safest site and has a moderate combined SWIM score for ice.”
AP9 “…has the thickest ice from radar returns and geomorphology indicating shallow ice. It has the highest combined SWIM score for ice, but appears slightly rocky and rough.”
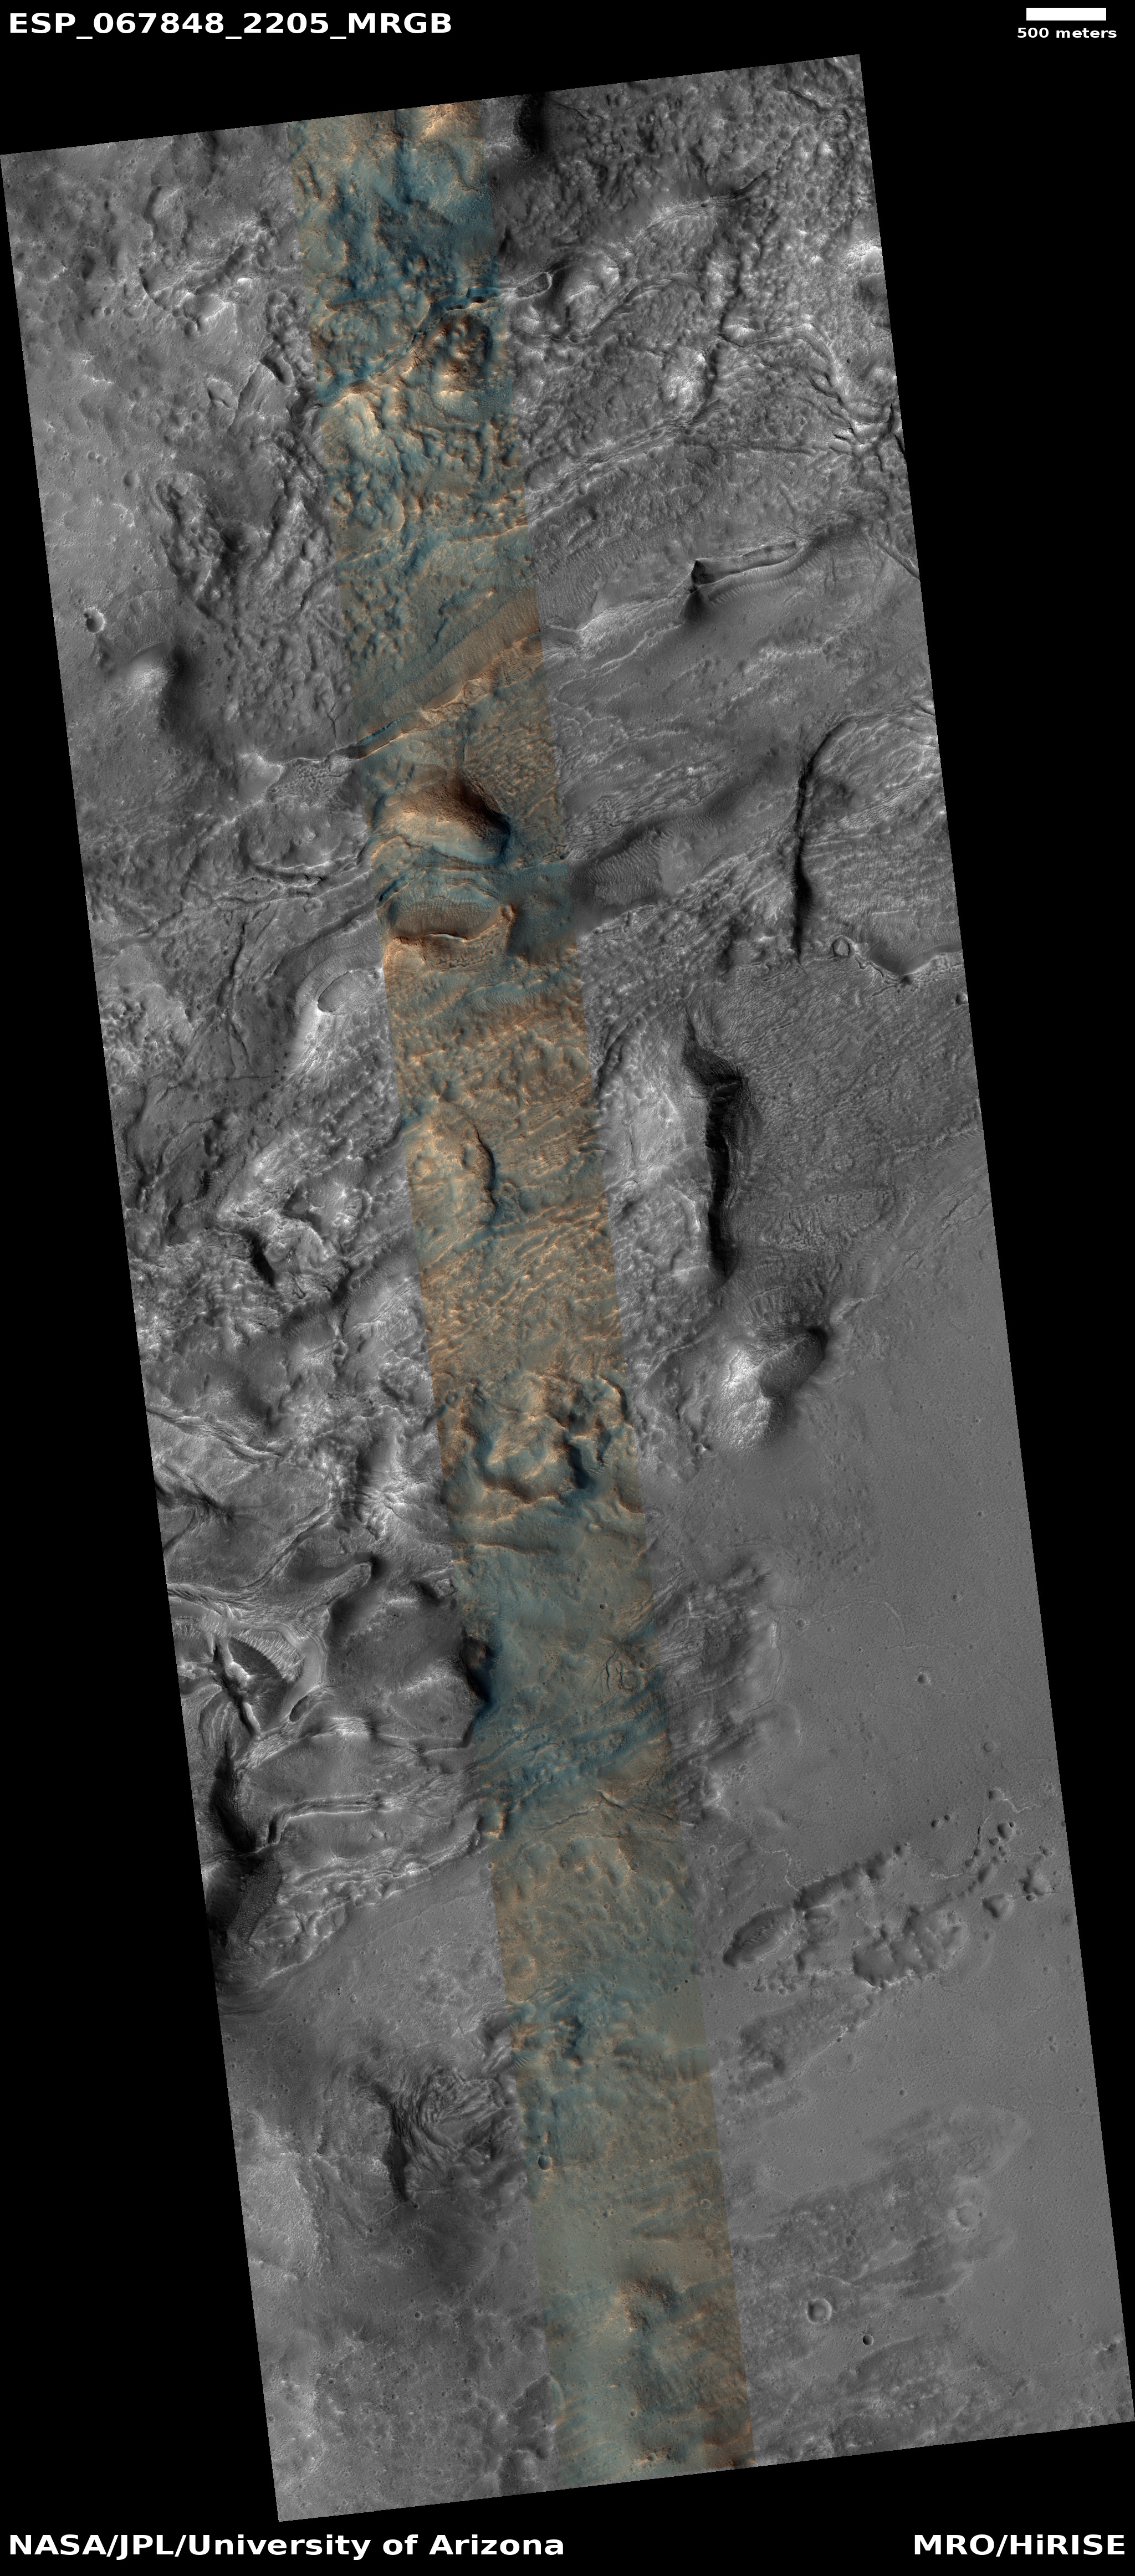
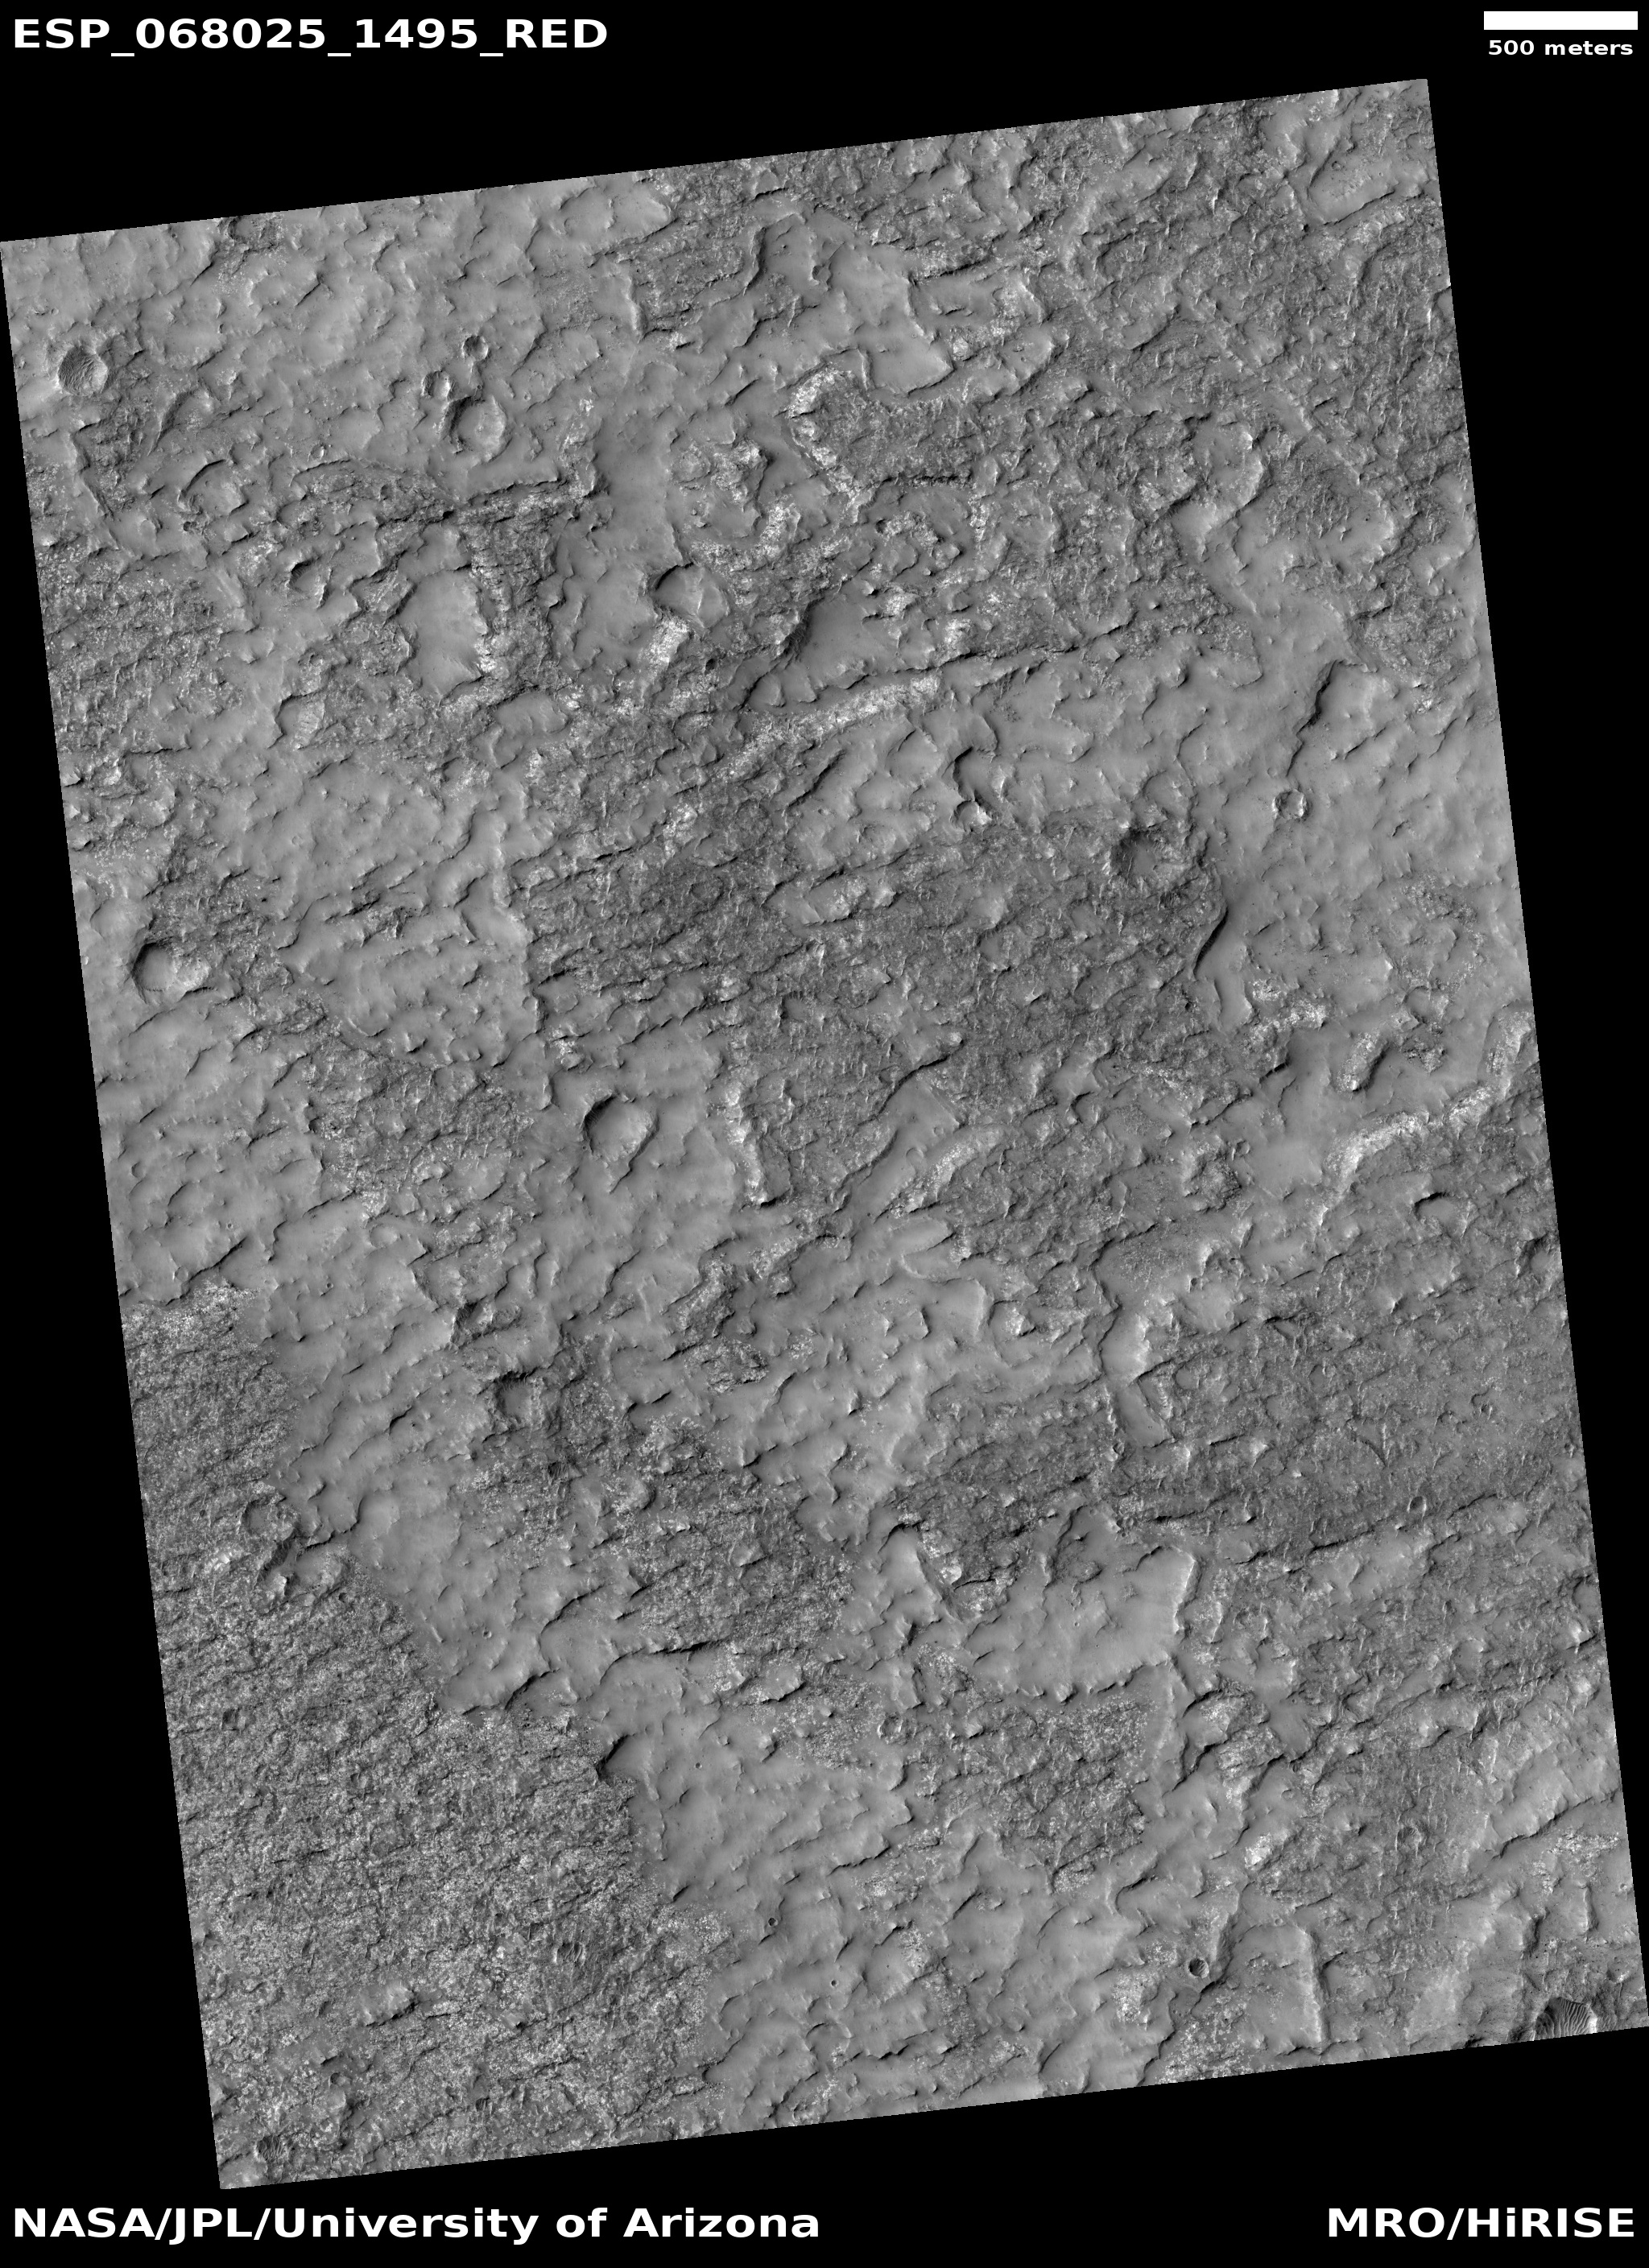
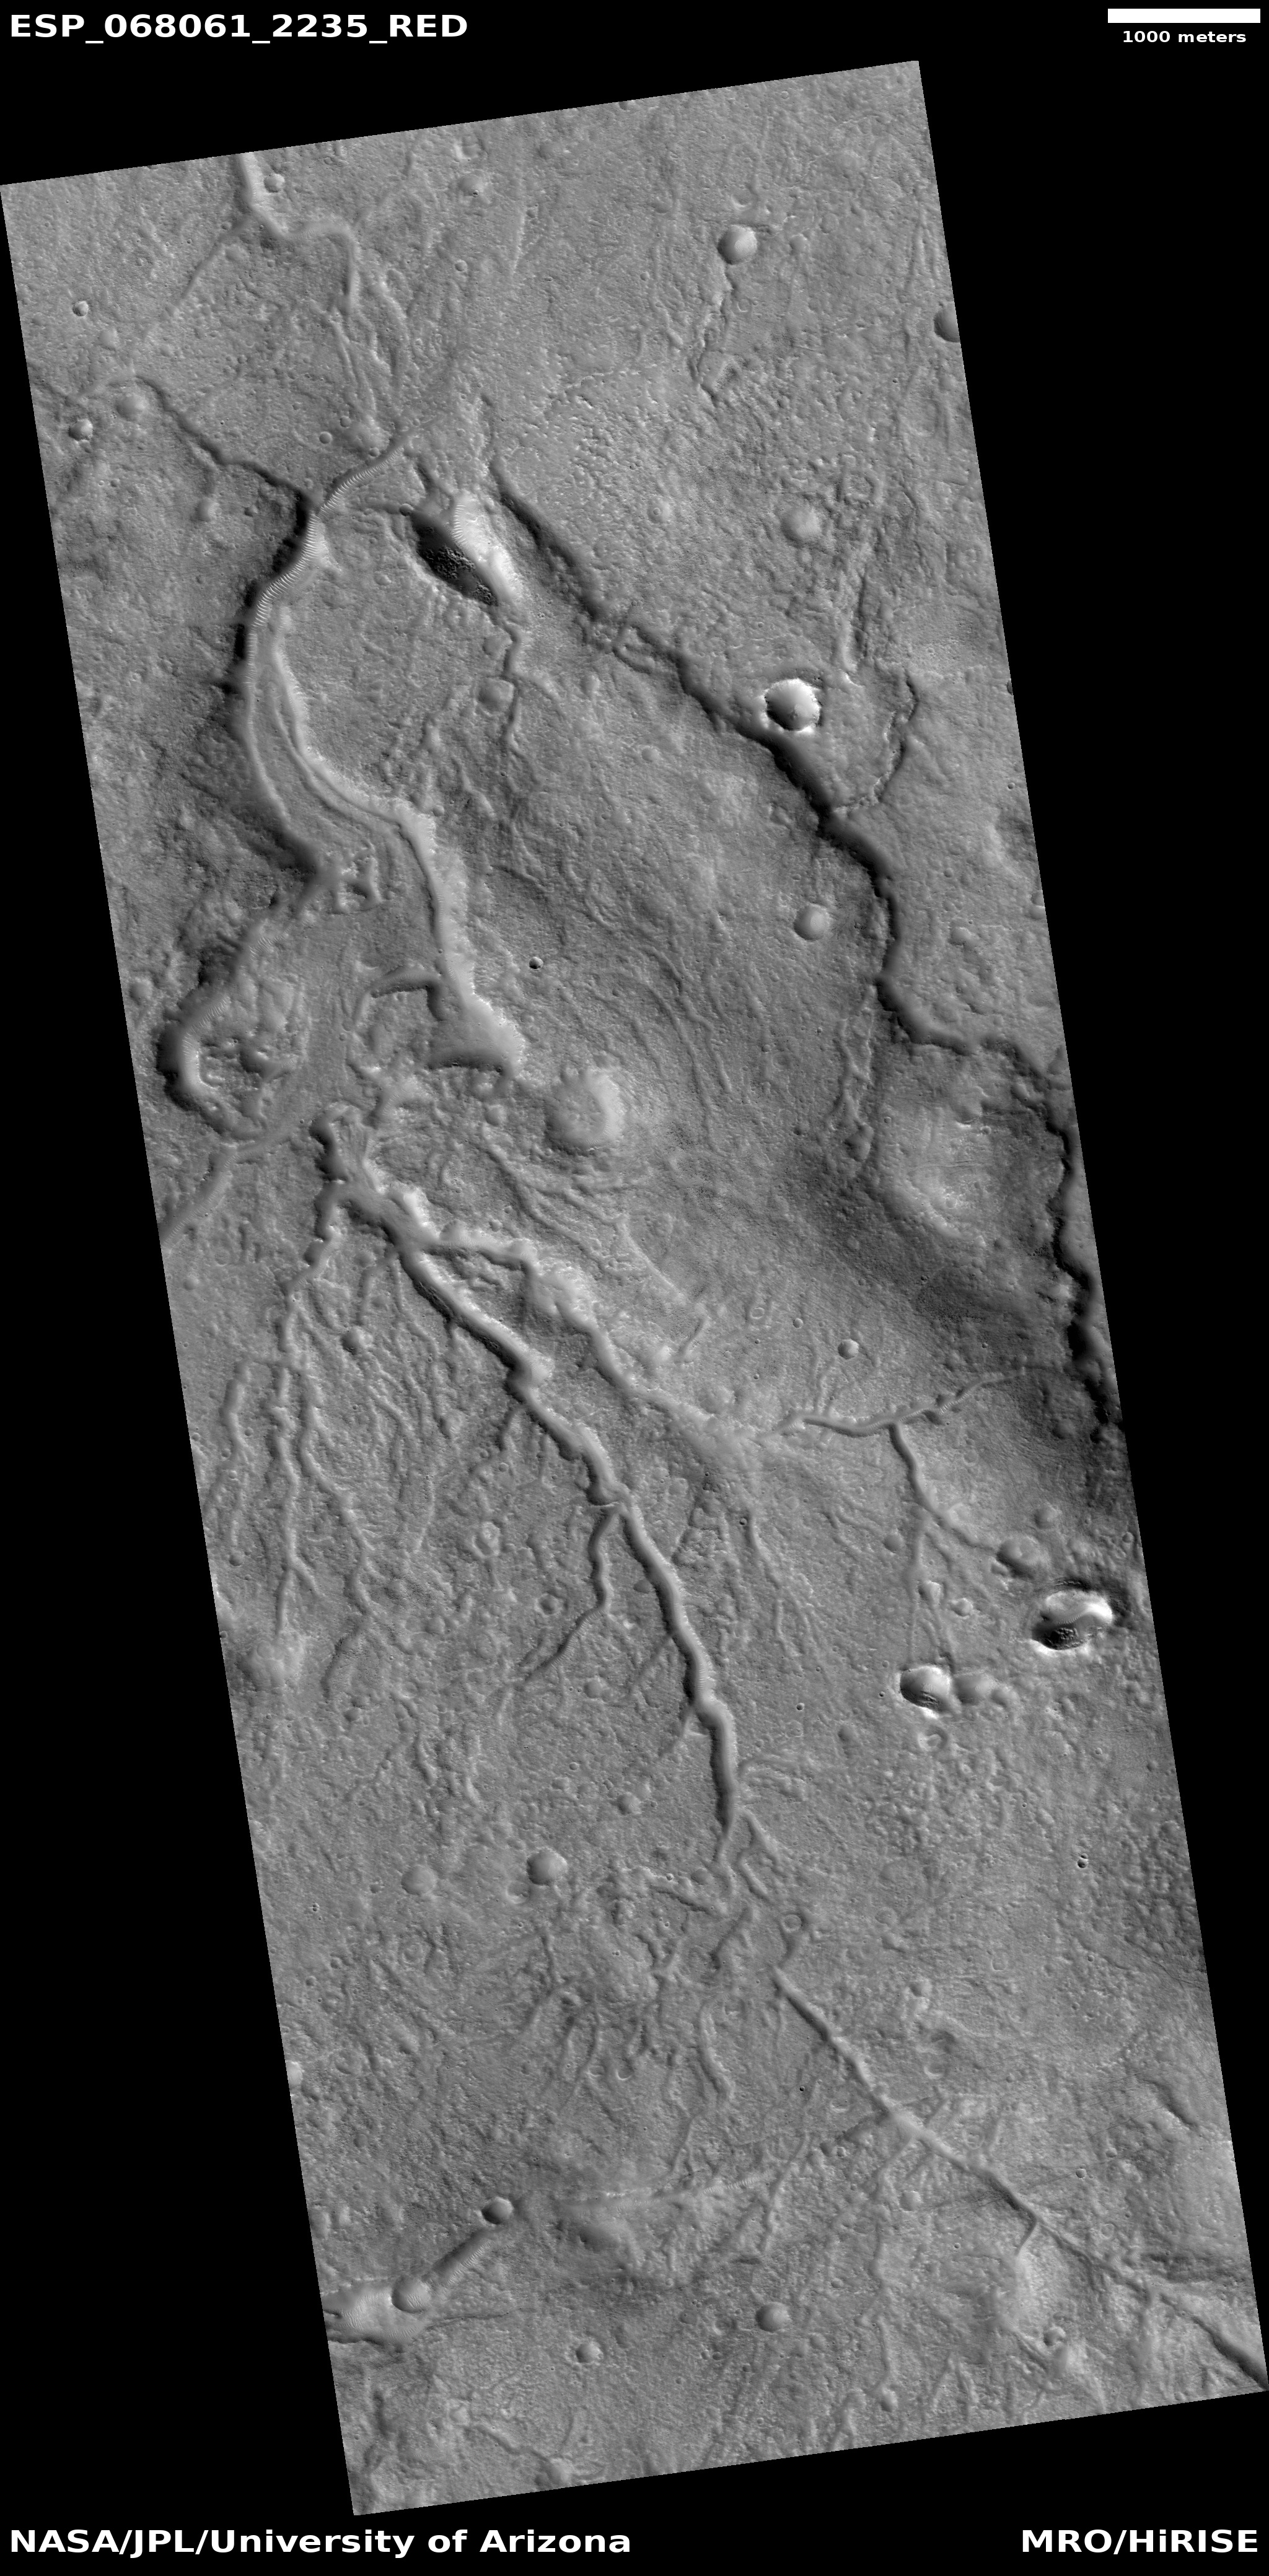
Below the fold are images, rotated, cropped, and reduced to post here, of the four primary landing sites, as well as links to the full images of all four plus the three back-up sites (AP8, EM15, and PM7).
» Read more