Observations of solar flares do not match the standard model used to explain their origin

The uncertainty of science: When scientists carefully compared new and much more precise observations of the Sun’s solar flares with the standard model they have used for decades to explain their origin, they found unexpected differences, suggesting the model is wrong or imcomplete.

In sum, none of the processes simulated in accordance with the model proved capable of explaining the observational data. The conclusion drawn by the researchers was obvious to some extent: the standard model of solar flares needs to be reformulated, as required by the scientific method.

The scientists found that the two sources of each flare brightened at slightly different times. The model said these sources should brighten almost simulatanously, and no version of the model could explain the contradiction.

All this means is that the researchers simply don’t have enough data or understanding of the Sun to formulate a model that can fully explain the process. This study simply demonstrates this, but also provides a guide for soliving the problem.

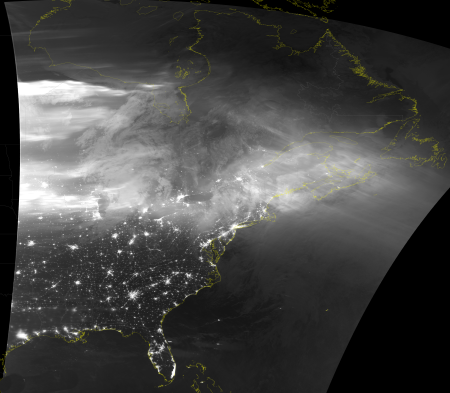
The aurora as seen looking down from space

The aurora over the U.S. on May 11, 2024
Click for original image.

NOAA on May 13, 2024 released a set of eight images taken by its fleet of JPSS weather satellites, showing the strong Aurora Borealis or Northern Lights that were activated over the May 11th weekend due to several very strong solar flares on the Sun and sent a geomagnetic storm at the Earth.

One of those images, reduced to post here, is to the right. You can see the eastern coast of the United States, outlined by city lights, with a band of aurora cutting across the northern half and reaching south below the Great Lakes. The other seven images are available at the link above.

The geomagnetic storm was the strongest produced by the Sun in more than two decades, since 2003. That storm occurred during solar maximum, as did the May 11th this past weekend. However, the Sun experienced another solar maximum in-between, in 2014, which produced few such storms, and none as strong.

I want to add that despite the screams of panic prior to the arrival of this storm, its arrival produced only minor disturbances in the world’s electrical grid, and in fact was proof positive that the many decades of work that electrical companies have devoted to protecting the grid from such storms has paid off. It is very unlikely any major storm from the Sun can harm that grid in the future, unless of course we get lazy and stop maintaining it.

New model predicting solar flares is 56% accurate

The uncertainty of science: Using observations from the space-based Solar Dynamics Observatory (SDO), solar scientists have developed a new model for predicting the biggest solar flares, and have found it to able to predict a big flare about 56% of the time.

Kusano and his team looked at the seven active regions from the last solar cycle that produced the strongest flares on the Earth-facing side of the Sun (they also focused on flares from part of the Sun that is closest to Earth, where magnetic field observations are best). SDO’s observations of the active regions helped them locate the right magnetic boundaries, and calculate instabilities in the hot spots. In the end, their model predicted seven out of nine total flares, with three false positives. The two that the model didn’t account for, Kusano explained, were exceptions to the rest: Unlike the others, the active region they exploded from were much larger, and didn’t produce a coronal mass ejection along with the flare. [emphasis mine]

What they did was apply their model to active regions on the Sun during the last solar maximum to see if it would accurately predict the events we know did happen. The model predicted that big flares would spout from ten of twelve active regions on the Sun during the last solar cycle. In reality, only seven of those twelve active regions produced flares.

The press release minimizes the three false positives, making believe they don’t count in the total. That’s hogwash. The model got it wrong, and so these false positives must be counted just like the two false negatives.

A prediction rate of 56% is barely above random, so this model needs a lot of work. Nonetheless, it is a major step forward, because it is not based on simple statistics — counting the number of big sunspots and the number of big flares and then calculating the percentage that flare — which is how most solar science models are structured, and thus are really meaningless. Instead, this model is based an actual analysis of the behavior of the Sun’s magnetic field in big active regions when solar flares erupt. They are trying to pinpoint the precise conditions that cause the big flares, and appear to be narrowing the conditions successfully.

Largest sunspot in a quarter century spews flares

The largest sunspot seen in about a quarter century produced another powerful X-class flare today, the sixth in less than a week.

This was the sixth X-class solar flare from NOAA 2192, a record for the number of X-class flares generated by a single group so far this solar cycle. It was also the fourth X-class flare since last Friday, continuing a period of intense flaring activity. This sunspot group has grown again a bit, and maintains its magnetic complexity. A degradation of the HF radio-communication was observed over South-America, the Caribbean, and West-Africa.

The last sentence is referring to some radio communications blackouts that have occurred in these areas because of the flares. For more information about the sunspot itself, go here.

And in case you hadn’t noticed, as predicted by many doomsday fear-mongers in the science community, our technological civilization was destroyed by these flares and we are now all dead.

28 solar flares in the past week.

28 solar flares in the past week.

The sun has erupted more than two dozen times over the last week, sending radiation and solar material hurtling through space – and scientists say more eruptions may be coming.

This shouldn’t be unusual. After all, we are technically at solar maximum, the peak of the 11-year cycle of the sun’s activity. But this has been a noticeably mellow solar maximum, with the sun staying fairly quiet throughout the summer. So when our life-giving star suddenly let loose with 24 medium strength M-class solar flares and four significantly stronger X-class flares between Oct. 23 and Oct. 30, it felt like a surprise.

October was one of the most active months for the sun this solar maximum, and I expect the sunspot count for the month to be quite high as well, more than we’ve seen in two years. I shall have that update in just a few days.

All of these active sunspots have been in the sun’s southern hemisphere, which indicates that hemisphere is finally gearing up to flip its magnetic field, something the sun’s northern hemisphere did last year. Once that happens the solar maximum will be officially over and we will head for the next solar minimum.