NASA unwittingly reveals its bankruptcy by its reliance on AI

Uranus as seen by Hubble in 2014 and 2022
Click for original image.

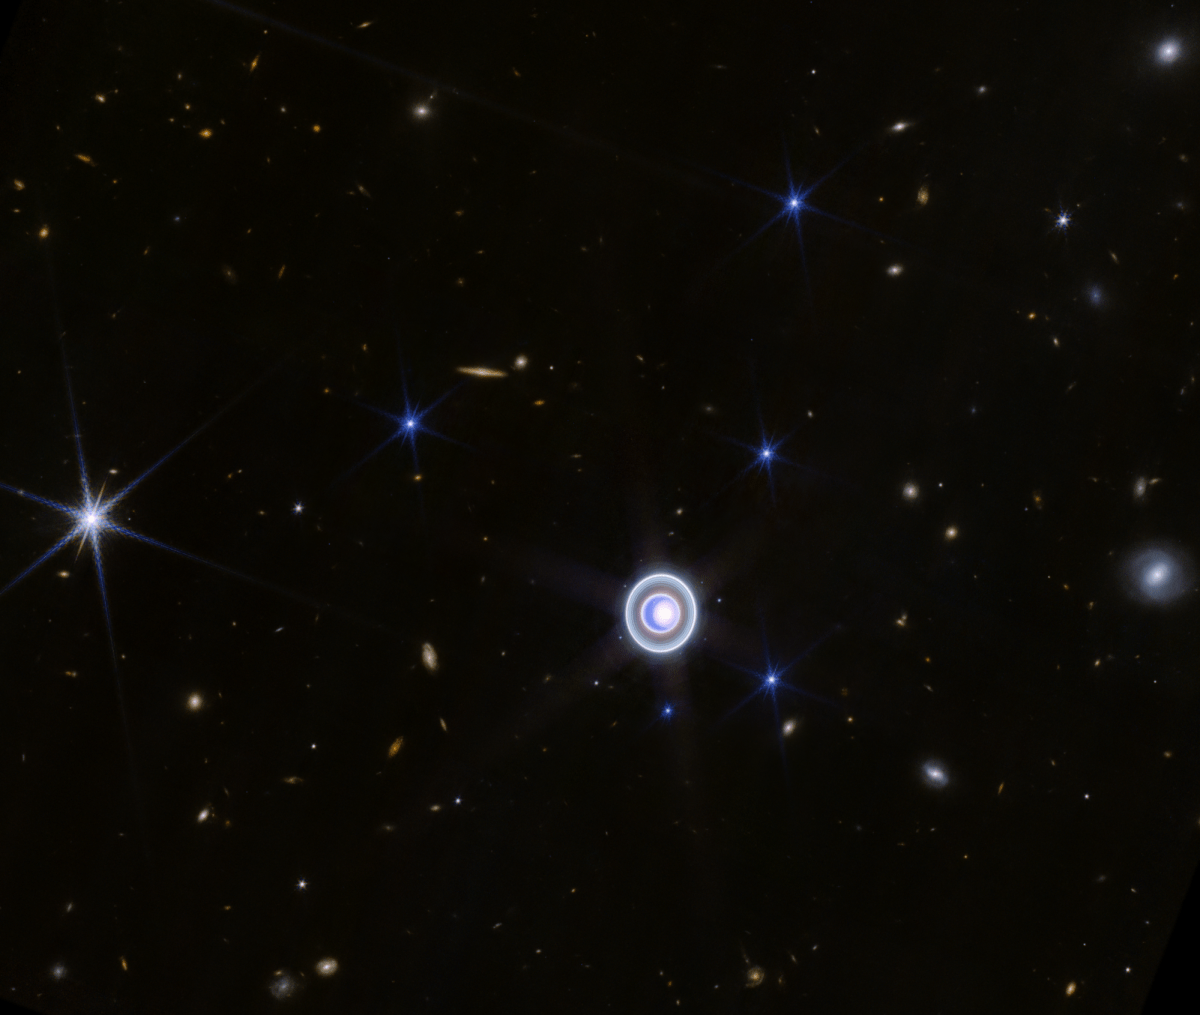
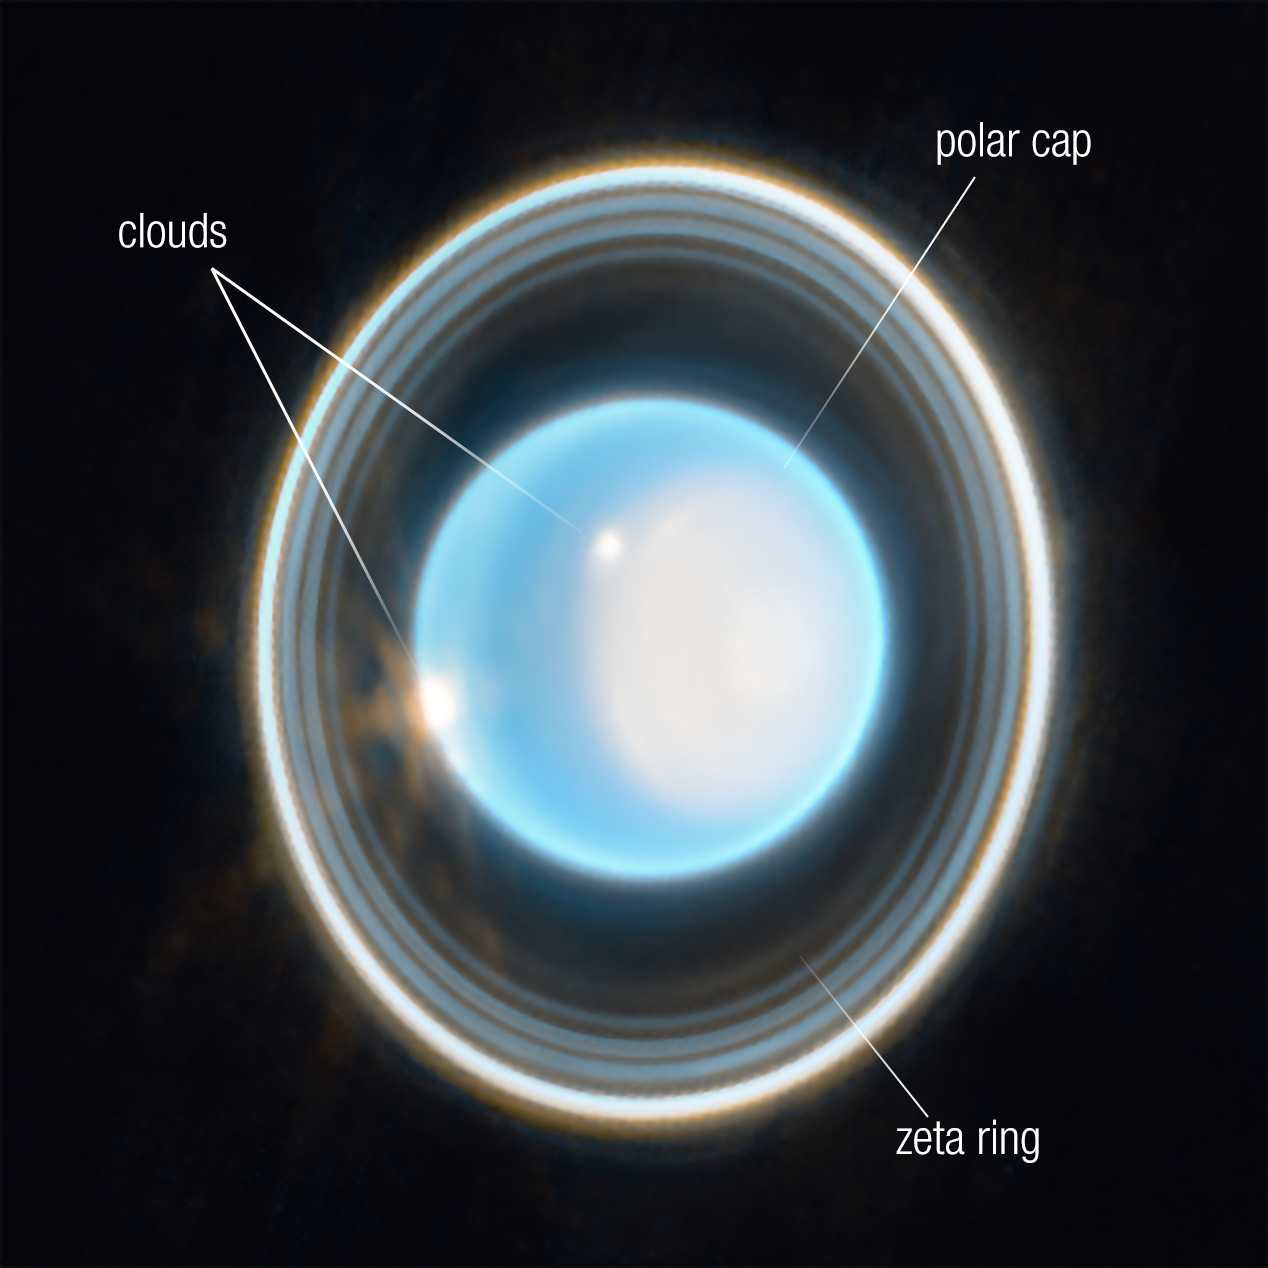
In what appeared to be a totally inexplicable press release today, NASA posted the two pictures of Uranus to the right. The accompanying text was truly puzzling, describing in a somewhat brainless and inaccurate manner what is in the pictures;

Two views of the planet Uranus appear side-by-side for comparison. At the top, left corner of the left image is a two-line label. The top line reads Uranus November 9, 2014. The bottoms line reads HST WFC3/UVIS. At the top, left corner of the right image is the label November 9, 2022. At the left, bottom corner of each image is a small, horizontal, white line. In both panels, over this line is the value 25,400 miles. Below the line is the value 40,800 kilometers. At the top, right corner of the right image are three, colored labels representing the color filters used to make these pictures. Located on three separate lines, these are F467M in blue, F547M in green, and F485M in red. On the bottom, right corner of the right image are compass arrows showing north toward the top and east toward the left. [emphasis mine]

First, the description doesn’t match the pictures precisely, as if whoever wrote it wasn’t looking at these pictures. Second, the description is ridiculously literal, and really provides no information at all. (Consider for example the highlighted sentence. All it is doing is describing a standard scale bar, in the strangest most stupid manner possible.)

I immediately surmised that someone at NASA has decided to use AI to do this work, and AI (in its typical stupid brilliance) provided this worthless text. The unnamed NASA employee — equally as stupid — then posted it without reading it, assuming AI had done his or her job perfectly.

What makes this display of stupidity even worse is that these pictures, and a real press release, were issued back in 2023, when I posted these pictures initially. Does no one at NASA ever bother to read their own press releases?

Apparently not. The advent of AI has now produced human employees at the space agency who read nothing, know nothing, and do nothing. They instead plug stuff into AI and pump it out to the public mindlessly.

No wonder Trump wants to slash NASA’s budget. We certainly ain’t getting our money’s worth from the people that are there.

I also fully expect NASA management to soon deep-six this press release, or to fix it quickly once they read this post.

Twenty years of Hubble data map one long season on Uranus

Uranus over twenty years
Click for original image.

Astronomers using the Hubble Space Telescope multiple times since 2002 have now tracked the changes in its atmosphere during one quarter of its 84 year orbit around the Sun.

The image to the right, reduced and sharpened to post here, shows Hubble’s views across several electromagnetic wavelengths. Uranus’s rotational tilt or inclination is almost 90 degrees, so that it literally rolls on its side as it orbits the Sun. You can see this especially in the bottom two rows. From 2012 to 2022 one pole slowly shifted westward. From the press release:

The Hubble team observed Uranus four times in the 20-year period: in 2002, 2012, 2015, and 2022. They found that, unlike conditions on the gas giants Saturn and Jupiter, methane is not uniformly distributed across Uranus. Instead, it is strongly depleted near the poles. This depletion remained relatively constant over the two decades. However, the aerosol and haze structure changed dramatically, brightening significantly in the northern polar region as the planet approaches its northern summer solstice in 2030.

Since we have not yet observed Uranus over one full year, there are a lot of uncertainties in any conclusions the scientists propose. For one, we don’t know the general atmospheric patterns across all four seasons. For another, any changes seen now might simply be the planet’s weather, random events not directly related to long term climate patterns.

Webb: Carbon monoxide detected on surface of Uranus’s moon Ariel suggests an underground ocean

The best image of Ariel, as seen by Voyager-2, January 24, 1986
Voyager-2’s best image of Ariel during the
January 24, 1986 fly-by. Click for original.

By doing infrared spectroscopy using the Webb Space Telescope, scientists have detected carbon monoxide (CO) and confirmed extensive carbon dioxide (CO2) deposits on the surface of Uranus’s moon Ariel, with the carbon monoxide suggesting the moon has an underground ocean.

Using NASA’s James Webb Space Telescope to collect chemical spectra of the moon and then comparing them with spectra of simulated chemical mixtures in the lab, a research team led by Richard Cartwright from the Johns Hopkins Applied Physics Laboratory (APL) in Laurel, Maryland, found that Ariel has some of the most carbon dioxide-rich deposits in the solar system, adding up to an estimated 10 millimeters (0.4 inches) or more thickness on the moon’s trailing hemisphere. Among those deposits was another puzzling finding: the first clear signals of carbon monoxide.

“It just shouldn’t be there. You’ve got to get down to 30 kelvins [minus 405 degrees Fahrenheit] before carbon monoxide’s stable,” Cartwright said. Ariel’s surface temperature, meanwhile, averages around 65 F warmer. “The carbon monoxide would have to be actively replenished, no question.”

You can read the peer-reviewed paper here [pdf]. Though there are a number of ways in which the carbon monoxide can be replenished, the scientists think it is coming from an underground ocean. From the paper’s abstract:

The evidence for thick CO 2 ice deposits and the possible presence of carbonates on both hemispheres suggests that some carbon oxides could be sourced from Ariel’s interior, with their surface distributions modified by charged particle bombardment, sublimation, and seasonal migration of CO and CO 2 from high to low latitudes.

This theory however has not been confirmed, and the scientists admit it will take a probe making close observations of Ariel to find out for sure.

Hat tip to stringer Jay for this story.

Astronomers discover new moons around Neptune and Uranus

Using a observations over several years from a number of ground-based telescopes, astronomers have now identified two new moons around Neptune and one new moon circling Uranus.

The new Uranian member brings the ice giant planet’s total moon count to 28. At only 8 kilometers, it is probably the smallest of Uranus’ moons. It takes 680 days to orbit the planet. Provisionally named S/2023 U1, the new moon will eventually be named after a character from a Shakespeare play, in keeping with the naming conventions for outer Uranian satellites.

…The brighter Neptune moon now has a provisional designation S/2002 N5, is about 23 kilometers in size, and takes almost 9 years to orbit the ice giant. The fainter Neptune moon has a provisional designation S/2021 N1 and is about 14 kilometers with an orbit of almost 27 years. They will both receive permanent names based on the 50 Nereid sea goddesses in Greek mythology.

The two new Neptune moons raises its moon total now to sixteen. The orbits of all three are tilted and eccentric and far from the planets, strongly suggested they are capture asteroids, not objects formed at the same time as the planet.

Webb takes another infrared image of Uranus

Uranus as seen in infrared by Webb
Click for original image. Go here for Uranus close-up

Astronomers have used the Webb Space Telescope to take another infrared image of Uranus, following up on earlier observations with Webb in April.

The new false-color infrared picture is to the right, cropped, reduced, and enhanced to post here. Though the close-up of Uranus is in the left corner, the overall view is somewhat wider than the image I highlighted previously, showing many background galaxies and at least one star. The star is the spiked bright object on the left. In false color the galaxies all been given an orange tint, while the blue objects near Uranus are its moons. Because Uranus’s rotational tilt is so extreme, 98 degrees compared to Earth’s 23 degrees, its north pole is presently facing the Sun directly, and is in the center here.

One of the most striking of these is the planet’s seasonal north polar cloud cap. Compared to the Webb image from earlier this year, some details of the cap are easier to see in these newer images. These include the bright, white, inner cap and the dark lane in the bottom of the polar cap, toward the lower latitudes. Several bright storms can also be seen near and below the southern border of the polar cap. The number of these storms, and how frequently and where they appear in Uranus’s atmosphere, might be due to a combination of seasonal and meteorological effects.

The polar cap appears to become more prominent when the planet’s pole begins to point toward the Sun, as it approaches solstice and receives more sunlight. Uranus reaches its next solstice in 2028, and astronomers are eager to watch any possible changes in the structure of these features. Webb will help disentangle the seasonal and meteorological effects that influence Uranus’s storms, which is critical to help astronomers understand the planet’s complex atmosphere.

If you want to see what Uranus looks like to our eyes, check out the Hubble pictures taken in 2014 and 2022. Though fewer features are visible in optical wavelengths, those two images showed long term seasonal changes.

Webb has now revealed some shorter term changes.

Webb snaps infrared picture of Uranus

Uranus as seen in the infrared by Webb
Click for original Webb false-color image.

In a follow-up to a recent Hubble Space Telescope optical image of Uranus, scientists have now used the Webb Space Telescope to take a comparable picture in the infrared of the gas giant.

Both pictures are to the right, with the Webb picture at the top including the scientists’ annotations.

On the right side of the planet there’s an area of brightening at the pole facing the Sun, known as a polar cap. This polar cap is unique to Uranus – it seems to appear when the pole enters direct sunlight in the summer and vanish in the fall; these Webb data will help scientists understand the currently mysterious mechanism. Webb revealed a surprising aspect of the polar cap: a subtle enhanced brightening at the center of the cap. The sensitivity and longer wavelengths of Webb’s NIRCam may be why we can see this enhanced Uranus polar feature when it has not been seen as clearly with other powerful telescopes like the Hubble Space Telescope and Keck Observatory.

At the edge of the polar cap lies a bright cloud as well as a few fainter extended features just beyond the cap’s edge, and a second very bright cloud is seen at the planet’s left limb. Such clouds are typical for Uranus in infrared wavelengths, and likely are connected to storm activity.

The Webb image also captures 11 of Uranus’s 13 rings, which appear much brighter in the infrared than in the optical.

Unlike all other planets in the solar system, Uranus’s rotation is tilted so much that it actually rolls as it orbits the Sun, a motion that is obvious by comparing these pictures with Hubble’s 2014 optical picture.

Hubble spots long term seasonal changes on Uranus

Uranus as seen by Hubble in 2014 and 2022
Click for original image.

Using images of Uranus taken eight years apart by the Hubble Space Telescope, astronomers have detected significant seasonal changes in the atmosphere of the gas giant, caused by its unusual sideways rotation.

The two pictures to the left, realigned and reduced to post here, show the changes. If you look closely you can see the planet’s ring system and its shift to almost face on at present.

[top] — This is a Hubble view of Uranus taken in 2014, seven years after northern spring equinox when the Sun was shining directly over the planet’s equator, and shows one of the first images from the OPAL program. Multiple storms with methane ice-crystal clouds appear at mid-northern latitudes above the planet’s cyan-tinted lower atmosphere. Hubble photographed the ring system edge-on in 2007, but the rings are seen starting to open up seven years later in this view. At this time, the planet had multiple small storms and even some faint cloud bands.

[bottom] — As seen in 2022, Uranus’ north pole shows a thickened photochemical haze that looks similar to the smog over cities. Several little storms can be seen near the edge of the polar haze boundary. Hubble has been tracking the size and brightness of the north polar cap and it continues to get brighter year after year. Astronomers are disentangling multiple effects – from atmospheric circulation, particle properties, and chemical processes – that control how the atmospheric polar cap changes with the seasons. At the Uranian equinox in 2007, neither pole was particularly bright.

To really understand the long term climate of Uranus will likely take centuries, since its year lasts 84 Earth years. Since the beginning of space exploration, we have only had now about forty years of good imagery of the planet, and even that has been sporadic and very incomplete.

Hubble’s 2021 survey of the outer solar system

Jupiter in 2021 by Hubble
Click for full Jupiter image.

Saturn in 2021 by Hubble
Click for full Saturn image.

Uranus in 2021 by Hubble
Click for full Uranus image.

Neptune in 2021 by Hubble
Click for full Neptune image.

NASA today released the annual survey of images taken each year by the Hubble Space Telescope of the large planets that comprise the outer solar system, Jupiter, Saturn, Uranus, and Neptune.

These Hubble images are part of yearly maps of each planet taken as part of the Outer Planets Atmospheres Legacy program, or OPAL. The program provides annual, global views of the outer planets to look for changes in their storms, winds, and clouds. Hubble’s longevity, and unique vantage point, has given astronomers a unique chance to check in on the outer planets on a yearly basis. Knowledge from the OPAL program can also be extended far beyond our own solar system in the study of atmospheres of planets that orbit stars other than our Sun.

The four photos, all either cropped or reduced slightly to post here, are to the right. Each shows some changes in these planets since the previous survey images the year before.

On Jupiter for example the equatorial region shows several new storms, with that band remaining a deep orange color longer than expected.

On Saturn the various bands have continued to show the frequent and extreme color changes that the telescope has detected since it began these survey images back in the 1990s.

The photo of Uranus meanwhile looks at the gas giant’s northern polar regions, where it is presently spring. The increased sunlight and ultraviolet radiation has thus caused the upper atmosphere at the pole to brighten. The photo also confirms that the size of this bright “polar hood” continues to remain the same, never extending beyond the 43 degree latitude where scientists suspect a jet streams acts to constrain it.

The image of Neptune, the farthest and thus hardest planet for Hubble to see, found that the dark spot in the planet’s northern hemisphere appears to have stopped moving south and now appears to be heading north. Also,

In 2021, there are few bright clouds on Neptune, and its distinct blue with a singular large dark spot is very reminiscent of what Voyager 2 saw in 1989.

X-rays from Uranus detected for the 1st time

Composite Uranus image of X-ray and optical data

Astronomers using the Chandra X-ray Observatory in orbit have for the first time detected X-rays coming from the planet Uranus.

In the new study, researchers used Chandra observations taken in Uranus in 2002 and then again in 2017. They saw a clear detection of X-rays from the first observation, just analyzed recently, and a possible flare of X-rays in those obtained fifteen years later. The main graphic [posted to the right] shows a Chandra X-ray image of Uranus from 2002 (in pink) superimposed on an optical image from the Keck-I Telescope obtained in a separate study in 2004. The latter shows the planet at approximately the same orientation as it was during the 2002 Chandra observations.

What could cause Uranus to emit X-rays? The answer: mainly the Sun. Astronomers have observed that both Jupiter and Saturn scatter X-ray light given off by the Sun, similar to how Earth’s atmosphere scatters the Sun’s light. While the authors of the new Uranus study initially expected that most of the X-rays detected would also be from scattering, there are tantalizing hints that at least one other source of X-rays is present.

One explanation could be that the X-rays could be coming from Uranus’s rings, as such X-rays do from Saturn. This is not confirmed as yet however. More data will be needed.

The make-up and temperature of Uranus’s rings

The rings of Uranus

New radio images taken by the ground-based telescopes by the ALMA and VLT telescopes in Chile have allowed scientists to better determine the make-up and temperature of the rings of Uranus.

The image above is from their paper. From the caption:

Images of the Uranian ring system at 3.1 mm (ALMA Band 3; 97.5 GHz), 2.1 mm (ALMA Band 4; 144 GHz), 1.3 mm (ALMA Band 6; 233 GHz), and 18.7 μm (VLT VISIR; 100 THz)…The planet itself is masked since it is very bright compared to the rings.

From the article above:

The new images taken by the Atacama Large Millimeter/submillimeter Array (ALMA) and the Very Large Telescope (VLT) allowed the team for the first time to measure the temperature of the rings: a cool 77 Kelvin, or 77 degrees above absolute zero — the boiling temperature of liquid nitrogen and equivalent to 320 degrees below zero Fahrenheit.

The observations also confirm that Uranus’s brightest and densest ring, called the epsilon ring, differs from the other known ring systems within our solar system, in particular the spectacularly beautiful rings of Saturn.

“Saturn’s mainly icy rings are broad, bright and have a range of particle sizes, from micron-sized dust in the innermost D ring, to tens of meters in size in the main rings,” said Imke de Pater, a UC Berkeley professor of astronomy. “The small end is missing in the main rings of Uranus; the brightest ring, epsilon, is composed of golf ball-sized and larger rocks.” [emphasis mine]

The mystery is why this ring has no dust, something not seen with any other ring system in the solar system, including the inner rings of Uranus itself..

New Hubble images of Uranus and Neptune

Uranus (top) and Neptune

The Hubble Space Telescope’s new annual images of Uranus (top) and Neptune (bottom) has revealed new atmospheric features for both, a giant north pole cloud cap on Uranus and a new dark storm developing on Neptune.

For Neptune:

The new Hubble view of Neptune shows the dark storm, seen at top center. Appearing during the planet’s southern summer, the feature is the fourth and latest mysterious dark vortex captured by Hubble since 1993. Two other dark storms were discovered by the Voyager 2 spacecraft in 1989 as it flew by the remote planet. Since then, only Hubble has had the sensitivity in blue light to track these elusive features, which have appeared and faded quickly. A study led by University of California, Berkeley, undergraduate student Andrew Hsu estimated that the dark spots appear every four to six years at different latitudes and disappear after about two years.

Hubble uncovered the latest storm in September 2018 in Neptune’s northern hemisphere. The feature is roughly 6,800 miles across.

For Uranus:

The snapshot of Uranus, like the image of Neptune, reveals a dominant feature: a vast bright cloud cap across the north pole.

Scientists believe this feature is a result of Uranus’ unique rotation. Unlike every other planet in the solar system, Uranus is tipped over almost onto its side. Because of this extreme tilt, during the planet’s summer the Sun shines almost directly onto the north pole and never sets. Uranus is now approaching the middle of its summer season, and the polar-cap region is becoming more prominent. This polar hood may have formed by seasonal changes in atmospheric flow.

The images are part of an annual program that monitors both planets with images every year when the Earth is best placed to view them. This allows scientists to track atmospheric changes over time.

The sharpness of both images matches that of previous Hubble images, so these photographs do not show any decline in the telescope’s image capability. However, when they lose that next gyroscope and shift to one gyroscope mode, I believe it will be very difficult to get images even this sharp of the outer planets. In fact, I suspect this monitoring program will likely have to end, or will be badly crippled.

Uranus’s magnetic field switches on and off daily

Using data from the Voyager 2 flyby of Uranus in 1986, scientists now think that the gas giant’s magnetic field switches on and off each day as the planet rotates.

Uranus’s magnetosphere, in contrast [to Earth], exhibits precise regularity in its mode changes. This, say the researchers, is because it lies at an angle of roughly 60 degrees to the planet’s spin axis, causing its interaction with incoming solar winds to vary dramatically during the 17 hours it takes for a full rotation. “Uranus is a geometric nightmare,” says Paty.

“The magnetic field tumbles very fast, like a child cartwheeling down a hill head over heels. When the magnetised solar wind meets this tumbling field in the right way, it can reconnect and Uranus’s magnetosphere goes from open to closed to open on a daily basis.”

The researchers suggest the robust and regular changes to the magnetosphere may mean that the icy planet has spectacular auroras across its breadth every day.