What the Milky Way would look like if it was presently a star forming powerhouse

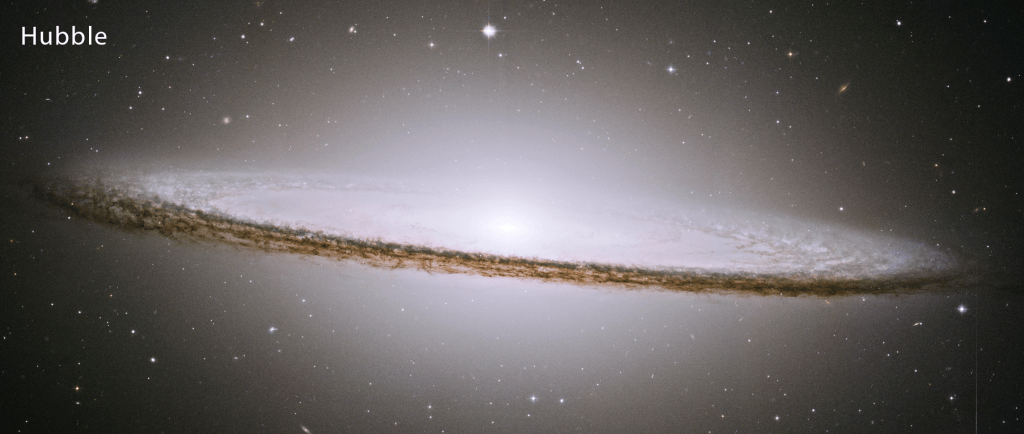
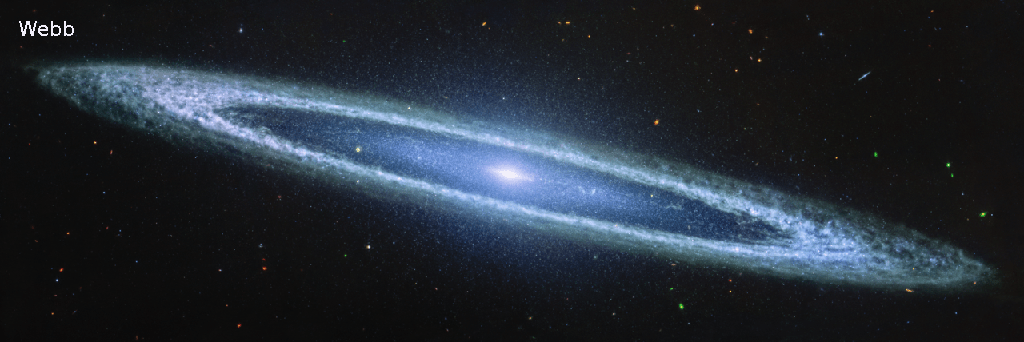
A galaxy as seen by Hubble and Webb
For the original images go here and here.

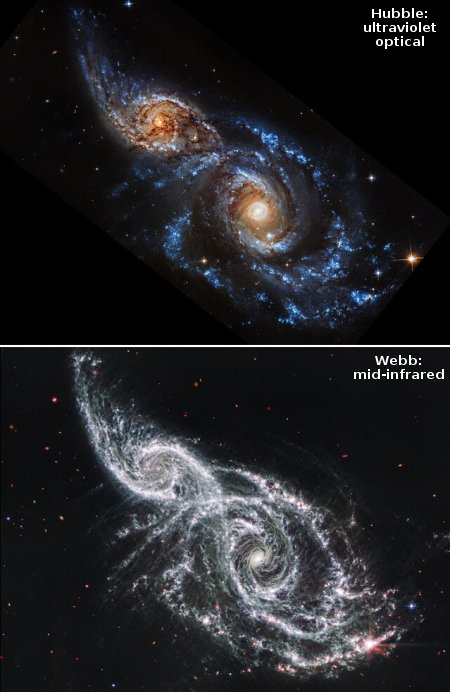
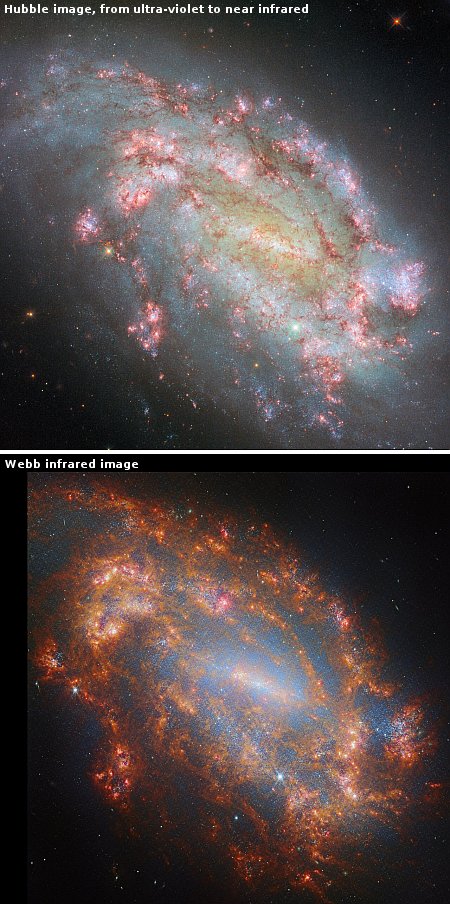
Cool image time! The two pictures to the right, taken respectively by the Hubble and Webb space telescopes of the same galaxy, shows us many different features of a barred galaxy, located about 35 million light years away. From the caption for the Hubble image:

This picture is composed of a whopping ten different images taken by the Hubble Space Telescope, each filtered to collect light from a specific wavelength or range of wavelengths. It spans Hubble’s sensitivity to light, from ultraviolet around 275 nanometres through blue, green and red to near-infrared at 1600 nanometres. This allows information about many different astrophysical processes in the galaxy to be recorded: a notable example is the red 656-nanometre filter used here. Hydrogen atoms which get ionised can emit light at this particular wavelength, called H-alpha emission. New stars forming in a molecular cloud, made mostly of hydrogen gas, emit copious amounts of ultraviolet light which is absorbed by the cloud, but which ionises it and causes it to glow with this H-alpha light.

Therefore, filtering to detect only this light provides a reliable means to detect areas of star formation (called H II regions), shown in this image by the bright red and pink colours of the blossoming patches filling NGC 1559’s spiral arms.

The Z-shaped blue indicates the stars and its most distinct spiral arms. Astronomers presently believe that the Milky Way is also a barred spiral like this, though its star-forming regions are thought to be far less extensive and distinct.

The Webb infrared image matches the Hubble data, with the false color blue indicating the near-infrared and the false color red the mid-infrared. As with the Hubble picture, the red indicates the galaxy’s extensive star forming regions.

Webb finds six exoplanets, all flying in interstellar space without a star

Astronomers using the Webb Space Telescope have discovered six different planets ranging in mass 5 to 10 times that of Jupiter, all unattached to any star or solar system.

The most intriguing of the starless objects is also the lightest, having an estimated mass of five Jupiters (about 1,600 Earths). The presence of a dusty disk means the object almost certainly formed like a star, as space dust generally spins around a central object in the early stages of star formation, said Langeveld, a postdoctoral researcher in Jayawardhana’s group.

All of these starless planets likely formed like this one, coalescing like a star does but unlike a star never having enough mass to ignite.

The astronomers are next going to attempt to detect the atmosphere’s of these rogue exoplanets, though it is not clear exactly how they will do this unless one of the exoplanets just happened to transit across a more distant star, something that simply does not happen very often.

New data continues to refine the margin of error for the Hubble constant

The uncertainty of science: New data using the Webb Space Telescope’s spectroscopic capabilities has provided a more refined measure of the expansion rate of the universe, dubbed the Hubble constant.

According to previous research, that rate could be anywhere from 67.4 to 73.2 kilometers per second per megaparsecs, depending on whether you rely on data from the Planck orbiter or that of the Hubble Space Telescope. Though this difference appears reasonable considering the uncertainties and assumptions that go into research that determines both numbers, astronomers have been unhappy with the difference. The numbers should match and they don’t.

Now new data from Webb suggests this difference really is nothing more than the margin of error caused by the many uncertainties and assumptions involved. That new Webb data measured the Hubble constant using three different methods, all similar to that used by Hubble, and came up with 67.85, 67.96, and 72.04, all in the middle of the previous two numbers from Hubble and Planck.

In other words, all the data is beginning to fall within this margin of error.

Astronomers are without doubt still going to argue about this, but it does appear that the research is beginning to coalesce around an approximate number. More important, in terms of cosmology these results confirm the theory that the expansion of the universe is accelerating (dubbed “dark energy” simply because it needs a name), since they confirm the method used to measure that expansion rate in the very distant universe.

Keep your minds open however. There remain many questions and uncertainties with all these conclusions. Nothing is settled, nor will it be likely for decades if not centuries.

Webb data suggests the possibility of ice and hydrated minerals on surface of Psyche

Using the Webb Space Telescope, astronomers have detected evidence of hydrated minerals and even possibly a very tiny amount of water ice on the surface of the metal asteroid Psyche.

The Webb data point to hydroxyl and perhaps water on Psyche’s surface. The hydrated minerals could result from external sources, including impactors. If the hydration is native or endogenous, then Psyche may have a different evolutionary history than current models suggest. “Asteroids are leftovers from the planetary formation process, so their compositions vary depending on where they formed in the solar nebula,” said SwRI’s Dr. Anicia Arredondo, another co-author. “Hydration that is endogenous could suggest that Psyche is not the remnant core of a protoplanet. Instead, it could suggest that Psyche originated beyond the ‘snow line,’ the minimum distance from the Sun where protoplanetary disc temperatures are low enough for volatile compounds to condense into solids, before migrating to the outer main belt.”

However, the paper found the variability in the strength of the hydration features across the observations implies a heterogeneous distribution of hydrated minerals. This variability suggests a complex surface history that could be explained by impacts from carbonaceous chondrite asteroids thought to be very hydrated.

You can read the research paper here [pdf]. The actual amount of water possible is at most 39 parts per million and is also an order of magnitude lower than that found on the Moon, which strongly suggests that it comes from outside sources, such as impacts from other asteroids, not from the inherent geological history of Psyche itself.

The uncertainties of this research, which are large, which should be resolved when the probe Psyche, launched last year, reaches the asteroid Psyche in August 2029.

Webb: Carbon monoxide detected on surface of Uranus’s moon Ariel suggests an underground ocean

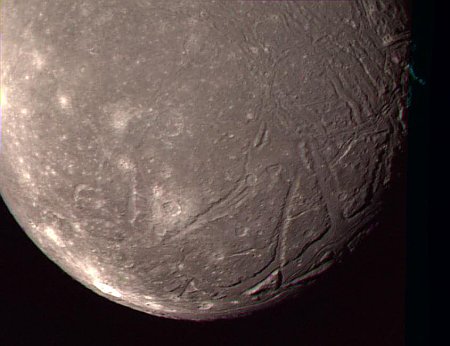
The best image of Ariel, as seen by Voyager-2, January 24, 1986
Voyager-2’s best image of Ariel during the
January 24, 1986 fly-by. Click for original.

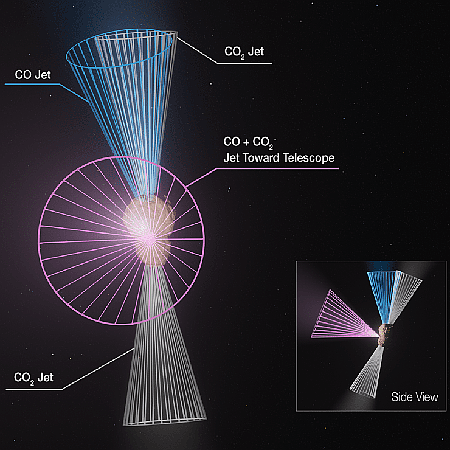
By doing infrared spectroscopy using the Webb Space Telescope, scientists have detected carbon monoxide (CO) and confirmed extensive carbon dioxide (CO2) deposits on the surface of Uranus’s moon Ariel, with the carbon monoxide suggesting the moon has an underground ocean.

Using NASA’s James Webb Space Telescope to collect chemical spectra of the moon and then comparing them with spectra of simulated chemical mixtures in the lab, a research team led by Richard Cartwright from the Johns Hopkins Applied Physics Laboratory (APL) in Laurel, Maryland, found that Ariel has some of the most carbon dioxide-rich deposits in the solar system, adding up to an estimated 10 millimeters (0.4 inches) or more thickness on the moon’s trailing hemisphere. Among those deposits was another puzzling finding: the first clear signals of carbon monoxide.

“It just shouldn’t be there. You’ve got to get down to 30 kelvins [minus 405 degrees Fahrenheit] before carbon monoxide’s stable,” Cartwright said. Ariel’s surface temperature, meanwhile, averages around 65 F warmer. “The carbon monoxide would have to be actively replenished, no question.”

You can read the peer-reviewed paper here [pdf]. Though there are a number of ways in which the carbon monoxide can be replenished, the scientists think it is coming from an underground ocean. From the paper’s abstract:

The evidence for thick CO 2 ice deposits and the possible presence of carbonates on both hemispheres suggests that some carbon oxides could be sourced from Ariel’s interior, with their surface distributions modified by charged particle bombardment, sublimation, and seasonal migration of CO and CO 2 from high to low latitudes.

This theory however has not been confirmed, and the scientists admit it will take a probe making close observations of Ariel to find out for sure.

Hat tip to stringer Jay for this story.

Webb takes infrared image of exoplanet

A Jupiter-sized exoplanet imaged by Webb
Click for original image.

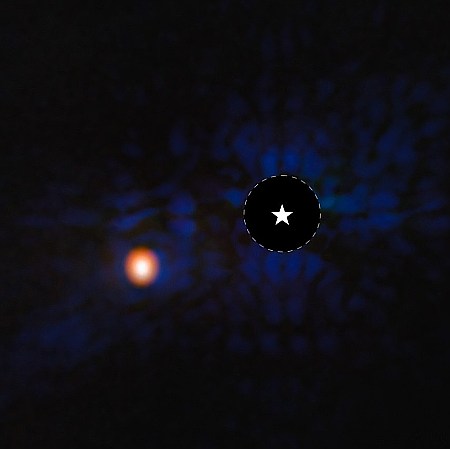
Cool image time! Using the Webb Space Telescope, scientists have taken an infrared false color image of a multi-Jupiter-sized exoplanet located only twelve light years away and orbiting the K-type star Epsilon Indi A.

That picture, cropped, reduced, and sharpened to post here, is to the right. The light of the star, indicated by the star symbol, has been blocked by Webb’s coronagraph, the size of which is shown by the dashed circle. The exoplanet is the orange blob to the left.

[This exoplanet] is one of the coldest exoplanets to be directly detected, with an estimated temperature of 35 degrees Fahrenheit (2 degrees Celsius) — colder than any other imaged planet beyond our solar system, and colder than all but one free-floating brown dwarf. The planet is only around 180 degrees Fahrenheit (100 degrees Celsius) warmer than gas giants in our solar system. This provides a rare opportunity for astronomers to study the atmospheric composition of true solar system analogs.

The data also revealed that the exoplanet is twice as massive as expected and has a slightly different orbit than expected based on previous less precise data.

Webb infrared spectroscopy detects differences between morning and evening on tidally-locked exoplanet

Webb spectroscopic data
Click for original image.

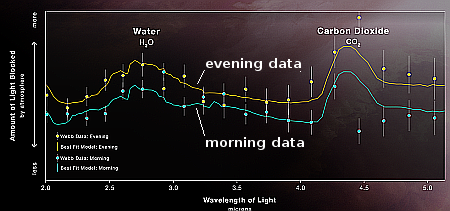
Astronomers using Webb Space Telescope’s infrared spectroscopy have now detected distinct differences in the morning and evening atmosphere of a tidally-locked gas giant exoplanet.

The graph, cropped, reduced, sharpened, annotated to post here, shows the differences. From the caption:

Researchers using NASA’s James Webb Space Telescope have finally confirmed what models have previously predicted: An exoplanet has differences between its eternal morning and eternal evening atmosphere. WASP-39 b, a giant planet with a diameter 1.3 times greater than Jupiter, but similar mass to Saturn that orbits a star about 700 light-years away from Earth, is tidally locked to its parent star. This means it has a constant dayside and a constant nightside—one side of the planet is always exposed to its star, while the other is always shrouded in darkness.

Using Webb’s NIRSpec (Near-Infrared Spectrograph), astronomers confirmed a temperature difference between the eternal morning and eternal evening on WASP-39 b, with the evening appearing hotter by roughly 300 Fahrenheit degrees (about 200 Celsius degrees). They also found evidence for different cloud cover, with the forever morning portion of the planet being likely cloudier than the evening.

The actual temperatures of each terminator are quite hot, approximately 1,150 and 1450 degrees Fahrenheit respectively. Computer modeling suggests “the prevailing winds are likely moving from the night side across the morning terminator, around the dayside, across the evening terminator and then around the nightside,” with wind speeds thousands of miles per hour.

A penguin and egg, as seen by Webb and Hubble

A penquin and egg compared
Click for original images.

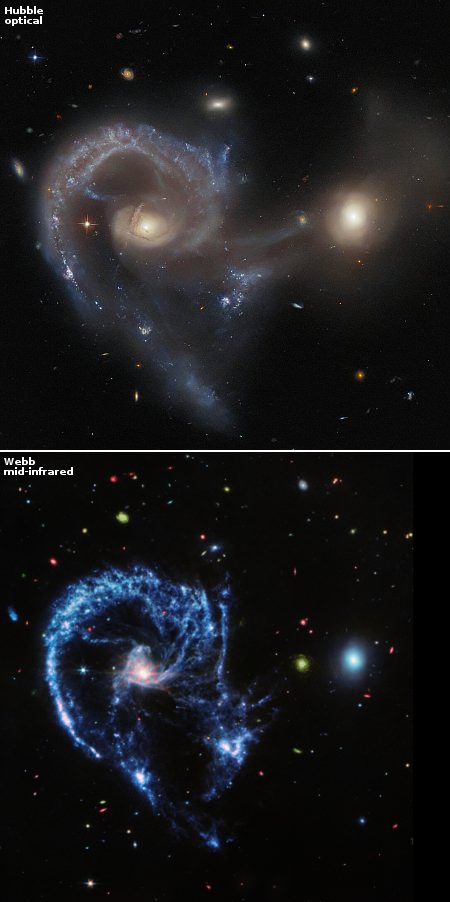
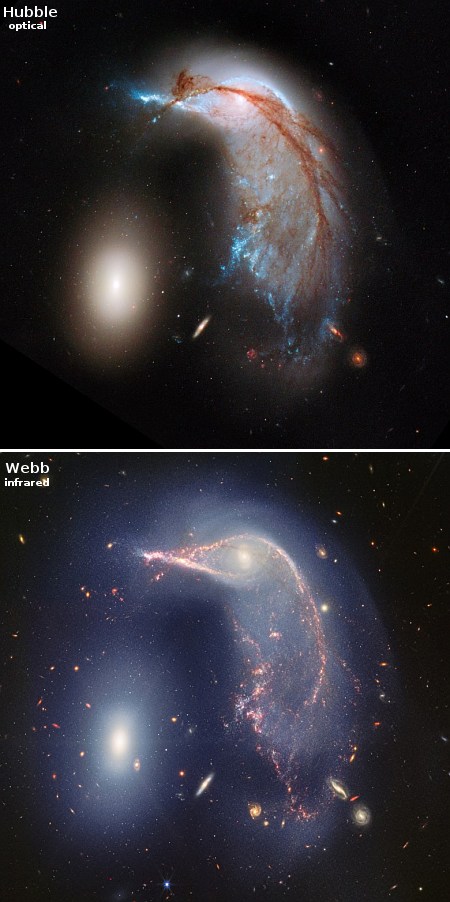
Cool image time! The two pictures to the right, cropped, reduced, and sharpened to post here, were taken by both the Webb and Hubble space telescopes of the same unusual galactic object, officially called Arp 142 but nicknamed by astronomers the Penquin and the Egg.

Both of these objects are galaxies. The Penquin’s strange shape is caused by the presence of the Egg, which is an elliptical galaxy that is twisting and distorting the Penquin’s original spiral galaxy whirlpool as it flies past. From the caption:

Like all spiral galaxies, the Penguin is still very rich in gas and dust. The galaxies’ “dance” gravitationally pulled on the Penguin’s thinner areas of gas and dust, causing them to crash in waves and form stars. Look for those areas in two places: what looks like a fish in its “beak” and the “feathers” in its “tail.”

Surrounding these newer stars is smoke-like material that includes carbon-containing molecules, known as polycyclic aromatic hydrocarbons, which Webb is exceptional at detecting. Dust, seen as fainter, deeper orange arcs also swoops from its beak to tail feathers.

In contrast, the Egg’s compact shape remains largely unchanged. As an elliptical galaxy, it is filled with aging stars, and has a lot less gas and dust that can be pulled away to form new stars. If both were spiral galaxies, each would end the first “twist” with new star formation and twirling curls, known as tidal tails.

Another reason for the Egg’s undisturbed appearance: These galaxies have approximately the same mass or heft, which is why the smaller-looking elliptical wasn’t consumed or distorted by the Penguin.

The differences between the two pictures also reveal many aspects of the Penguin. The Hubble optical image at the top captures the lanes of dust in the foreground, while the Webb infrared image at the bottom looks right through this dust to better trace the now-distorted spiral arms where star formation is presently taking place.

Astronomers estimate that these two galaxies are about 100,000 light years apart, comparable to the width of the Milky Way. In comparison, the Andromeda galaxy is around 2.5 million light years away, and will not begin interacting with our galaxy in this manner for an estimated four billion years. The Egg and Penguin however began their warped dance about 50 million years ago.

Webb: An exoplanet in the habitable zone with a possible nitrogen/CO2 atmosphere and water ocean

Using the Webb Space Telescope, astronomers have obtained new transiting spectroscopy of a “mini-Neptune-sized” exoplanet that circles in the habitable zone a red dwarf star about 48 light years away and have concluded that it appears to have a nitrogen/carbon dioxide atmosphere and even a water ocean.

While it is still only a tentative result, the presence of a nitrogen-rich atmosphere on LHS 1140 b would suggest the planet has retained a substantial atmosphere, creating conditions that might support liquid water. This discovery favors the water-world/snowball scenario as the most plausible.

Current models indicate that if LHS 1140 b has an Earth-like atmosphere, it would be a snowball planet with a vast “bull’s-eye” ocean measuring about 4,000 kilometers in diameter, equivalent to half the surface area of the Atlantic Ocean. The surface temperature at the centre of this alien ocean could even be a comfortable 20 degrees Celsius [68 degrees Fahrenheit]. [emphasis mine]

You can read the preprint of the paper here [pdf].

The highlighted phrase must be noted. These results contain a lot of uncertainties and assumptions. However, the data is tantalizing, to say the least, and justify more observations using Webb. The scientists argue in their paper that because there are only about eight transits of the exoplanet per year — requiring several years of observations to pin down this data more precisely — and because Webb has a limited life expectancy as an infrared observatory, this star should get observational priority.

Webb: Hot Jupiter exoplanet has atmosphere with the smell of rotten eggs

Using spectroscopy from the infrared Webb Space Telescope, astronomers have measured some of the molecules in exoplanet HD 189733 b, one of the first hot Jupiter exoplanets ever discovered, and found it has an atmosphere rich in hydrogen sulfide, which emits a smell like rotten eggs.

In addition to detecting hydrogen sulfide, the team analyzed the planet’s oxygen and carbon content, pinpointing water, carbon dioxide and carbon monoxide as major components of the planetary atmosphere. Measuring these heavy elements allows astronomers to compare the composition of exoplanets to that of gas giants in our solar system like Jupiter and Uranus.

The exoplanet, about 64 light years away, has an orbit lasting only about two Earth days, with atmospheric temperatures has hot as 1,700 degrees Fahrenheit.

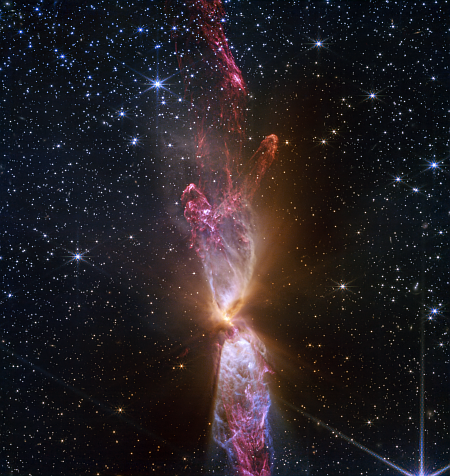
Webb takes false-color infrared image of bi-polar protostar nebula

Hourglass nebula as seen in infrared by Webb
Click for original image.

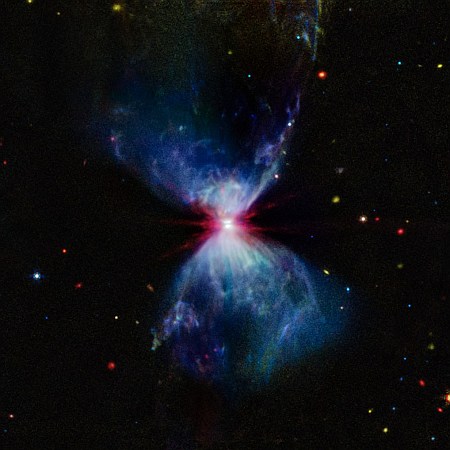
Scientists using the Webb Space Telescope have now produced a new false-color infrared image of the bi-polar hour-glass-shaped protostar nebula dubbed L1527.

That image is to the left, created from data from Webb’s MIRI (Mid-Infrared Instrument) and cropped, reduced, and sharpened to post here. While it is not quite a pretty as a prevous Webb infrared image taken in 2022 by its NIRCam (Near-Infrared Camera), it provides new information about the make-up of materials within this nebula. From the caption:

The areas colored here in blue, which encompass most of the hourglass, show mostly carbonaceous molecules known as polycyclic aromatic hydrocarbons. The protostar itself and the dense blanket of dust and a mixture of gases that surround it are represented in red. (The sparkler-like red extensions are an artifact of the telescopes’s optics). In between, MIRI reveals a white region directly above and below the protostar, which doesn’t show as strongly in the NIRCam view. This region is a mixture of hydrocarbons, ionized neon, and thick dust, which shows that the protostar propels this matter quite far away from it as it messily consumes material from its disk.

Previous to Webb, this object had mostly been studied in 2012 using radio and submillimeter wavelengths (see the papers here and here), but those papers determined this is possibly the youngest known protostar, less than 100,000 years old.

Scientists surprised by new Webb data of the upper layers of Jupiter’s Great Red Spot

Jupiter's Great Red Spot, as seen in infrared
Click for original image.

The uncertainty of science: Using the Webb Space Telescope, scientists have obtained infrared data of the upper layers of Jupiter’s Great Red Spot, revealing that it is far more complicated that predicted by researchers.

The upper atmosphere of Jupiter is the interface between the planet’s magnetic field and the underlying atmosphere. Here, the bright and vibrant displays of northern and southern lights can be seen, which are fuelled by the volcanic material ejected from Jupiter’s moon Io. However, closer to the equator, the structure of the planet’s upper atmosphere is influenced by incoming sunlight. Because Jupiter receives only 4% of the sunlight that is received on Earth, astronomers predicted this region to be homogeneous in nature.

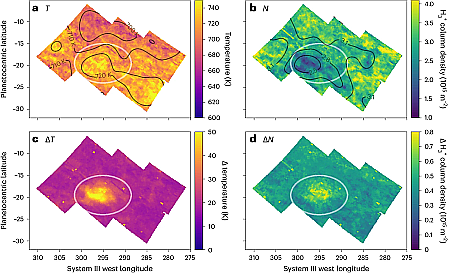
The Great Red Spot of Jupiter was observed by Webb’s Near-InfraRed Spectrograph (NIRSpec) in July 2022, using the instrument’s Integral Field Unit capabilities. The team’s Early Release Science observations sought to investigate if this region was in fact dull, and the region above the iconic Great Red Spot was targeted for Webb’s observations. The team was surprised to discover that the upper atmosphere hosts a variety of intricate structures, including dark arcs and bright spots, across the entire field of view.

You can read the published research paper here. The image to the right is figure 4 from that paper, with each panel showing different infrared wavelengths indicated by the different colors, and thus the complex structures and physical properties.

Webb produces false color infrared image of the Crab Nebula

The Crab Nebula as in infrared by Webb
Click for original image.

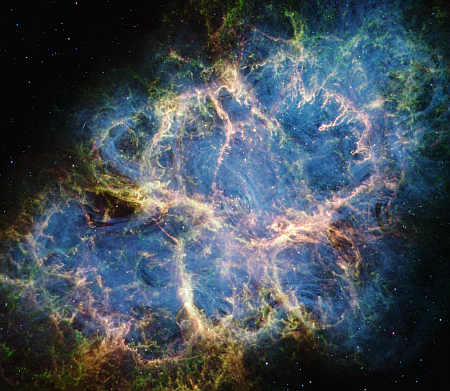
The false-color infrared picture to the right, reduced and sharpened to post here, was taken by the Webb Space Telescope of the Crab Nebula, located 6,500 light years away and created when a star went supernova in 1054 AD, in order to better understand its make-up and origins. From the caption:

The supernova remnant is comprised of several different components, including doubly ionized sulfur (represented in green), warm dust (magenta), and synchrotron emission (blue). Yellow-white mottled filaments within the Crab’s interior represent areas where dust and doubly ionized sulfur coincide.

The spectroscopic data from this infrared observation has in fact increased the puzzle of the Crab’s origin. Previously the data suggested the supernova that caused it was one type of supernova. This data now suggests it could have been a different type, without precluding the possibility of the first.

“Now the Webb data widen the possible interpretations,” said Tea Temim, lead author of the study at Princeton University in New Jersey. “The composition of the gas no longer requires an electron-capture explosion, but could also be explained by a weak iron core-collapse supernova.”

You can read the published science paper here [pdf].

Evidence of giant asteroid collision in debris disk surrounding the star Beta Pictoris

Data difference between Spitzer and Webb
Click for original figure.

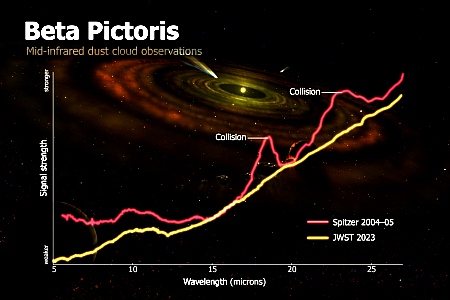
Scientists comparing infrared data collected twenty years apart — first by the Spitzer Space Telescope and then by the Webb Space Telescope — think they have detected evidence of a gigantic asteroid collision in the debris disk that surrounds the very young star Beta Pictoris, located 63 light years away.

The graph to the right shows the change found between the observations. From the caption:

Scientists theorize that the massive amount of dust seen in the 2004–05 image from the Spitzer Space Telescope indicates a collision of asteroids that had largely cleared by the time the James Webb Space Telescope captured its images in 2023.

…When Spitzer collected the earlier data, scientists assumed something like small bodies grinding down would stir and replenish the dust steadily over time. But Webb’s new observations show the dust disappeared and was not replaced. The amount of dust kicked up is about 100,000 times the size of the asteroid that killed the dinosaurs, Chen said.

It is believed by scientists that the debris disk that surrounds Beta Pictoris is comparable to the early solar system when the planets first started to form. This collision could be similar to the kind of collision that is thought to have formed the Moon, when a large Mars-sized object smashed into the early Earth.

Webb detects carbon in early galaxy, far earlier than expected

The uncertainty of science: Astronomers using the Webb Space Telescope have detected evidence of carbon in a galaxy estimated to exist only 350 million years after the Big Bang, much sooner than any theory had predicted such an element could have developed.

“We were surprised to see carbon so early in the universe, since it was thought that the earliest stars produced much more oxygen than carbon,” said Maiolino. “We had thought that carbon was enriched much later, through entirely different processes, but the fact that it appears so early tells us that the very first stars may have operated very differently.”

According to some models, when the earliest stars exploded as supernovas, they may have released less energy than initially expected. In this case, carbon, which was in the stars’ outer shell and less gravitationally bound than oxygen, could have escaped more easily and spread throughout the galaxy, while a large amount of oxygen fell back and collapsed into a black hole.

The paper is available here.

The scientists are struggling to explain this result in the context of the Big Bang theory itself, and have come up with scenarios where it will work. However, the fact that Webb has found another data point suggesting the early universe was more complicated than any model predicted increases the difficulty in producing Big Bang models that will work.

All in all, there remains great uncertainty here. This particular observation required 65 hours of observation time. Pulling real data from these very distant points of light remains quite challenging.

Astronomers find another record-setting most distant galaxy

The uncertainty of science: Using the Webb Space Telescope, astonomers have identified another record-setting most distant galaxy, believed to exist only 300 million years after the Big Bang and once again far more massive and developed than expected that early in the universe.

The galaxy was actually one of two very early galaxies identified that lie close to each other on the sky but are not linked in any way.

The two record-breaking galaxies are called JADES-GS-z14-0 and JADES-GS-z14-1, the former being the more distant of the two. In addition to being the new distance record holder, JADES-GS-z14-0 is remarkable for how big and bright it is. “The size of the galaxy clearly proves that most of the light is being produced by large numbers of young stars,” said Eisenstein, a Harvard professor and chair of the astronomy department, “rather than material falling onto a supermassive black hole in the galaxy’s center, which would appear much smaller.”

The combination of the extreme brightness and the fact that young stars are fueling this high luminosity makes JADES-GS-z14-0 the most striking evidence yet found for the rapid formation of large, massive galaxies in the early Universe.

All the early galaxies that Webb has found so far have been far more massive and developed than cosmologists had predicted. The expectation had been that there wouldn’t have been enough time after the Big Bang for such galaxies to develop. Yet they have, suggesting something is not right with our theories about the beginning of the universe.

Dry ice and carbon monoxide detected on asteroids beyond Neptune

Based on new infrared observations by the Webb Space Telescope, scientists have detected for the first time carbon dioxide and carbon monoxide on asteroids beyond Neptune. From the abstract of their paper:

Out of 59 [trans-Neptunian objects] and centaur [asteriods] observed by the James Webb Space Telescope and the NIRSpec Integral Field Unit as part of the DiSCo-TNOs project, we report the widespread detection of CO2 ice in 95% of the sample and CO ice in 47% of the sample.

It appears dry ice is ubiquitous in the outer solar system. Since it is believed these asteroids are very primitive, this data suggests there was a lot of it in the early solar system when the planets were forming.

The discovery of so much carbon monoxide is however more puzzling, as it is expected to sublimate away even in the very cold environment so far from the Sun and is therefore likely not from the early solar system. The scientists posit that it might have been produced when radiation transformed the other carbon-bearing ices.

Webb data suggests a super-Earth might have an atmosphere

Using infrared data from the Webb Space Telescope, scientists now think the hot super-Earth exoplanet dubbed 55 Cancri e and 41 light years away might have an atmosphere made up not only of vaporized molten rock but other gases as well, such as carbon dioxide or carbon monoxide.

The exoplanet orbits much too close to its star, only 1.4 million miles away, for any life as we know it to exist. Its surface is thought to be molten, heated by that star.

The team thinks that the gases blanketing 55 Cancri e would be bubbling out from the interior, rather than being present ever since the planet formed. “The primary atmosphere would be long gone because of the high temperature and intense radiation from the star,” said Bello-Arufe. “This would be a secondary atmosphere that is continuously replenished by the magma ocean. Magma is not just crystals and liquid rock; there’s a lot of dissolved gas in it, too.”

As always, these results remain unconfirmed and are very uncertain.

Webb maps the global temperature and water vapor of a hot exoplanet

The uncertainty of science: Using detailed infrared data from the Webb Space Telescope, scientists have mapped the temperature swings and atmospheric water vapor across the entire global of a tidally locked “hot Jupiter” exoplanet about 284 light years away that orbits its star every 19.5 hours.

The team used Webb’s MIRI (Mid-Infrared Instrument) to measure light from the WASP-43 system every 10 seconds for more than 24 hours. “By observing over an entire orbit, we were able to calculate the temperature of different sides of the planet as they rotate into view,” explained Bell. “From that, we could construct a rough map of temperature across the planet.”

The measurements show that the dayside has an average temperature of nearly 2,300 degrees Fahrenheit (1,250 degrees Celsius) – hot enough to forge iron. Meanwhile, the nightside is significantly cooler at 1,100 degrees Fahrenheit (600 degrees Celsius). The data also helps locate the hottest spot on the planet (the “hotspot”), which is shifted slightly eastward from the point that receives the most stellar radiation, where the star is highest in the planet’s sky. This shift occurs because of supersonic winds, which move heated air eastward.

…To interpret the map, the team used complex 3D atmospheric models like those used to understand weather and climate on Earth. The analysis shows that the nightside is probably covered in a thick, high layer of clouds that prevent some of the infrared light from escaping to space. As a result, the nightside – while very hot – looks dimmer and cooler than it would if there were no clouds.

The data also found water vapor on both the day and night sides of the exoplanet, but surprisingly no evidence of methane, suggesting that atmosphere has high winds exceeding 5,000 miles per hour that mixes that atmosphere globally. Any methane that was expected to exist on the night side gets blown to the day side where the heat destroys it.

This data, while excellent, is also very coase and even more uncertain. While Webb can get good infrared spectroscopy from almost 300 light years away, we must take the interpretations of that data with great skepticism.

Webb takes an infrared look at the mane of the Horsehead Nebula

Context images
Click for original image.

The mane of the Horsehead Nebula, seen in infrared
Click for original image.

The cool infrared image to the right, cropped, reduced, and sharpened to post here, was taken by the Webb Space Telescope and released today. The three pictures above provide the context, with the rectangle inside the rightmost image indicated the area covered by the close-up to the right.

Webb’s new images show part of the sky in the constellation Orion (The Hunter), in the western side of a dense region known as the Orion B molecular cloud. Rising from turbulent waves of dust and gas is the Horsehead Nebula, otherwise known as Barnard 33, which resides roughly 1,300 light-years away.

The nebula formed from a collapsing interstellar cloud of material, and glows because it is illuminated by a nearby hot star. The gas clouds surrounding the Horsehead have already dissipated, but the jutting pillar is made of thick clumps of material and therefore is harder to erode. Astronomers estimate that the Horsehead has about five million years left before it too disintegrates. Webb’s new view focuses on the illuminated edge of the top of the nebula’s distinctive dust and gas structure.

In the close-up, note the many distant tiny galaxies, both above the mane as well as glowing throught it.

Hubble and Webb confirm decade-long conflict in universe’s expansion rate

The uncertainty of science: New data from both the Hubble and Webb space telescopes has confirmed Hubble’s previous measurement of the rate of the Hubble constant, the rate in which the universe is expanding. The problem is that these numbers still differ significantly from the expansion rate determined by the observations of the cosmic microwave background by the Planck space telescope.

Hubble and Webb come up with a rate of expansion 73 km/s/Mpc, while Planck found an expansion rate of 67 km/s/Mpc. Though this difference appears small, the scientists in both groups claim their margin of error is much smaller than that difference, which means both can’t be right.

You can read the paper for these new results here.

The bottom line mystery remains: The data is clearly telling us one of two things: 1) the many assumptions that go into these numbers might be incorrect, explaining the difference, or 2) there is something fundamentally wrong about the Big Bang theory that cosmologists have been promoting for more than a half century as the only explanation for the formation of the universe.

The solution could also be a combination of both. Our data and our theories are wrong.

Webb: Infrared data sees neutron star remaining after 1987 supernova, the nearest in more than 4 centuries

Webb's infrared view of Supernova 1987a
Click for original image.

Using the Webb Space Telescope, astronomers have obtained infrared data that confirms the existence of a neutron star at the location of Supernova 1987a, located in the Large Magellanic Cloud, the nearest such supernova in more than four centuries and the only one visible to the naked eye since the invention of the telescope.

Indirect evidence for the presence of a neutron star at the center of the remnant has been found in the past few years, and observations of much older supernova remnants — such as the Crab Nebula — confirm that neutron stars are found in many supernova remnants. However, no direct evidence of a neutron star in the aftermath of SN 1987A (or any other such recent supernova explosion) had been observed, until now.

…Spectral analysis of the [Webb] results showed a strong signal due to ionized argon from the center of the ejected material that surrounds the original site of SN 1987A. Subsequent observations using Webb’s NIRSpec (Near-Infrared Spectrograph) IFU at shorter wavelengths found even more heavily ionized chemical elements, particularly five times ionized argon (meaning argon atoms that have lost five of their 18 electrons). Such ions require highly energetic photons to form, and those photons have to come from somewhere.

That “somewhere” has to be a neutron star, based on present theories. The image above shows three different Webb views of Supernova 1987a, with the one on the lower right suggesting the existence of a point source at the center of the supernova remnant. In the left image the circular ring of bright spots is an older ring of dust and material that has been lit up by the crash of the explosive material (as indicated in blue at the center) flung out from the star when it went supernova and collapsed into a neutron star. That wave of explosive material took several decades to reach the ring and enflame it.

The internal structure of 19 galaxies, as seen in the infrared by Webb

The internal structure of 19 galaxies, as seen by Webb
Click for original image.

Scientists using the Webb Space Telescope today released false color infrared images of nineteen different spiral galaxies, each showing the complex internal structure that traces of spiral arms, but not always.

A compliation of those infrared images is to the right, reduced and sharpened to post here.

[Webb]’s NIRCam (Near-Infrared Camera) captured millions of stars in these images, which sparkle in blue tones. Some stars are spread throughout the spiral arms, but others are clumped tightly together in star clusters.

The telescope’s MIRI (Mid-Infrared Instrument) data highlights glowing dust, showing us where it exists behind, around, and between stars. It also spotlights stars that have not yet fully formed – they are still encased in the gas and dust that feed their growth, like bright red seeds at the tips of dusty peaks. “These are where we can find the newest, most massive stars in the galaxies,” said Erik Rosolowsky, a professor of physics at the University of Alberta in Edmonton, Canada.

The data suggests, not unexpectedly, that the central parts of each galaxy are older, formed first, with starbirth occurring later in the outer regions. A lot of further analysis however will be required to understand all the patterns exhibited in these images and their larger significance in connection with galaxy formation.

Webb confirms the unusual shape of early galaxies as seen by Hubble

Earth galaxies shapes, as seen by Webb in infrared
Click for original image.

The uncertainty of science: The infrared view of the Webb Space Telescope appears to have confirmed and even underlined the unusual shapes of many early galaxies as previously seen by the Hubble Space Telescope.

Researchers analyzing images from NASA’s James Webb Space Telescope have found that galaxies in the early universe are often flat and elongated, like surfboards and pool noodles – and are rarely round, like volleyballs or frisbees. “Roughly 50 to 80% of the galaxies we studied appear to be flattened in two dimensions,” explained lead author Viraj Pandya, a NASA Hubble Fellow at Columbia University in New York. “Galaxies that look like pool noodles or surfboards seem to be very common in the early universe, which is surprising, since they are uncommon nearby.”

The team focused on a vast field of near-infrared images delivered by Webb, known as the Cosmic Evolution Early Release Science (CEERS) Survey, plucking out galaxies that are estimated to exist when the universe was 600 million to 6 billion years old.

While most distant galaxies look like surfboards and pool noodles, others are shaped like frisbees and volleyballs. The “volleyballs,” or sphere-shaped galaxies, appear the most compact type on the cosmic “ocean” and were also the least frequently identified. The frisbees were found to be as large as the surfboard- and pool noodle-shaped galaxies along the “horizon,” but become more common closer to “shore” in the nearby universe.

The galaxies also appear generally far less massive than galaxies in the near universe, which fits with the Big Bang theory that says they had less time to grow.

The press release notes that the sample size is still very small, and further observations will be required to confirm whether these shapes are common in the early universe.

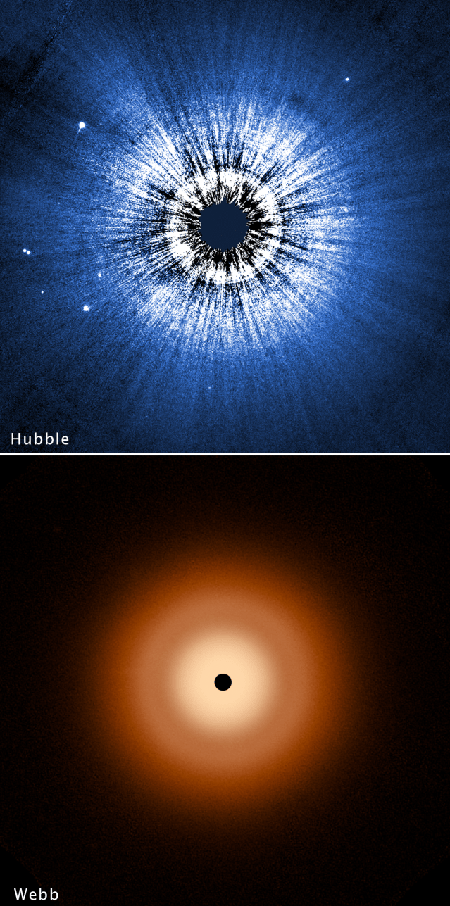
Webb infrared data detects unexpected structure inside debris disk of Beta Pictoris

Beta Pictoris debris disk
Click for original image.

A new false color infrared image from the Webb Space Telescope has revealed an unexpected structure extending out from the two debris disks that surround the near-by star Beta Pictoris, with computer modeling suggesting might this structure have been the result of a large collision as recently as only 100 years ago.

That false-colr image is the right, with this newly discovered structure, described by the scientists as resembling “a cat’s tail”, on the right side. The infrared light of the star has been blocked in the center in order to see the details of the disk.

Webb’s mid-infrared data also revealed differences in temperature between Beta Pic’s two disks, which likely is due to differences in composition. “We didn’t expect Webb to reveal that there are two different types of material around Beta Pic, but MIRI clearly showed us that the material of the secondary disk and cat’s tail is hotter than the main disk,” said Christopher Stark, a co-author of the study at NASA’s Goddard Space Flight Center in Greenbelt, Maryland. “The dust that forms that disk and tail must be very dark, so we don’t easily see it at visible wavelengths — but in the mid-infrared, it’s glowing.”

To explain the hotter temperature, the team deduced that the dust may be highly porous “organic refractory material,” similar to the matter found on the surfaces of comets and asteroids in our solar system. For example, a preliminary analysis of material sampled from asteroid Bennu by NASA’s OSIRIS-REx mission found it to be very dark and carbon-rich, much like what MIRI detected at Beta Pic.

In an attempt to explain the cat’s tail, the scientists used computer models, which suggested it might have been caused by an event that produced a lot of dust, such as a collision between two large objects in the debris disk, and that event could have happened as recently as a hundred years ago.

This hypothesis remains unconfirmed, with much more data required before a final explanation can be accepted.

The uncertainty of science as proven by the Webb Space Telescope

A long detailed article was released today at Space.com, describing the many contradictions in the data coming back from the Webb Space Telescope that seriously challenge all the theories of cosmologists about the nature of the universe as well as its beginning in a single Big Bang.

The article is definitely worth reading, but be warned that it treats science as a certainty that should never have such contradictions, as illustrated first by its very headline: “After 2 years in space, the James Webb Space Telescope has broken cosmology. Can it be fixed?”

“Science” isn’t broken in the slightest. All Webb has done is provide new data that does not fit the theories. As physicist Richard Feynman once stated bluntly in teaching students the scientific method,

“It doesn’t make a difference how beautiful your guess is, it doesn’t make a difference how smart you are, who made the guess, or what his name is. If it disagrees with experiment, it’s wrong.”

Cosmologists for decades have been guessing in proposing their theories about the Big Bang, the expansion of the universe, and dark matter, based on only a tiny amount of data that had been obtained with enormous assumptions and uncertainties. It is therefore not surprising (nor was it ever surprising) that Webb has blown holes in their theories.

For example, the article spends a lot of time discussing the Hubble constant, describing how observations using different instruments (including Webb) have come up with two conflicting numbers for it — either 67 or 74 kilometers per second per megaparsec. No one can resolve this contradiction. No theory explains it.

To me the irony is that back in the 1990s, when Hubble made its first good measurements of the Hubble constant, these same scientists were certain then that the number Hubble came up with, around 90 kilometers per second per megaparsec, was now correct.

They didn’t really understand reality then, and they don’t yet understand it now.

What cosmologists must do is back away from their theories and recognize the vast areas of ignorance that exist. Once that is done, they might have a chance to resolve the conflict between the data obtained and the theories proposed, and come up with new theories that might work (with great emphasis on the word “might”). Complaining about the paradoxes will accomplish nothing.

The nearest star-forming region, as seen in infrared by Webb

The nearest star-forming region, as seen by Webb
Click for original image.

Time for another cool image on this somewhat quiet Monday. The false-color infrared image to the right, reduced and sharpened to post here, was taken by the Webb Space Telescope, and shows the Rho Ophiuchi star-forming region, the nearest to our solar system at a distance of about 460 light years.

It is a relatively small, quiet stellar nursery, but you’d never know it from Webb’s chaotic close-up. Jets bursting from young stars crisscross the image, impacting the surrounding interstellar gas and lighting up molecular hydrogen, shown in red. Some stars display the telltale shadow of a circumstellar disc, the makings of future planetary systems.

The young stars at the centre of many of these discs are similar in mass to the Sun or smaller. The heftiest in this image is the star S1, which appears amid a glowing cave it is carving out with its stellar winds in the lower half of the image. The lighter-coloured gas surrounding S1 consists of polycyclic aromatic hydrocarbons, a family of carbon-based molecules that are among the most common compounds found in space.

There are two features that are most compelling to me in this image. First, the red hydrogen jet that cuts across the entire right half of the image from top to bottom. At the top you can see how that jet is pushing material before it. Second, we have the cave-like structure surround S1, the central star. The yellowish cloud is almost like a hand cupped around that star.

Webb takes another infrared image of Uranus

Uranus as seen in infrared by Webb
Click for original image. Go here for Uranus close-up

Astronomers have used the Webb Space Telescope to take another infrared image of Uranus, following up on earlier observations with Webb in April.

The new false-color infrared picture is to the right, cropped, reduced, and enhanced to post here. Though the close-up of Uranus is in the left corner, the overall view is somewhat wider than the image I highlighted previously, showing many background galaxies and at least one star. The star is the spiked bright object on the left. In false color the galaxies all been given an orange tint, while the blue objects near Uranus are its moons. Because Uranus’s rotational tilt is so extreme, 98 degrees compared to Earth’s 23 degrees, its north pole is presently facing the Sun directly, and is in the center here.

One of the most striking of these is the planet’s seasonal north polar cloud cap. Compared to the Webb image from earlier this year, some details of the cap are easier to see in these newer images. These include the bright, white, inner cap and the dark lane in the bottom of the polar cap, toward the lower latitudes. Several bright storms can also be seen near and below the southern border of the polar cap. The number of these storms, and how frequently and where they appear in Uranus’s atmosphere, might be due to a combination of seasonal and meteorological effects.

The polar cap appears to become more prominent when the planet’s pole begins to point toward the Sun, as it approaches solstice and receives more sunlight. Uranus reaches its next solstice in 2028, and astronomers are eager to watch any possible changes in the structure of these features. Webb will help disentangle the seasonal and meteorological effects that influence Uranus’s storms, which is critical to help astronomers understand the planet’s complex atmosphere.

If you want to see what Uranus looks like to our eyes, check out the Hubble pictures taken in 2014 and 2022. Though fewer features are visible in optical wavelengths, those two images showed long term seasonal changes.

Webb has now revealed some shorter term changes.

Webb takes infrared false-color image of supernova remnant Cassiopeia A

Cass A in infrared
Click for original image.

Using the Webb Space Telescope, astronomers have obtained the first wide full infrared view of the supernova remnant Cassiopeia A, the remains of a supernova that occurred about 11,000 years ago. That image is to the right, reduced to post here.

The most noticeable colors in Webb’s newest image are clumps represented in bright orange and light pink that make up the inner shell of the supernova remnant. Webb’s razor-sharp view can detect the tiniest knots of gas, comprised of sulfur, oxygen, argon, and neon from the star itself. Embedded in this gas is a mixture of dust and molecules, which will eventually become components of new stars and planetary systems. Some filaments of debris are too tiny to be resolved by even Webb, meaning they are comparable to or less than 10 billion miles across (around 100 astronomical units). In comparison, the entirety of Cas A spans 10 light-years across, or 60 trillion miles.

…When comparing Webb’s new near-infrared view of Cas A with the mid-infrared view, its inner cavity and outermost shell are curiously devoid of color. The outskirts of the main inner shell, which appeared as a deep orange and red in the MIRI image, now look like smoke from a campfire. This marks where the supernova blast wave is ramming into surrounding circumstellar material. The dust in the circumstellar material is too cool to be detected directly at near-infrared wavelengths, but lights up in the mid-infrared.

The four rectangles mark specific features of particular interest, with #4, dubbed by the scientists Baby Cas, the most intriguing.

This is a light echo, where light from the star’s long-ago explosion has reached and is warming distant dust, which is glowing as it cools down. The intricacy of the dust pattern, and Baby Cas A’s apparent proximity to Cas A itself, are particularly intriguing to researchers. In actuality, Baby Cas A is located about 170 light-years behind the supernova remnant.

By comparing this infrared view with Hubble’s optical and Chandra’s X-ray views, astronomers will be able to better decipher Cas A’s make-up and geometry.

Webb: Needles scattered near the center of the Milky Way

Needles in space
Click for original image.

Scientists today released a new false-color infrared image taken by the Webb Space Telescope of a region about 300 light years from the center of the Milky Way, dubbed Sagittarius-C. That picture is to the right, cropped, reduced and sharpened to post here. The blue or cyan regions are ionized hydrogen clouds, and with this image were revealed to be much more extensive than expected. The orange blob near the center is a densely packed cluster of protostars, the starlight blocked by the cloud of material.

The most interesting feature however are the needle-like structures within that ionized hydrogen, oriented in all directions in a manner that looks completely random. Though such needles have been seen previously, the data here is far more detailed, and might eventually help astronomers figure out what the heck these features are and what caused them.

1 2 3 4 6