
Sunspot update October 2019: Sunspot activity continues to flatline
For the fifth month in a row the Sun has produced practically no sunspots, possibly the longest such stretch since astronomers began recording the sunspot cycle in the 1700s.
This flatlining is very obvious in NOAA’s October update of its graph showing the long term sunspot activity of the Sun, released yesterday, and posted below, with annotations:
The graph above has been modified to show the predictions of the solar science community for the previous solar maximum. The green curves show the community’s two original predictions from April 2007, with half the scientists predicting a very strong maximum and half predicting a weak one. The red curve is their revised May 2009 prediction, extended in November 2018 four years into the future.
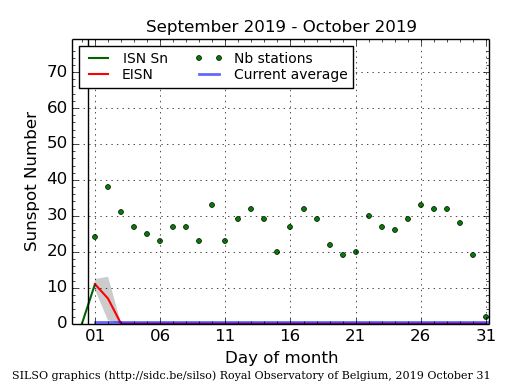
As it has done in previous four months, in October the Sun produced practically no sunspots. The graph on the right, produced by Sunspot Index and Long-term Solar Observations (SILSO), shows only one weak sunspot at the beginning of October.
Even though the previous 2008-2009 solar minimum was one of the deepest and longest ever recorded, the lack of sunspots in the past five months has significantly beaten it for inactivity, as shown on the first graph above. That previous minimum never had a period of even two months with so few sunspots. Furthermore, the Sun has now been blank 74% of the time in 2019, a record of blankness that beats the yearly record of either 2008 or 2009. If the Sun continues to be as blank as it has been for the next two months, 2019 will easily set the record for the year with the fewest sunspots ever recorded.
The big question remains: Are we heading for a grand minimum with no sunspots for decades? We still do not know. Even these unprecedented trends prove nothing, as we really do not yet have a clear understanding of why the Sun undergoes these various cycles of sunspot activity/inactivity. The Sun could still come back to life in the coming years. We can only wait and see. As I noted however in last month’s sunspot update, the arrival of a new grand minumum, the first since the 1600s, could have important consequences:
During past grand minimums there is evidence that the Earth also cooled, though the link between the two phenomenon remains circumstantial and unproven. If we see another grand minimum, and the Earth once again cools, then we might be able to finally tie these two phenomenon together.
It is essential that climate scientists pursue this question. Answering it might very well defuse the fears presently expressed by leftist politicians and the leftist press of an oncoming period of global warming.
At the same time, it might also present us with the possibility of an oncoming period of significant global cooling, during which it will be so cold that we might face crop failures (as happened in the previous grand minimum in the 1600s).
We need to know what is going on with the Sun, and its consequences for Earth, as soon as possible. Whether we can find out this solar cycle is unlikely, but a cold hard look at the data would do much to answer the question.
I wonder however if there any climate scientists around willing to do so. Questioning human-caused global warming carries great career risks. In fact, taking any position counter to the prevailing wisdom on any scientific issue appears to carry risks, as demonstrated by the experience recently when a journal decided to publish a paper that questioned modern gender politics:
In a move likely to attract criticism, a peer-reviewed journal has agreed to publish an Italian physicist’s highly contested analysis of publications, which concludes that female physicists don’t face more career obstacles than their male colleagues. The journal says it will also simultaneously publish critiques of the paper, which one member of the journal’s editorial board says is “flawed” and contains “unsubstantiated claims.”
Last year, physicist Alessandro Strumia received widespread criticism after presenting a talk at CERN, the European particle physics laboratory near Geneva, Switzerland, where he was a guest professor. During the presentation, he asserted that physics was built and invented by men, and stated on a slide that “Physics is not sexist against women.” Thousands of physicists signed a letter voicing concerns about Strumia’s views and some researchers published detailed critiques of his findings and methods, which focused on published papers in the field of “fundamental physics” that includes theoretical and experimental studies of fundamental particles, cosmology, and astrophysics. Some of Strumia’s critics have argued that such literature analyses are not sufficient to support his claims. Both CERN and Strumia’s employer, the University of Pisa in Italy, launched investigations. Earlier this year, CERN cut all ties with Strumia and the university released a statement condemning his comments. [emphasis mine]
For a scientist to lose his job merely because he simply came to a different conclusion from the majority is quite chilling. And the consequences are equally dangerous for any climate scientist who questions the model of human-caused global warming. Claiming that the Sun might have a more significant influence on the climate than carbon dioxide might very well get a scientist’s career destroyed, as appears to have happened to this physicist above.
We live in perilous times.

On Christmas Eve 1968 three Americans became the first humans to visit another world. What they did to celebrate was unexpected and profound, and will be remembered throughout all human history. Genesis: the Story of Apollo 8, Robert Zimmerman's classic history of humanity's first journey to another world, tells that story, and it is now available as both an ebook and an audiobook, both with a foreword by Valerie Anders and a new introduction by Robert Zimmerman.
The print edition can be purchased at Amazon or from any other book seller. If you want an autographed copy the price is $60 for the hardback and $45 for the paperback, plus $8 shipping for each. Go here for purchasing details. The ebook is available everywhere for $5.99 (before discount) at amazon, or direct from my ebook publisher, ebookit. If you buy it from ebookit you don't support the big tech companies and the author gets a bigger cut much sooner.
The audiobook is also available at all these vendors, and is also free with a 30-day trial membership to Audible.
"Not simply about one mission, [Genesis] is also the history of America's quest for the moon... Zimmerman has done a masterful job of tying disparate events together into a solid account of one of America's greatest human triumphs."--San Antonio Express-News
A proper presentation of data would be sun spots per month. The reporting of %days sun spot free is widely misleading, and does not give a true picture of the depth of this minimum. This is known as lying with statistics.
Why are you ignoring a great paper on this subject: “Oscillations of the baseline of solar
magnetic field and solar irradiance on a millennial timescale” published online in the http://www.nature.com/scientificreports on 24 June 2019? (V. V. Zharkova1, S. J. Shepherd2, S. I. Zharkov3 & E. Popova4,5)
…”Until recently, solar activity was accepted to be one of the important factors defining the temperature on Earth
and other planets. In this paper we reproduced the summary curve of the solar magnetic field associated with
solar activity5,6 for the one hundred thousand years backward by using the formulas describing the sum of the
two principal components found from the full disk solar magnetograms. In the past 3000 years the summary
curve shows the solar activity for every 11 years and occurrence of 9 grand solar cycles of 350–400 years, which
are caused by the beating effects of two magnetic waves generated by solar dynamo at the inner and outer layers
inside the solar interior with close but not equal frequencies6…..” This is real science with the testable predictions forward
Leo Mirkin: I have not ignored this work. However, until its predictions are proven it is one of hundreds of similar predictions by the solar science community, almost all of which make predictions not on a fundamental understanding of the solar physics that cause these cycles but on the symptomatic cycles themselves. This work tries hard to base its predictions on those fundamental processes, which is good. We need to wait to find out if their model works however.
According to Greta and AOC if we eat less beef we can cool the planet.
And obviously that big ball of fusing hydrogen up in the sky has a huge effect on the planet’s temperature.
So we can control the Sun’s output by eating more or less beef!
Or something like that….
I’m no scientist, nor have I stayed at a Holiday Inn Express lately, but I DO have a THERMOSTAT that controls the HEAT in my home! When I turn the thermostat UP to a higher temperature it gets WARMER in my home. Conversely, when I LOWER the temperature it gets COOLER! I’m sure it has something to do with the amount of GAS that is burned. I believe the SUN operates the same way and the SUNSPOTS or FLARES spew out additional HEAT and since the SUN is our furnace, it makes the earth HOTTER. When there are fewer flares there is less ADDITIONAL heat coming from the sun so it get’s cooler. It makes sense to me. I also believe that if EVERYTHING made sense MEN would ride horses sidesaddle!
BSinSC, the Sun’s thermostat is stuck at 1366W/m^2 plus or minus 0.05% at 1 AU distance.
The sun’s thermostat is not stuck! It is a variable star. We just do not know all the nuances of it’s oscillations. We do know there was MAJOR climate change in the past when man’s affect was negligible. This is what the AGW folk have missed or left out of their equations.
We know there has been loss of the polar ice caps; on Mars. Donald Parker, an pro-amateur planetary astrophotographer has been monitoring for some 50 years.
What we do not know is the nature, or dynamics, of the links between the sun and and terrestrial climate.
Further to the argument that we have superior technology for sun spot monitoring now, than during the Maunder minimum, the chart at this link kind of supports the argument. Notice that about 1750, the data changes : red vs blue. There seems to be more data points. This suggests that cloud cover and the number of people monitoring and the optics improved dramatically. Now we have the space telescopes unhindered by cloud and 24/7 monitoring. This enables us to see the more transient small spots that were probably there, but not caught, during the Maunder minimum.
https://en.wikipedia.org/wiki/Solar_cycle#/media/File:Sunspot_Numbers.png
It would help if Michelle Obama would stop [deleted].
Eric: I have edited your comment, deleting the childish obscenity.
Read the rules about commenting in the right column of the webpage. I expect commenters to act like civilized adults. You are absolutely welcome to comment here but only if you meet this expectation.
Note that this is a warning. A second violation will cause a one-week suspension, with a third violation permanent ban.
Phill O,
I think that the red data on either side of the Maunder Minimum demonstrates that there was sufficient interest and observation of the sun during that time that the minimum is a real phenomenon.
The blue and purple data demonstrate that there really is a variation in sun spots, which means that there is some variation in solar activity. I believe that there is some knowledge as to the minimum discernible sunspot size from the telescopes used, back then, so we can be fairly sure that the most recent cycle is not a missed Maunder-type minimum.
It is unknown whether we are entering a Maunder-type minimum, a Dalton-type minimum or a regular low point in the cycles, as seen in three of the five cycles straddling the turn of the 20th century. Only time will tell us for sure.
However, Robert makes a significant point that the sun is less active this past half-year than has usually been seen. Although it is difficult to know what this means for the future, a sense of foreboding may be appropriate at this time. Happy Thanksgiving, merry Christmas, and have a happy New Year.
Eric,
It is my understanding that termites are a greater source of methane than cattle or people.
It is my understanding that termites are a greater source of methane than cattle or people.
https://en.wikipedia.org/wiki/Atmospheric_methane#Emissions_accounting_of_methane
Edward, Yup! The Maunder minimum was real, yet the data suggests that maybe today’s data is more comprehensive and the transient sun spots viewed over the past 4 months may have been missed if they had come during the Maunder minimum.
Are we in a grande minimum? Or are we in a deeper minimum? We have no way to know until 50 years have passed, or the sun reactivates. Will cycle 25 have a lower maximum than the low 24 or not happen? This is what would makes solar dynamics a great field for new solar astronomers.
Andrew_W While Wikipedia can be an interesting source for material, it has no standing in the scientific community.
It looks like all livestock are a greater source of methane than termites, but the amount from cattle is not separated from the other livestock. Human flatulence is not separated out as a source. It is hard to say whether or not I misunderstand that particular situation.
Phill O, if you actually followed the link you’d discover:
Reference: Fung et al. (1991) Hein et al. (1997) Lelieveld et al. (1998) Houweling et al. (1999) Bousquet et al. (2006)[31] Saunois et al. (2016)
Phill O
The sun’s thermostat is not stuck! It is a variable star.
Yes, just as I said: it’s output is 1366W/m^2 at 1 AU distance and varies plus or minus 0.05%.
If your home thermostat allowed heater output to vary by so small an amount you’d call it stuck and be getting the electrician around to fix it.
Sun output data vary. There are others who indicate the output varies by 0.1%. However, this assumes we know all there is to know about the sun, which, in my opinion, neglects the fact that there are always unknown unknowns. Also, the output varies with wavelength.
This current period of deep solar minimum may provide the solar dynamic scientists with new insights into the extent of solar variance. The monitoring of various energies by wavelength may also give us a new picture of the sun. As I have indicated before, this is a time for new astronomers to engage in solar dynamics as it is the forefront of REAL significant science.
If others have noticed a shift from CO2 to CH4, so have I. I believe this shift is due, in part, to rationalization of the chemistry (particularly CO2 buffer properties) and its interaction with the earth’s spheres. This is similar to the emphasis change from global warming to climate change. Friends and I want to live through, at least, the next solar cycle (or two) to see what is really happening with our star.
I stand firm in my opinion of the leftist bias of wikipedia.
Here is a link a friend sent (a retire nuclear plant engineer).
https://mail.google.com/mail/u/0/?shva=1
https://electroverse.net/another-climate-scientist-with-impeccable-credentials-breaks-ranks/
The “sunspot” which broke another streak yesterday and the day before was so insignificant that NOAA did not assign a number for it.
This is the eighth time since May 19 that a non-event has broken a spotless streak. Another false alarm was the “zero-millionth area” official marker July 22/23.
These images are not showing up on intensitygrams. And these intensitygrams are magnitudes more sensitive than the human eye in a visual telescope 100 or 400 years ago.
Yesterday’s “spot” only showed up on the combined helioseismic (acoustic waves) and magnetogram image.
If we were playing this game by the same rules in 1849 I believe today would have marked the 179th day of a spotless streak.
This would be an all time record since then. It would smash the 140 day record of 1822/1823.
Here are the conclusions from the 2015 International Symposium showing how non-uniform is the sunspot counting protocol.
Boring: skip the pdf to the last 3 pages.
http://lasp.colorado.edu/media/projects/SORCE/meetings/2015/presentations/Session%201/b_Clette_SORCE2015_V2s.pdf
===========================
Quote from page 15
“Conclusions: lessons learned
• Most diagnosed problems in SN (Sunspot Number) and GN (Grouping Number) due to:
– Improper processing methods
– Method changes deviating from an original definition
• Processing methods have a bigger impact than random errors in the
data”
Bob,
I live in Naples Fl and follow you on John Batchelor’s chats. I also believe earth has as much chance to cool off as it is to heat up.
The silence of the Hurricane crazies is thunderous. We had ONE storm this year affect continental USA.
I noticed the Jet Stream with it’s cooler air stayed farther south than normal this summer.
Also I noticed daily CONTRAILS @ 26 N during the entire summer, which means Colder Air @ 35,000 ft and above.
Are both of these events tied to fewer SUNSPOTS?
O’B
Co2, 0.4% of the atmosphere. Man has added 3% of the 0.4%. ppm 350.
10,000 yeas ago the ppm was 7000.
No panic then.
There is no question that the weather patterns in western North America have changed over the last 10 years, as evidenced by poorer skies for astronomy.
The exact nature (cause) of this change is in dispute. While I think that the Solar Powered Climate Change model is most consistent with empirical data, we will have a much clearer picture after another two solar cycles.