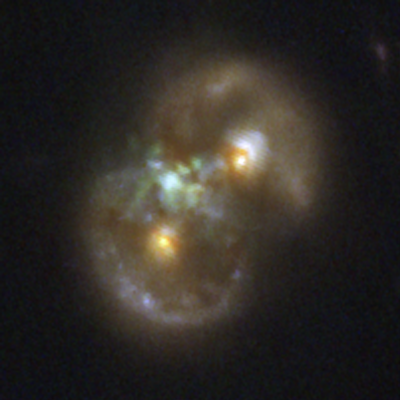
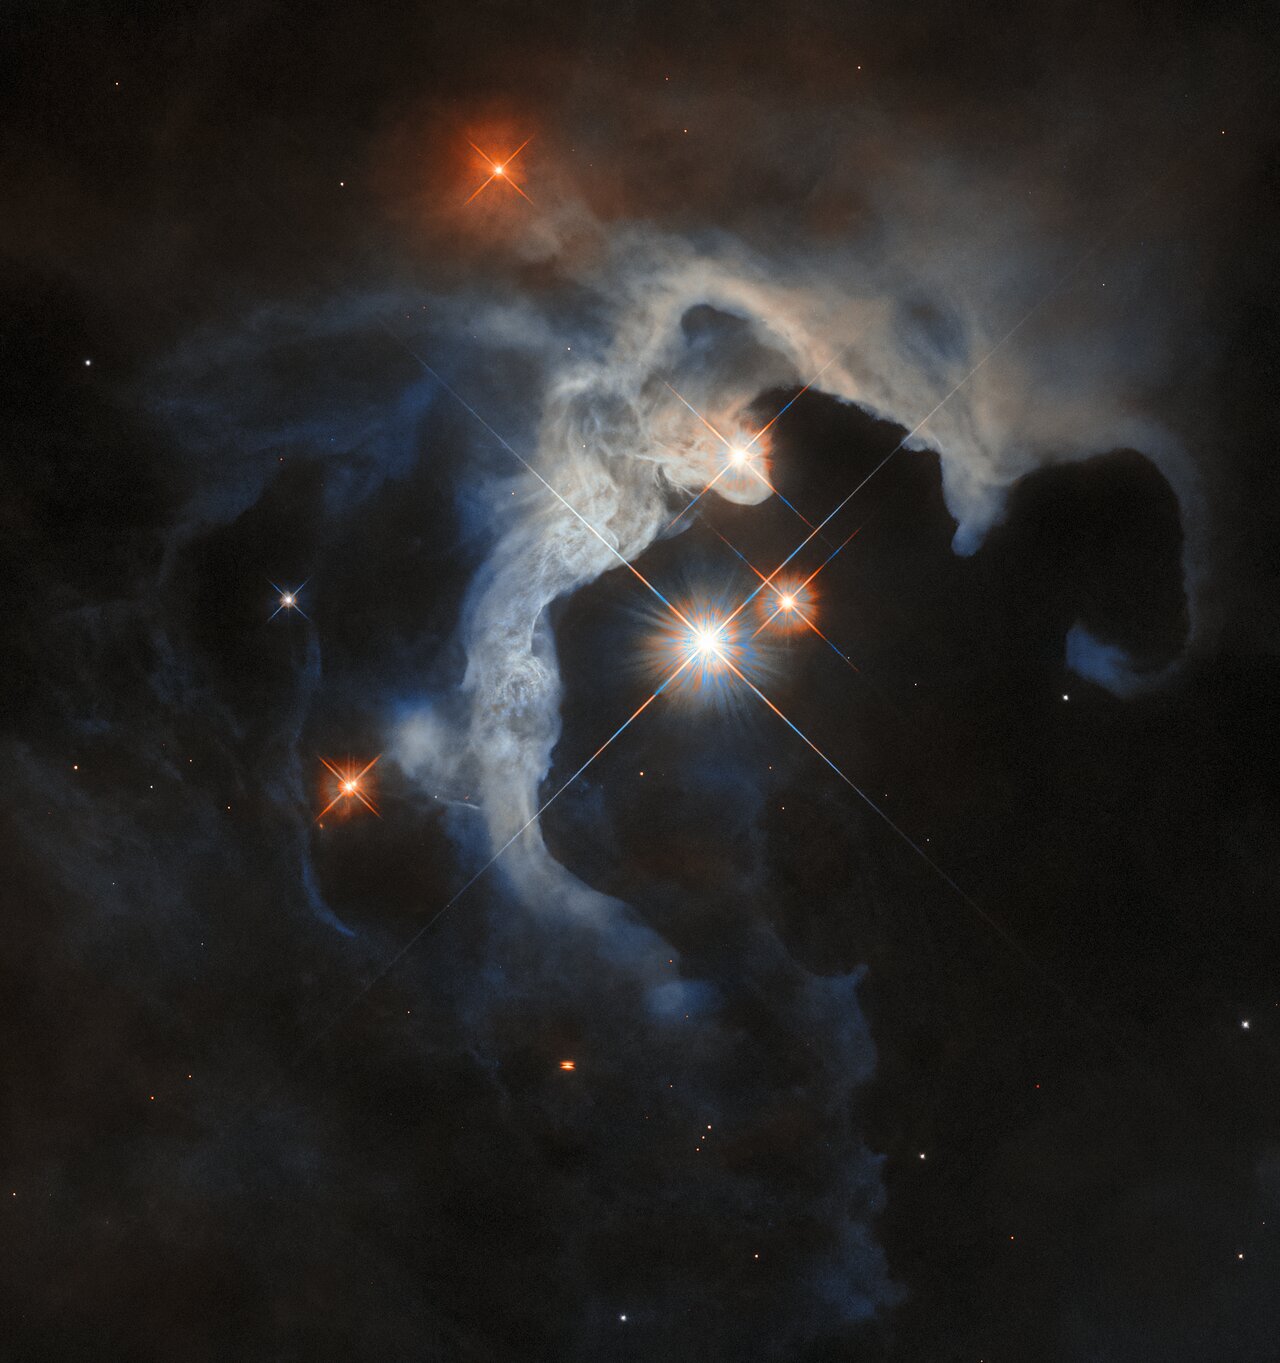
Third star destroying part of expanding shells surrounding binary Wolf-Rayet stars
From figure 3 of the paper.
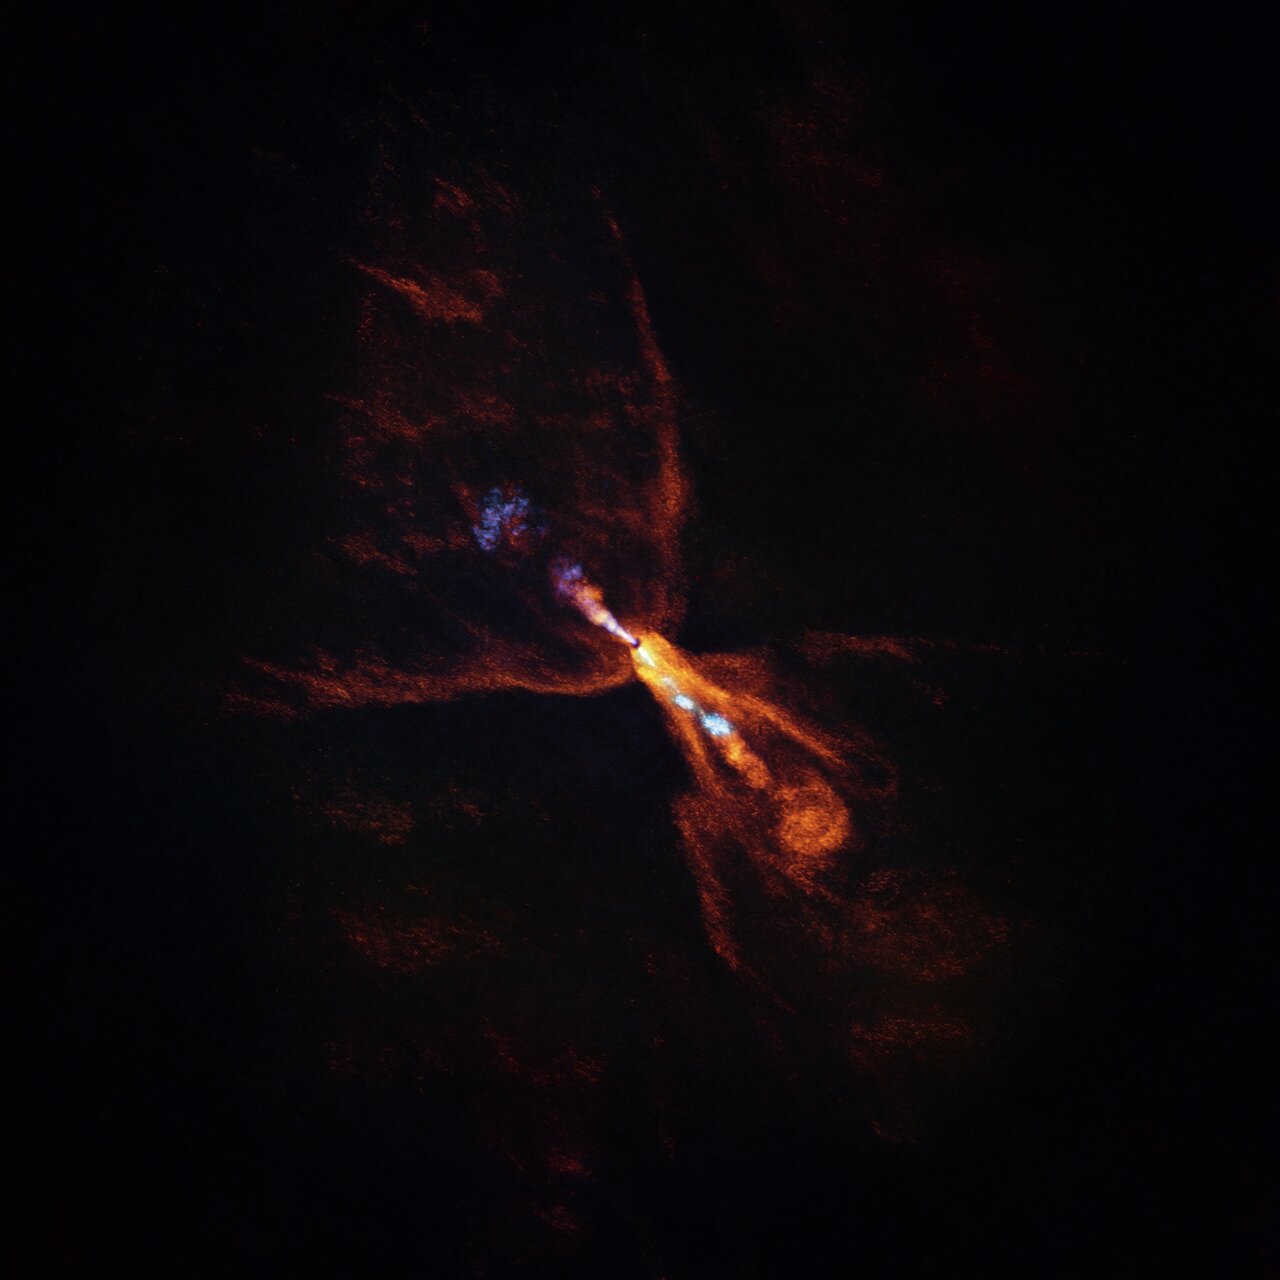
Using the Webb Space Telescope, astronomers think they can now disentangle the strange spiral shape of the expanding dust shells caused by the colliding powerful winds flowing from a binary pair of giant aging Wolf-Rayet stars, dubbed the Apep system.
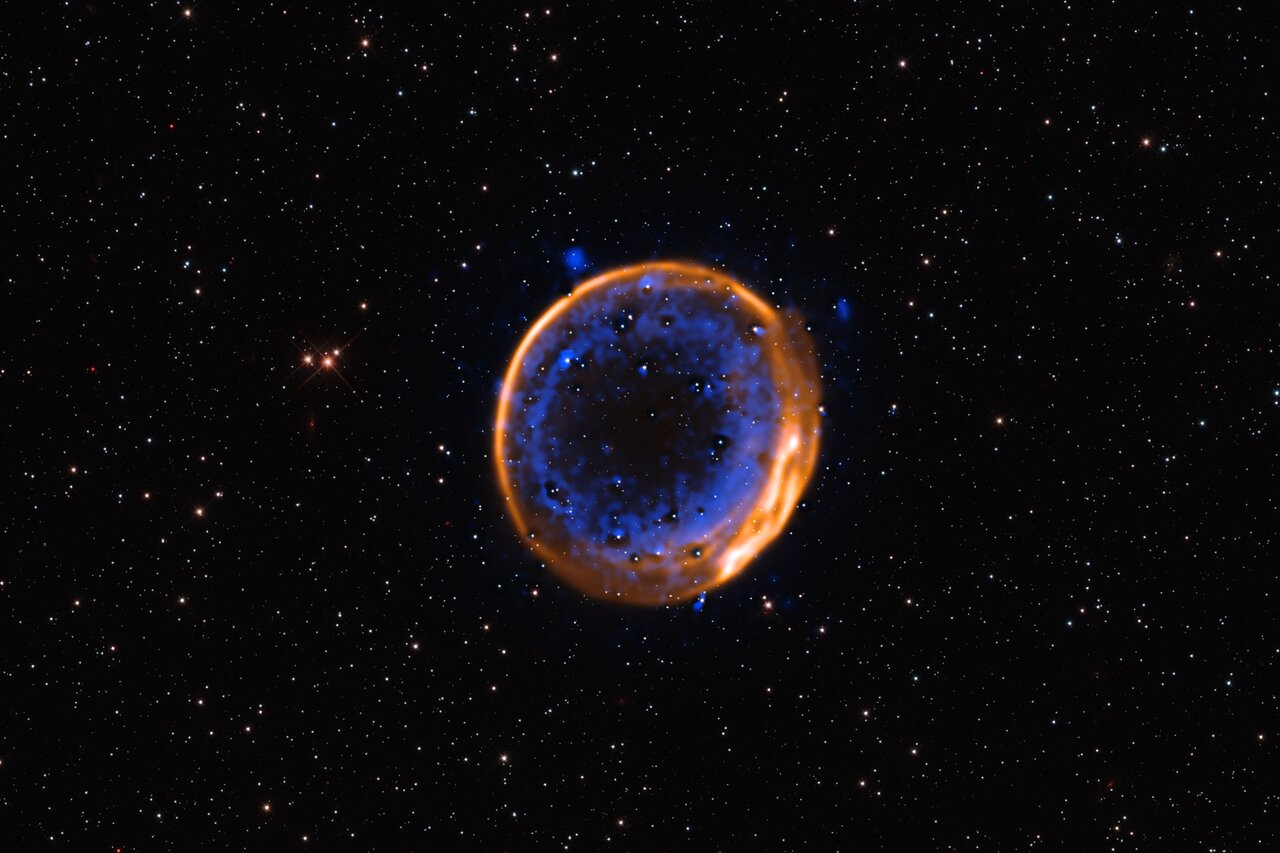
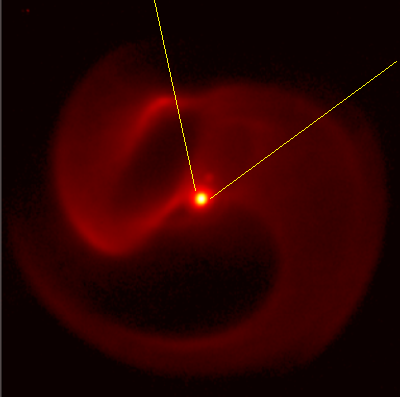
Apparently, a third smaller O-type star sits in the system, and is acting to block the winds and destroy the dust within them, carving out a large cavity in the spiral shells. The image to the right, produced by the Very Large Telescope in Chile, shows the spiral dust shells shaped by the strong solar winds flowing and colliding from the binary Wolf-Rayet stars (the bright dot in the center). The O-type star can be seen just above them. The yellow lines indicate the empty cone. Without the O star computer models had predicted a very bright shell north of the binary, and its non-existence in VLT images caused these further Webb observations.
From the paper’s [pdf] conclusion:
The JWST observations of Apep reveal luminous circumstellar dust that support[s] … our finding that the O supergiant ‘northern companion’ is dynamically associated with the binary WR stars in Apep; this is the first time that dust destruction has been observed by a tertiary star in a colliding wind nebula, and marks Apep as part of a rare class of triple colliding wind binaries.
The dust produced by Wolf-Rayet stars is thought to be a major component in seeding the formation of later stars, such as our own Sun. Finding that a third star in the system can destroy that dust suggests (as always) that this process can be far more complicated that first believed.
Hat tip to BtB’s stringer Jay.
From figure 3 of the paper.
Using the Webb Space Telescope, astronomers think they can now disentangle the strange spiral shape of the expanding dust shells caused by the colliding powerful winds flowing from a binary pair of giant aging Wolf-Rayet stars, dubbed the Apep system.
Apparently, a third smaller O-type star sits in the system, and is acting to block the winds and destroy the dust within them, carving out a large cavity in the spiral shells. The image to the right, produced by the Very Large Telescope in Chile, shows the spiral dust shells shaped by the strong solar winds flowing and colliding from the binary Wolf-Rayet stars (the bright dot in the center). The O-type star can be seen just above them. The yellow lines indicate the empty cone. Without the O star computer models had predicted a very bright shell north of the binary, and its non-existence in VLT images caused these further Webb observations.
From the paper’s [pdf] conclusion:
The JWST observations of Apep reveal luminous circumstellar dust that support[s] … our finding that the O supergiant ‘northern companion’ is dynamically associated with the binary WR stars in Apep; this is the first time that dust destruction has been observed by a tertiary star in a colliding wind nebula, and marks Apep as part of a rare class of triple colliding wind binaries.
The dust produced by Wolf-Rayet stars is thought to be a major component in seeding the formation of later stars, such as our own Sun. Finding that a third star in the system can destroy that dust suggests (as always) that this process can be far more complicated that first believed.
Hat tip to BtB’s stringer Jay.