
Two giant clusters of galaxies on target for second collision

Click for full image.
Using telescopes both on Earth and in space, astronomers now think two giant clusters of galaxies that had collided previously have now stopping flying from each other and are on target for second collision.
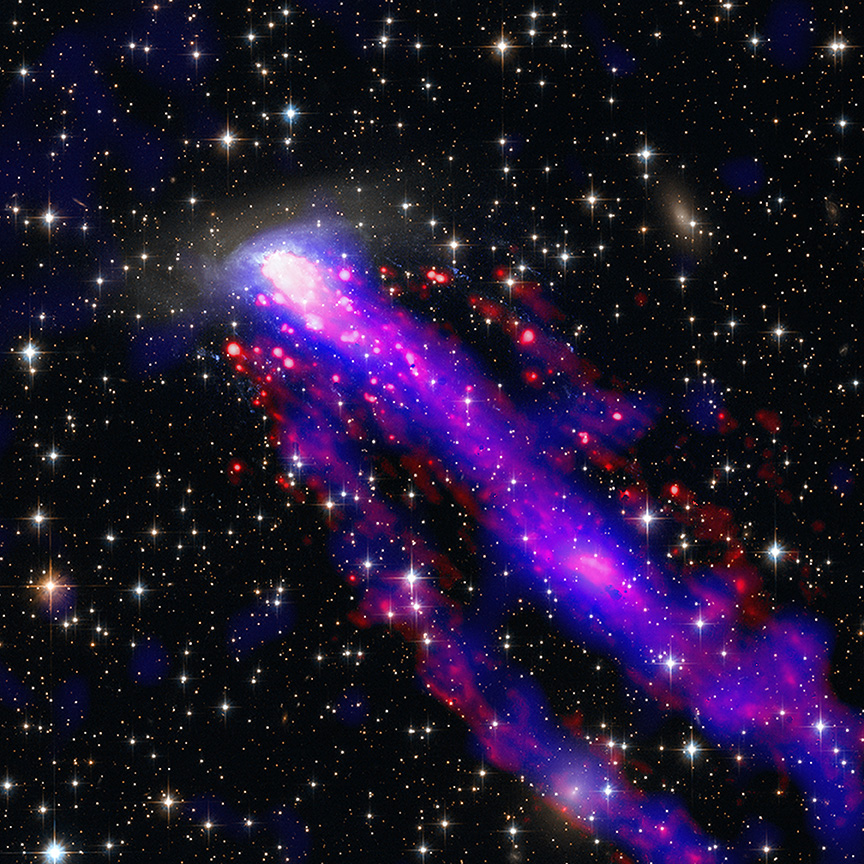
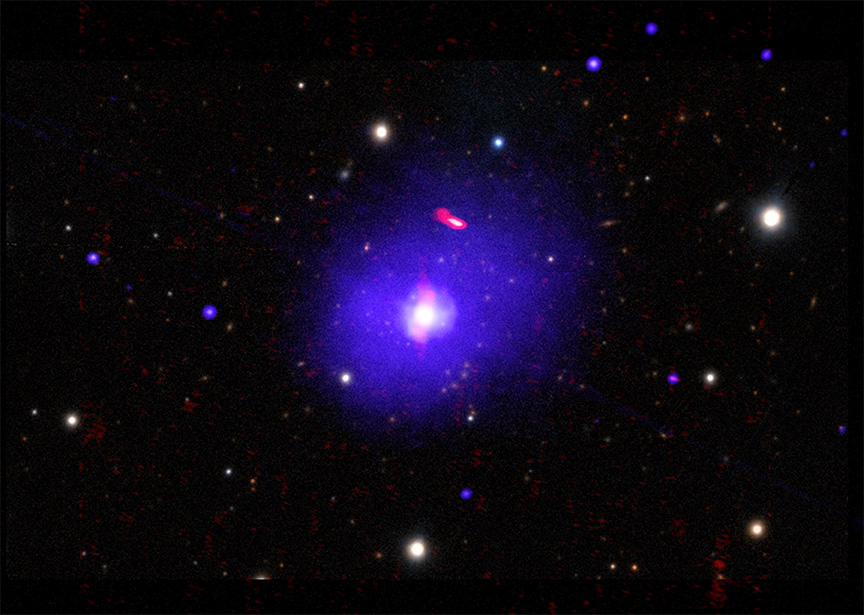
The annotated image to the right shows what we can see today. The two blue blobs near the center are the two galaxy clusters.
The galaxy cluster PSZ2 G181.06+48.47 (PSZ2 G181 for short) is about 2.8 billion light-years from Earth. Previously, radio observations from the LOw Frequency ARray (LOFAR), an antenna network in the Netherlands, spotted parentheses-shaped structures on the outside of the system. In this new composite image, X-rays from Chandra (represented in purple) and ESA’s XMM-Newton (blue) have been combined with LOFAR data (red) and an optical image from the Pan-STARRS telescope of the stars in the field of view.
These structures are probably shock fronts — similar to those created by jets that have broken the sound barrier — likely caused by disruption of gas from the initial collision about a billion years ago. Since the collision they have continued traveling outwards and are currently separated by about 11 million light-years, the largest separation of these kinds of structures that astronomers have ever seen.
Now, data from NASA’s Chandra and ESA’s XMM-Newton, a mission with NASA contributions, is providing evidence that PSZ2 G181 is poised for another collision. Having a first pass at ramming each other, the two clusters have slowed down and begun heading back toward a second crash.
When such giant object collide what really interacts the most is the gas and dust between the stars. The motions of the stars and galaxies of course get distorted by the pull of gravity, but there are almost never any crashes.
Click for full image.
Using telescopes both on Earth and in space, astronomers now think two giant clusters of galaxies that had collided previously have now stopping flying from each other and are on target for second collision.
The annotated image to the right shows what we can see today. The two blue blobs near the center are the two galaxy clusters.
The galaxy cluster PSZ2 G181.06+48.47 (PSZ2 G181 for short) is about 2.8 billion light-years from Earth. Previously, radio observations from the LOw Frequency ARray (LOFAR), an antenna network in the Netherlands, spotted parentheses-shaped structures on the outside of the system. In this new composite image, X-rays from Chandra (represented in purple) and ESA’s XMM-Newton (blue) have been combined with LOFAR data (red) and an optical image from the Pan-STARRS telescope of the stars in the field of view.
These structures are probably shock fronts — similar to those created by jets that have broken the sound barrier — likely caused by disruption of gas from the initial collision about a billion years ago. Since the collision they have continued traveling outwards and are currently separated by about 11 million light-years, the largest separation of these kinds of structures that astronomers have ever seen.
Now, data from NASA’s Chandra and ESA’s XMM-Newton, a mission with NASA contributions, is providing evidence that PSZ2 G181 is poised for another collision. Having a first pass at ramming each other, the two clusters have slowed down and begun heading back toward a second crash.
When such giant object collide what really interacts the most is the gas and dust between the stars. The motions of the stars and galaxies of course get distorted by the pull of gravity, but there are almost never any crashes.


