Aligned erosion lines of Perseverance Valley

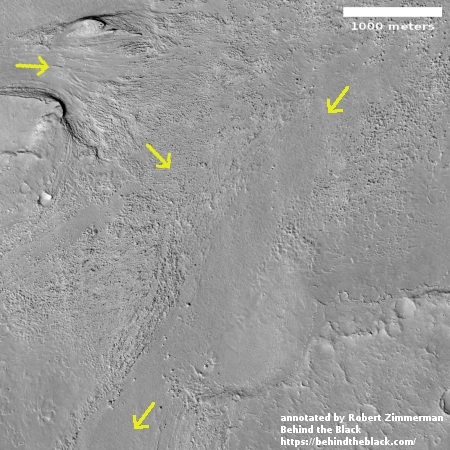
The uncertainty of science: Last week, while I was flying to Israel, the Opportunity science team announced the discovery of strange aligned erosion lines, what they are calling stone stripes, in Perseverance Valley.

The ground texture seen in recent images from the rover resembles a smudged version of very distinctive stone stripes on some mountain slopes on Earth that result from repeated cycles of freezing and thawing of wet soil. But it might also be due to wind, downhill transport, other processes or a combination.

…On some slopes within the valley, the soil and gravel particles appear to have become organized into narrow rows or corrugations, parallel to the slope, alternating between rows with more gravel and rows with less.

The origin of the whole valley is uncertain. Rover-team scientists are analyzing various clues that suggest actions of water, wind or ice. They are also considering a range of possible explanations for the stripes, and remain uncertain about whether this texture results from processes of relatively modern Mars or a much older Mars.

For those who are regular readers of Behind the Black, you already knew about a variation of this discovery back in November 2017, from my regular rover updates. Then, they discovered aligned groves in the gravel that looked to me like slickensides, erosion patterns produced by glacial activity. The science team told me, however, that they were favoring wind, not ice, as a primary cause, though that conclusion was far from certain.

In the press release last week, they focused more on the aligned erosion patterns in the fine gravel that appear to align perpendicular to the slope. Though they think they have found a comparable Earth-based phenomenon that might explain these patterns, it appears that the science team remains just as unsure of their cause as they are for the rocks.

Bitcoin-type crypto-currencies slowing SETI search for ET

The mad craze for crypto-currencies like Bitcoin is actually slowing the ability of SETI to obtain the computer chips they need, thus preventing them from expanding their search for alien signals.

Seti (Search for Extraterrestrial Intelligence) researchers want to expand operations at two observatories. However, they have found that key computer chips are in short supply. “We’d like to use the latest GPUs [graphics processing units]… and we can’t get ’em,” said Dan Werthimer.

Demand for GPUs has soared recently thanks to crypto-currency mining. “That’s limiting our search for extra-terrestrials, to try to answer the question, ‘Are we alone? Is there anybody out there?’,” Dr Werthimer told the BBC. “This is a new problem, it’s only happened on orders we’ve been trying to make in the last couple of months.”

Mining a currency such as Bitcoin or Ethereum involves connecting computers to a global network and using them to solve complex mathematical puzzles. This forms part of the process of validating transactions made by people who use the currency. As a reward for this work, the miners receive a small crypto-currency payment, making it potentially profitable.

Crypto-currencies like Bitcoin remind me of the tulip craze of the early 1800s. They have no real value, are not tied to any country and its wealth, and thus are essentially a speculator’s fantasy. A lot of people playing this game are going to be hurt by it eventually.

Posted from Modi’im Ilit, the West Bank. See this essay by me for some background about this place from my previous visits.

Massive flow on Mars

Massive flow on Mars

Cool image time! The image on the right, cropped to post here, comes from a Mars Reconnaissance Orbiter image that shows a massive relatively recent and dark slope streak that emanates out from a single point on the surface. (Note that the release at this link rotates the image so that north points down. I have rotated back so that north points up.)

Streaks form on slopes when dust cascades downhill. The dark streak is an area of less dust compared to the brighter and reddish surroundings. What triggers these avalanches is not known, but might be related to sudden warming of the surface.

These streaks are often diverted by the terrain they flow down. This one has split into many smaller streaks where it encountered minor obstacles. These streaks fade away over decades as more dust slowly settles out of the Martian sky.

Point of origin for flow

Location of flow, west of Olympus Mons

The MRO release focuses on the fingerlike breakup of the flow as it descends into sand-dune filled plain. What is more interesting to me is the terrain where this flow originated. A close-up of that area from the full image, shown on the right, reveals a feature that could be a wash running in line with the flow’s origin, and leading uphill to a dark feature that is a likely a cliff face. (The light in this image is coming from the southeast.)

This location, at 15.2N latitude, 214.9E longitude and shown by the small cross in the image on the right and captured from this page, is west of Olympus Mons, the largest volcano on Mars. This suggests to me that the originating feature might be an outlet from a lava tube, from which water suddenly seeped out to produce this massive slope streak. A look at the mesa from which this flow came, cropped from the full image and posted below the fold, shows numerous similar slope streaks of varying ages flowing out of this mesa, with some very faint because they occurred farther in the past. Some are even within the bowl at the top of the mesa.

Whether these come from lava tubes is definitely unclear, and I suspect I will be told by geologists not likely. The seeps however do suggest strongly that this mesa might be a very good location for future colonists to look for underground water ice. Since clouds form on the western slopes of Arsia Mons, the southernmost of the three giant volcanoes to the east of Olympus Mons, and that past glacial activity has been documented there, I wonder if some of these same conditions might also exist here, on the nearby terrain west of Olympus Mons.
» Read more

Trump to propose transitioning ISS to private hands post 2024

It appears that the Trump administration will propose in its 2019 budget, to be released today, to cease funding ISS in 2024 but to aim at a full transition to private control so that the station is not de-orbited when federal funding ceases.

The approach the administration has chosen is one that would end NASA funding of the ISS in 2025, while offering support for the development of commercial successors. “In support of enabling a timely development and transition of commercial capabilities in LEO where NASA could be one of many customers in the mid-2020s, the Administration is proposing to end direct Federal support for the ISS in 2025 under the current NASA-directed operating model,” the document states.

The 2019 budget proposal will offer $150 million “to enable the development and maturation of commercial entities and capabilities which will ensure that commercial successors to the ISS – potentially including elements of the ISS – are operational when they are needed.” The document says “increasing investments” above that $150 million will be included in future years’ budget requests.

The end of federal funding for the ISS would not necessarily mean the end of the station, or at least some parts of it, according to the document. “[I]t is possible that industry could continue to operate certain elements or capabilities of the ISS as part of a future commercial platform,” it states.

Not surprisingly, there are already hints that there will be massive opposition to such a plan, as it will shift power (and responsibility) from the government to private contractors. Some in Washington will not want the government to lose that power. And some private contractors are simply unwilling to shoulder the responsibility for figuring out how to make money from the station, something that is certainly possible since the development costs will have been fully paid for by the taxpayer.

Interstellar object Oumuamua tumbling chaotically

A new analysis of the data obtained when the interstellar object Oumuamua flew through the solar system in October 2016 suggests that it is tumbling in a chaotic manner, and that the surface is spotty.

Straight away, they discovered that ‘Oumuamua wasn’t spinning periodically like most of the small asteroids and bodies that we see in our solar system. Instead, it is tumbling, or spinning chaotically, and could have been for many billions of years.

While it is difficult to pinpoint the exact reason for this, it is thought that `Oumuamua impacted with another asteroid before it was fiercely thrown out of its system and into interstellar space. Dr Fraser explains: “Our modelling of this body suggests the tumbling will last for many billions of years to hundreds of billions of years before internal stresses cause it to rotate normally again.

To me, this data settles the question about whether Oumuamua is not an artificial structure. It is not. If it were, an impact that would have caused this kind of tumbling would have almost certainly destroyed it. Instead, it likely broke the original bolide up, producing many fragments, including Oumuamua and its elongated shape.

As for the object’s spottiness:

Dr Fraser explains: “Most of the surface reflects neutrally but one of its long faces has a large red region. This argues for broad compositional variations, which is unusual for such a small body.”

It is really a shame we couldn’t get a closer look before it sped away.

Narwhals love glaciers!

New research tracking fifteen narwhals over four years has revealed that they like to hang out near glaciers that are stable and do not have many calving events.

To better understand what glacier features narwhals prefer, Laidre and her colleagues used data from 15 narwhals outfitted with recorders that tracked each animal’s movements over four years in the 1990s and 2000s in Greenland’s Melville Bay, where narwhals congregate in summer. They combined this data with information about glaciers in Melville Bay over the same time period.

The researchers examined how narwhals behaved at the glaciers and collected information about each glacier’s physical properties to create models of narwhal behavior and tease out the animals’ preferences. “Narwhals like slow-moving, big walls of ice where conditions are still and serene instead of a lot of runoff and disturbance,” Laidre said.

The researchers don’t know why the narwhals prefer these glaciers. They think the freshwater could shock small marine critters that are food for fish, which narwhals eat. Narwhals are also close relatives of beluga whales, which also seek out freshwater in summer to shed their skin, and it is possible there is something similar going on at the glacier front, Laidre said.

This is fascinating research. What is especially refreshing about it is that the press release makes no mention of global warming, a omission that is proper but increasingly rare in the politicized science community.

New Horizons takes the most distant pictures from Earth ever taken

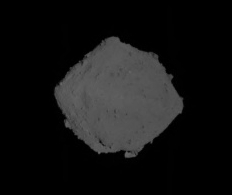
Kuiper Belt Object 2012 HE85

The New Horizons science team has released three images taken by the spacecraft from almost 3.8 billion miles from Earth, the most distant images ever taken.

The routine calibration frame of the “Wishing Well” galactic open star cluster, made by the Long Range Reconnaissance Imager (LORRI) on Dec. 5, was taken when New Horizons was 3.79 billion miles (6.12 billion kilometers, or 40.9 astronomical units) from Earth – making it, for a time, the farthest image ever made from Earth.

…LORRI broke its own record just two hours later with images of Kuiper Belt objects 2012 HZ84 and 2012 HE85 – further demonstrating how nothing stands still when you’re covering more than 700,000 miles (1.1 million kilometers) of space each day.

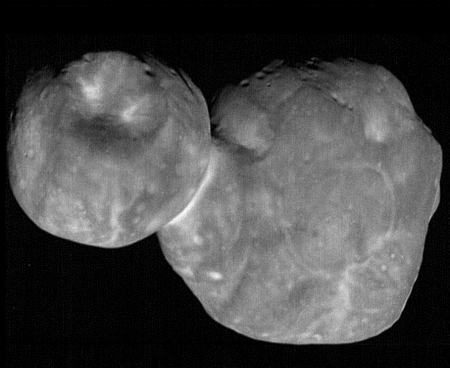
The images themselves are not spectacular to look at, though the two images of two different Kuiper Belt objects are the best ever taken of such objects, and certainly contain data that scientists will be able to use. The image on the right is one of these objects, 2012 HE85. For example, note how it does not appear to be round.

This exercise is in preparation for the January 1, 2019 fly-by of 2014 MU69, where the images will be sharp and detailed, and provide us a good look at such a distant object.

Mars rover update: February 8, 2018

Summary: Curiosity remains on Vera Rubin Ridge, though it has begun moving toward the point where it will move down off the ridge. Opportunity remains in Perseverance Valley, though it has finally taken the north fork down.

Before providing today’s update, I have decided it is time to provide links to all previous updates, in chronological order. This will allow my new readers to catch up and have a better understanding of where each rover is, where each is heading, and what fascinating things they have seen in the past year and a half.

These updates began when I decided to figure out the overall context of Curiosity’s travels, which resulted in my March 2016 post, Pinpointing Curiosity’s location in Gale Crater. Then, when Curiosity started to travel through the fascinating and rough Murray Buttes terrain in the summer of 2016, I stated to post regular updates. To understand the press releases from NASA on the rover’s discoveries it is really necessary to understand the larger picture, which is what these updates provide. Soon, I added Opportunity to the updates, with the larger context of its recent travels along the rim of Endeavour Crater explained in my May 15, 2017 rover update.

Now to talk about the most recent news from both rovers!
» Read more

More evidence of data tampering at NOAA

A close review of NOAA’s historic temperature data for New York shows that the agency appears to have been adjusting its records to cool past records or warm recent ones, without any explanation.

The author took a look at NOAA’s graph this year showing New York’s average January temperatures going back to 1890, and noticed that, according to that graph, 1943 was 0.9 degrees Fahrenheit warmer than 2014. Yet, a close look at the actual data from 1943 strongly suggested that 1943 was actually 2.7F warmer, not 0.9F. Somehow, NOAA had adjusted the numbers, either in 1943 or in 2014, to make the present warmer or the past colder. Further analysis, removing the one station that appears to have experienced the most heat island influence, thus distorting its long term record, suggested the adjustments might actually be worse.

These results, while certainly not covering all weather stations and years, are still consistent with every other close look at NOAA’s adjustments. Those adjustments always cool the past and warm the present, so as to provide confirmation of the theory of global warming. More important, there is never any explanation for those adjustments.

Of the seven sites, six have remained at the same locations, within a few yards. The station at Auburn has moved by a couple of miles, but is still in similar terrain.

There is no reason then why any major adjustments should have been required at any site.

Apologists for temperature tampering usually say it is all due to TOBS (Time of Observation). Yet the station at Ithaca, based at Cornell University, has used morning readings throughout. With a temperature difference of 2.9C, this is typical of the other sites, suggesting that any bias from TOBS is minor.

Either there is outright fraud going on here in the climate divisions at NOAA, or they are entirely blind to their own confirmation bias. Either way, this data once again illustrates why there is great distrust in their results. Global warming might be happening, and human activity might be causing it, but these strange adjustments in the data leave many in doubt.

Large study finds saturated fats good!

The uncertainty of science: A new and very large health study has found that eating a high fat diets is actually healthy, and that the previous government dietary recommendations are seriously flawed.

That’s the conclusion of a massive new study published in Lancet that followed 135,335 people in 18 countries on five continents. The study found that consumption of fat was associated with a lower risk of mortality, while consumption of carbohydrates was associated with a higher risk. It found that the kind of fat didn’t matter when it came to heart disease, and that saturated fat consumption was inversely related to strokes.

The researchers say, ever so politely, that “dietary guidelines should be reconsidered in light of these findings.”

I’m not sure this new study should be trusted that much either. Regardless, it does indicate that the field of diet and health has a great deal of uncertainty, and that we should all consider with great skepticism any recommendations from the government, based on that science.

More info on Trappist-1 solar system

Astronomers, using ground-based and orbiting telescopes, have obtained more information about the seven Earth-sized exoplanets that orbit the star Trappist-1 forty light years away.

First, a European effort has found that the planets probably all have loads of water.

A new study has found that the seven planets orbiting the nearby ultra-cool dwarf star TRAPPIST-1 are all made mostly of rock, and some could potentially hold more water than Earth. The planets’ densities, now known much more precisely than before, suggest that some of them could have up to 5 percent of their mass in the form of water — about 250 times more than Earth’s oceans. The hotter planets closest to their parent star are likely to have dense steamy atmospheres and the more distant ones probably have icy surfaces. In terms of size, density and the amount of radiation it receives from its star, the fourth planet out is the most similar to Earth. It seems to be the rockiest planet of the seven, and has the potential to host liquid water.

Data from the Hubble Space Telescope has meanwhile found that three of the seven planets do not have hydrogen in their atmospheres, which at first seems to contradict the European data.

The Hubble observations took advantage of the fact that the planets cross in front of their star every few days. Using the Wide Field Camera 3, astronomers made spectroscopic observations in infrared light, looking for the signature of hydrogen that would filter through a puffy, extended atmosphere, if it were present. “The planets are close enough to their host star, and they have very short orbital periods, which means there are lots of opportunities to make observations,” Lewis said.

Although Hubble did not find evidence of hydrogen, the researchers suspect the planetary atmospheres could have contained this lightweight gaseous element when they first formed. The planets may have formed farther away from their parent star in a colder region of the gaseous protostellar disk that once encircled the infant star.

The Hubble results are actually not very significant. They show only that they did not detect hydrogen in the atmospheres of these three exoplanets, which does not mean it isn’t there. Moreover, this Hubble press release appears to have been issued as much to sell the James Webb Space Telescope and to say that Hubble is looking at Trappist-1 also!

I should add that all of these results are very uncertain. We are looking at something that is very small and is also very far away. Any data obtained is certainly not a precise measurement of what is actually there, only a mere hint.

Sunspot update for January 2018

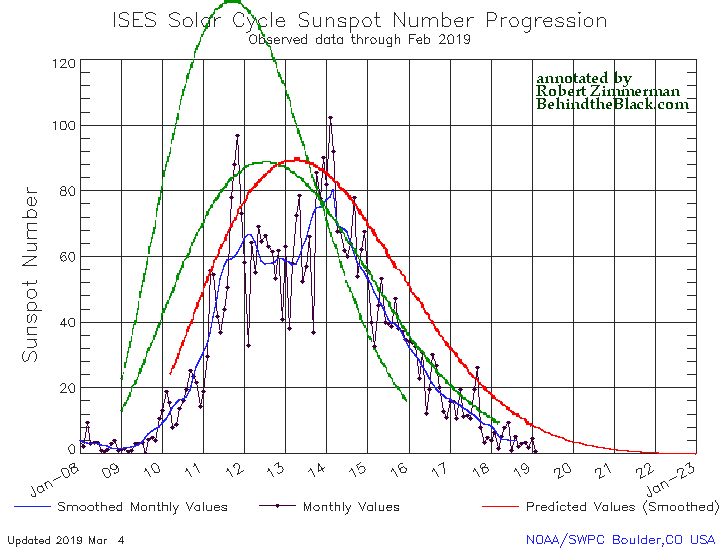
Today NOAA posted its monthly update of the solar cycle, covering sunspot activity for January 2018. Below is my annotated version of that graph.

As you can see, the low sunspot activity of the past two months continued in January. November 2017 remains the most inactive month for sunspots since the middle of 2009. January is now the second most inactive month, with December a very close third.

January 2018 Solar Cycle graph

The graph above has been modified to show the predictions of the solar science community. The green curves show the community’s two original predictions from April 2007, with half the scientists predicting a very strong maximum and half predicting a weak one. The red curve is their revised May 2009 prediction.

Though activity continues to track close to but considerably below the 2007 weak prediction, the difference appears to be increasing as the ramp down to solar minimum continues. While I have said in past updates that the trend suggests an early arrival of the solar minimum, a close look at the previous ramp down in 2007 and 2008 shows that when activity became this weak, the ramp down slowed considerably. This previous pattern suggests that we could see another year or two of similarly low activity before the minimum arrives.

Regardless, the low activity, this soon, continues to suggest that the next maximum will also be weak, and might even not come at all, as some solar scientists have proposed. Instead, we might be heading toward another Grand Minimum, with no significant sunspots for decades.

Will that Grand Minimum produce cold weather worldwide, as it appears to have done during the last Grand Minimum in the 1600s? There is circumstantial evidence in the past decade that it might. We will not know, however, until it happens, and that possibility remains very uncertain.

Polar bears are starving! (NOT)

Fake science: Two articles yesterday from the so-called science journals Nature and Science today illustrate once again how pervasive the corruption in the climate field has now spread to almost anything that relates to climate.

Both articles refer to a paper published this week in Science, though the Nature article is far more detailed and longer. Researchers had tracked 9 polar bears during the spring months in three separate years, and had found that 5 of them had lost weight during this time period. From the Nature article:

Polar bear calorie use in spring

On average, the bears needed nearly 12,325 kilocalories per day — 1.6 times more energy than previously thought. To meet such energy demands, a female bear on the spring sea ice should eat either one adult or 19 newborn ringed seals every 10 to 12 days, the scientists concluded.

But nearly half of the bears didn’t catch enough food — and were forced to fast or scavenge carcasses. These animals lost 10% of their body mass over about 10 days. “That’s dramatic,” says physiologist John Whiteman at the University of New Mexico in Albuquerque. It’s as if a person weighing 80 kilograms shed 8 kilograms in just over a week, he says.

Catching enough to eat isn’t the only challenge polar bears face. As rising temperatures thin the sea ice, wind and currents make it drift faster on the ocean surface. “Think about a treadmill,” says Merav Ben-David, a wildlife ecologist at the University of Wyoming in Laramie. If the sea ice moves faster under their paws, polar bears have to walk faster — or for longer — to remain in the same spot3, which forces them to expend more energy, she says. [emphasis mine]

Oh my god! The polar bears are dying! And global warming is killing them!

What a joke. A quick look at the graph above, captured from the Science video, reveals that what the researchers really found is that four bears lost weight, four bears gained weight, and one stayed about the same. The bears studied weren’t “starving,” they represented what looks like an ordinary cross-section of population.

Moreover, this study is incredibly uncertain in that it only studied 9 bears, and only during the spring months during three years. What happens during the rest of the year? What would happen if they studied a larger population? While the data here teaches us something about the polar bear’s diet, calorie intake and calorie requirements, it is absolutely insufficient to provide any conclusions about the future of the bear population.

Worse, while both articles were quick to mention the threat from global warming, neither mentioned that the polar bear population continues to thrive, and has been doing so for the past decade, with no declines in almost all Arctic regions.

Further compounding the bad reporting here, while both articles repeated their religious belief in global warming and the impending disappearance of the Arctic icecap, there remains zero evidence in all data gathered of the ice pack by satellites and ground research that the icecap is shrinking significantly. In fact, while it had shown a steady decline through the first decade of the 21st century, in the past few years there has been a marked recovery. While these scientists might want the ice cap to disappear for political reasons, it simply isn’t doing so.

This is junk journalism and fake science. In fact, it is downright pitiful. That the reporting at such important science journals as these has become so slipshod speaks badly for the future of science in general.

Fractures in the floor of Occator Crater

Fractures in floor of Occator Crater

Cool image time! The Dawn science team has released an image of Ceres, cropped to post here in the right, that shows a spiderweb of fractures radiating out from a single point in the floor of Occator Crater.

These fractures have been interpreted as evidence that material came up from below and formed a dome shape, as if a piston was pushing Occator’s floor from beneath the surface. This may be due to the upwelling of material coming from Ceres’ deep interior. An alternative hypothesis is that the deformation is due to volume changes inside a reservoir of icy magma in the shallow subsurface that is in the process of freezing, similar to the change in volume that a bottle of water experiences when put in a freezer.

In the image sunlight is coming from the right. This fractured area can be seen in this earlier simulated oblique image of Occator Crater, in the southwest corner of the crater floor, well away from the crater’s more well known bright areas.

Curiosity takes a panorama that shows its entire journey so far

Cool image time! The Curiosity science team has released a panorama taken in October 2017 that looks north across the floor of Gale Crater and shows the rover’s entire journey since it landed in 2012.

Rather than post the image here, I have posted below the fold a video produced by the science team that pans across the entire panorama, and then shows where Curiosity has traveled in that panorama. Look close, and you will realize how truly little of Mars we have so far explored.
» Read more

The landing site of NASA’s next Mars lander

InSight's landing site on Mars

InSight, NASA’s next Mars lander scheduled to launch later this year (two years late), is aiming for a landing site in a region called Elysium Planitia, a flat plain north of the equator.

InSight’s scientific success and safe landing depends on landing in a relatively flat area, with an elevation low enough to have sufficient atmosphere above the site for a safe landing. It also depends on landing in an area where rocks are few in number. Elysium Planitia has just the right surface for the instruments to be able to probe the deep interior, and its proximity to the equator ensures that the solar-powered lander is exposed to plenty of sunlight.

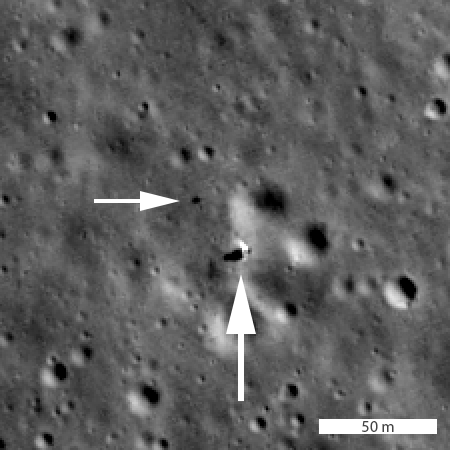
The target area is centered at 4.5 N latitude and 135.9 East longitude. If you zoom in on that latitude and longitude at the archive of Mars Reconnaissance Orbiter (MRO) high resolution images, you get the red blob on the right, which shows how many images they have taken of this area in preparation for InSight’s mission. The X indicates the location of lat/long above.

Below the fold is a reduced version of the MRO image for the center of this target area. The black spots near the center are thought to be a recent crater impact site. In general, this image shows an area with more features than the region around it. Most of the landing area of Elysium Planitia is a featureless flat plain with scattered small craters. Since InSight is not a rover, where it lands will be where it does its research, so there was no reason to pick a site with lots of interesting surface features. Moreover, since InSight is focused not on studying the surface but the interior geology of Mars, it matters little what the surface looks like anyway. One instrument will be a seismograph, while another will insert a thermometer about sixteen feet into the ground to measure the interior temperature.
» Read more

Weird Martian geology: Kaiser Crater

Kaiser Crater bedrock

Cool image time! This week JPL’s image site highlighted a picture taken by Mars Odyssey of the floor and dunes inside Kaiser Crater, located to the west of Helles basin in an area dubbed the Noachis Region.

To my eye, the Mars Odyssey picture was interesting, but not worth a post here on Behind the Black. However, I decided to take a look at what HiRise, the high resolution camera of Mars Reconnaissance Orbiter (MRO), had taken of the same area, just out of curiosity. A search at the master HiRise image site at the same latitude and longitude (-45 latitude, 180 longitude) showed that HiRise had imaged a part of the same area, but at much higher resolution.

When I zoomed in on this hi resolution image I came across some interesting and weird geology, cropped to show here on the right. Now this, I thought, is worth posting. Notice how the dark tracks, caused by dust devils, leave no tracks as they cut across the brighter areas. Obviously, these bright areas have no dust or sand, and are likely solid bedrock of some kind. The depressions might be craters, but they also might not. The raised area around the depressions might have been caused by the impact, or it might have been caused by some internal geological process that caused the depression while also raising the surrounding bulge. Since then the wind has been steadily depositing sand in the depressions, causing it to get trapped there.

Scientists created tiny projected 3D image using light and lasers

While the technique and result is a far cry from a projected image of Princess Leia begging for help, scientists have now been able to create a tiny but simple projected 3D image using light and lasers.

Using a barely visible violet laser controlled by mirrors, the researchers trapped a cellulose particle and moved it rapidly through space. The quickly moving mote was illuminated by other, colored lasers, making it visible. By moving the trapped particle fast enough, the researchers were able to trace out patterns in the air that, to an observer, appeared as a single image. “It’s not unlike when you have a sparkler at nighttime and you draw your name in the air,” Smalley says. “We know intellectually that it’s just one spot, but our eyes will integrate if it goes too fast.”

The researchers admit that this research is not aimed at producing 3D TV. Instead, they say its best use would be to provide 3D images of tiny difficult-to-see places, such as human internal organs that physicians might need to travel through remotely to complete a surgery. The images, provided prior to surgery, would help make that surgery safer and more reliable.

Titan’s liquid hydrocarbon seas have a global sea level

New research using Cassini data has revealed that the liquid hydrocarbon oceans of Saturn’s moon Titan have a global sea level, with some small lakes perched at higher elevations.

The new study suggests that elevation is important because Titan’s liquid bodies appear to be connected under the surface in something akin to an aquifer system at Earth. Hydrocarbons appear to be flowing underneath Titan’s surface similar to the way water flows through underground porous rock or gravel on Earth, so that nearby lakes communicate with each other and share a common liquid level.

Mars rover update: January 16, 2018

Summary: Both rovers have moved little in the past month, Opportunity because it is in a good science location and because it must save energy during the winter and Curiosity because it is in a geological location so good the scientists appear to almost be going ga-ga over it.

Curiosity

null

For the overall context of Curiosity’s travels, see Pinpointing Curiosity’s location in Gale Crater.

In the month since my December 18 update, Curiosity has continued to head south rather than east as originally planned (as indicated by the dotted yellow line in the traverse map to the right). Moreover, the rover has not moved very much, because the science team has decided that there is just too much significant geology in this area on Vera Rubin Ridge, also part of a geological unit they have dubbed the Hematite Unit.

Right now the rover is located at an area they call “Region e,” one of the three patches I have also indicated on the image to the right. From the second update below:

This location is a slight depression with exposed fractured bedrock that appears more “blue” from orbit than the surrounding region. In addition, the orbital evidence and observations from the ground suggest that this location is similar to “Region 10” that we visited just last week, which was shown to have some pretty spectacular small-scale features that were of particular interest to many on the science team. As a result, the team was very excited to reach “Region e” and begin our scientific investigation!

The last few updates on the Curiosity mission update page indicate the excitement the geologists have for this site:
» Read more

The known ice cliffs on Mars

Last week there was a big NASA story about the discovery of eight locations on Mars where the evidence strongly suggests that these spots have cliff faces with exposed layers of water ice.

The press release however did not provide an overview about where those eight locations were. Only two locations were given, one for a scarp in Milankovič Crater in the northern hemisphere, and one in an area called Promethei Terra, located in the remote cratered highlands in the southern high-mid-latitudes.

The location of known ice scarps on Mars

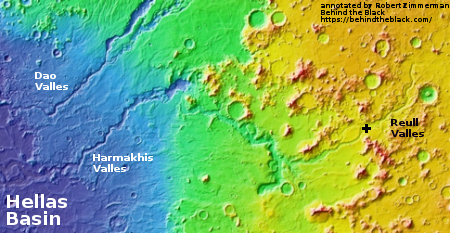
After much digging (and some assistance from John Batchelor) I was finally able to obtain the latitudes and longitudes of all 8 locations. All but the scarp in Milankovič Crater crater (shown by the white dot north of Olympus Mons) are located in the white rectangular box shown to the south and east of Hellas Basin, the area with Mars’ lowest elevation. This part of Mars is not well imaged with the high resolution camera on Mars Reconnaissance Orbiter (indicated by the fewer number of red squares in the image), mostly because it appears relatively boring from a distance. Nothing appears to be there for hundreds and hundreds of miles except craters, sand, and sand dunes..

The discovery of these scarps in this area however changes the picture. It suggests that cratered highlands that surround Hellas Basin, including those close to the planet’s equator, could contain similar buried layers of ice. More research is necessary to pin down more locations, especially those closer to the equator where conditions might be more hospitable for a colony.

Moreover, educated readers of Behind the Black have previously noted that because of Hellas Basin’s low elevation the air pressure there is thicker, and therefore the location has some advantages as a potential colony location. These ice scarps raise the value of Hellas Basin considerably, as they suggest that such layers could easily be exposed as you descend into Hellas Basin. If such layers are exposed on the northern flanks of the basin, they would be at latitudes of around 25 to 30 degrees south, a much more friendly latitude for settlement.

A movie of Jupiter’s south polar region

Cool movie time! Using Juno images, a citizen scientist has created a short movie showing two complete rotations of Jupiter’s south polar regions. I have embedded the movie below the fold. It is definitely worth watching. As he notes,

Due to Jupiter’s low axial tilt we never see more than roughly one half of the area around the poles in sunlight at any given time. However, it is interesting to see what Jupiter’s polar regions would look like if things were different and a big area around the poles was illuminated. This rotation movie shows what Jupiter’s south polar region would look like near the time of southern summer solstice if Jupiter’s axial tilt was much greater than it is, i.e. comparable to Saturn’s axial tilt.

He also notes the puzzling fact that, though Jupiter and Saturn are both gas giants, unlike Saturn Jupiter does not have a vortex at its poles. In fact, he points out how none of Jupiter’s storms are centered at the pole. Why one gas giant should have such pole-centered vortexes while another does not is a big mystery that illustrates how very little we know about planetary formation and evolution.

The two rotations also do not show any changes in the storms, not because they aren’t changing but because the images used were taken over too short a time span to show this.
» Read more

Exposed mid-latitude ice deposits found on Mars

Scientists have discovered eight locations on Mars where underground ice appears to be exposed on cliff faces

The scarps directly expose bright glimpses into vast underground ice previously detected with spectrometers on NASA’s Mars Odyssey orbiter, with ground-penetrating radar instruments on MRO and on the European Space Agency’s Mars Express orbiter, and with observations of fresh impact craters that uncover subsurface ice. NASA sent the Phoenix lander to Mars in response to the Odyssey findings; in 2008, the Phoenix mission confirmed and analyzed the buried water ice at 68 degrees north latitude, about one-third of the way to the pole from the northernmost of the eight scarp sites.

The important thing about this discovery is that, though we have known for several years that water ice exists underground in the Martian mid-latitudes, this is the first time we have identified specific places there it is exposed and accessible.

Unfortunately, the press release does not provide the specific eight locations, except for the one image, which is located in the southern hemisphere in a region called Promethei Terra, far from areas that have been studied much more extensively. I will do some digging to see if I can identify the other seven locations.

NASA funds a cubesat-sized ultra-violet telescope

NASA has funded a cubesat-based ultra-violet telescope to launch in 2021.

SPARCS is a CubeSat built of six cubical units, each about four inches on a side. These are joined to make a spacecraft two units wide by three long in what is termed a 6U spacecraft. Solar power panels extend like wings from one end. “In size and shape, SPARCS most resembles a family-size box of Cheerios,” Shkolnik said.

The spacecraft will contain three major systems — the telescope, the camera, and the operational and science software. Along with Shkolnik, SESE astronomers Paul Scowen, Daniel Jacobs, and Judd Bowman will oversee the development of the telescope and camera, plus the software and the systems engineering to pull it all together. The telescope uses a mirror system with coatings optimized for ultraviolet light. Together with the camera, the system can measure very small changes in the brightness of M dwarf stars to carry out the primary science of the mission.

As I have noted numerous times recently, the space industry is splitting between large manned projects and tiny unmanned ones. While certain unmanned probes will always have to be larger, the ability to build and launch the same capabilities at a smaller size is lowering cost and allowing more probes to be launched.

NASA renames Swift telescope to honor Neil Gehrels

NASA has renamed the Swift space telescope, designed to quickly detect and observe fast transient events in space like gamma ray bursts, to honor the late Neil Gehrels, the man who led the project from day one.

During a presentation at a NASA town hall meeting at the 231st Meeting of the American Astronomical Society here, Thomas Zurbuchen, NASA associate administrator for science, said that Swift would now be known as the Neil Gehrels Swift Observatory.

Gehrels, who died in February 2017, had been principal investigator for Swift, a mission launched in 2004. The spacecraft was designed to be able to rapidly respond to transient events, such as gamma-ray bursts, observing them at wavelengths ranging from gamma rays to visible light.

“Neil wore many hats in service to the astrophysics community,” said Paul Hertz, director of NASA’s astrophysics division, at a later press conference at the meeting. In addition to being the principal investigator for Swift, had served as project scientist on the Compton Gamma-Ray Observatory and Fermi missions. At the time of his death last year he was project scientist for the Wide-Field Infrared Survey Telescope, NASA’s next flagship astronomy mission after the James Webb Space Telescope.

Knowing astronomers, they will now refer to this observatory as the NGSO. Not I. It will be “Gehrels Swift” to me, whenever I need to mention it. Gehrels was one of the most friendly, open, and easy-to-work-with astronomers I ever had to deal with. He is sorely missed.

A spectacular collapse feature at Arsia Mons

Collapse at Arsia Mons

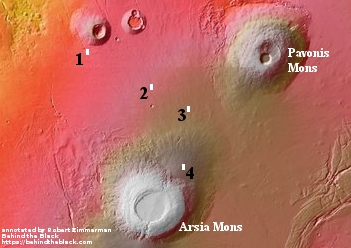
Cool image time! This post could be called an update to my January 8th post, Exploring Arsia Mons. In that post I had compiled together the ten images of Arsia Mons, the southernmost volcano in the line of three giant volcanoes on Mars, that JPL had highlighted over several weeks in early January.

Today, I decided to do some of my own exploration of some of the many images taken of Arsia Mons by all of the Martian orbiters. My goal had been to explore the volcano’s western slopes (an area that had not been featured in the JPL releases) because that is the area where research has found evidence of past glacial activity as well as seasonal water clouds. I haven’t finished that survey, but in the process I came across a spectacular image of a collapse that had been visible in image nine of the January 8th post, but did not stand out there because of the lighting. The image on the right is that better image, cropped to focus in on the collapse itself.

The material at the base of the wall resembles piled up mud, which suggests this collapse is a Martian version of a mud slide. If so, it also suggests the presence of liquid. At the same time, the muddy look might not be from liquid but because of the lighter Martian gravity causing avalanches to be appear different there. The light gravity means material is not as dense, so when it collapses it might break apart more easily into a sandy type flow.

I am only an amateur geologist, so my theories here should not be taken very seriously. Nonetheless, I am sure there are planetary geologists who have looked at this closely because of the information about Martian geology that they can glean from it. I’d be curious to hear their thoughts.

Meanwhile, my exploration of the western slopes of Arsia Mons will continue. In Pioneer the science fiction book I wrote in the early 1980s (now available), I placed my Martian colony in Mangala Valles, a meandering canyon to the west of Olympus Mons that feeds out from the higher southern regions into the lower northern flat plains where even then some scientists thought an ocean might have once existed. My thinking then was that this might be a good location to find underground water. It now appears, with our greater knowledge, that the slopes of the volcanoes themselves might be more promising, and I am curious to find the most likely places in this region where a future colony might end up.

Almost 500 science papers in 2017 challenge “global-warming consensus”

The uncertainty of science: A survey of climate papers published in 2017 shows that 485 directly challenged the so-called “consensus” that activists claim exists about global warming.

Author Kenneth Richard found that during the course of the year 2017, at least 485 scientific papers were published that in some way questioned the supposed consensus regarding the perils of human CO2 emissions or the efficacy of climate models to predict the future.

According to Richard’s analysis, the 485 new papers underscore the “significant limitations and uncertainties inherent in our understanding of climate and climate changes,” which in turn suggests that climate science is not nearly as settled as media reports and some policymakers would have people believe.

This really is not a surprise for anyone who spends even a little time reading actual climate research. If you do, you immediately realize that the absurd claims of politicians (mostly Democrats) and activists about the certainty of human-caused global warming are based on their complete ignorance of the science. Some examples:

My point isn’t to say that human-caused global warming isn’t happening. We simply don’t know. The evidence so far is very inconclusive. And for those who advocate this theory, their own models have consistently failed to match the data. Skepticism is called for, which by the way is actually the hallmark of good science.

1 126 127 128 129 130 272