How deadly is COVID-19, really?
It is now almost twenty months since COVID-19 crossed the ocean from China and arrived in the United States. When it arrived there was great fear as its true deadliness at that time was unknown. Though the sparse data from China, South Korea, and the Diamond Princess cruise ship suggested it was merely a variation of the annual flu and not something to fear, the computer models put forth by a variety of scientific institutions at that time instead predicted millions were about die from it.
No one really knew for certain. Some legitimately argued that the lockdowns, mask mandates, and oppressive restrictions on normal activities were necessary to limit its harm.
Almost two years have now passed, and we can now assess realistically which of those scenarios was accurate. To best understand these things I strongly believe is always best to look at the big picture, the larger and bigger the better. In this case, let’s look at the entire U.S. and measure COVID-19’s impact by noting the total number of people in the United States who have become infected by COVID since its arrival and comparing that with the total number who have died. These actual numbers will tells us truly how deadly COVID has been, and whether our continued fear of it is justified.
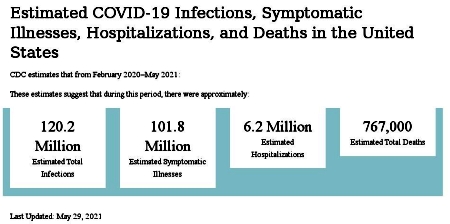
CDC’s COVID-19 estimates as of May 2021
According to CDC estimates, as of May 2021, 120.2 million Americans had been infected by COVID, of which 101.8 million experienced actual symptoms. The CDC in these same estimates in May calculated that 767,000 people had died from COVID.
These CDC estimates were further supported by a Nature peer review study published in August 2021, which estimated that by the end of 2020 100 million Americans had been infected with COVID.
» Read more