Cassini’s last flybys of Enceladus

As Cassini approaches the end of its decade-long mission at Saturn it will begin its last series of flybys of the moon Enceladus starting October 14.

Images will arrive a day or two afterward. The last two flybys will take place in late October and then in December, with the second October flyby getting closest, only 30 miles from the surface.

Beginning next year they will shift the spacecraft’s orbit so that it can get a better look at Saturn’s poles during its last two years. In that orbit flybys of the moons cannot be done.

New weather maps of Jupiter

Using the Hubble Space Telescope astronomers have compiled a new set of maps of Jupiter, showing changes in the gas giant’s bands and spots, including the Giant Red Spot.

The scientists behind the new images took pictures of Jupiter using Hubble’s Wide Field Camera 3 over a ten-hour period and have produced two maps of the entire planet from the observations. These maps make it possible to determine the speeds of Jupiter’s winds, to identify different phenomena in its atmosphere and to track changes in its most famous features.

The new images confirm that the huge storm, which has raged on Jupiter’s surface for at least three hundred years, continues to shrink, but that it may not go out without a fight. The storm, known as the Great Red Spot, is seen here swirling at the centre of the image of the planet. It has been decreasing in size at a noticeably faster rate from year to year for some time. But now, the rate of shrinkage seems to be slowing again, even though the spot is still about 240 kilometres smaller than it was in 2014.

Solar ramp down jumps slightly

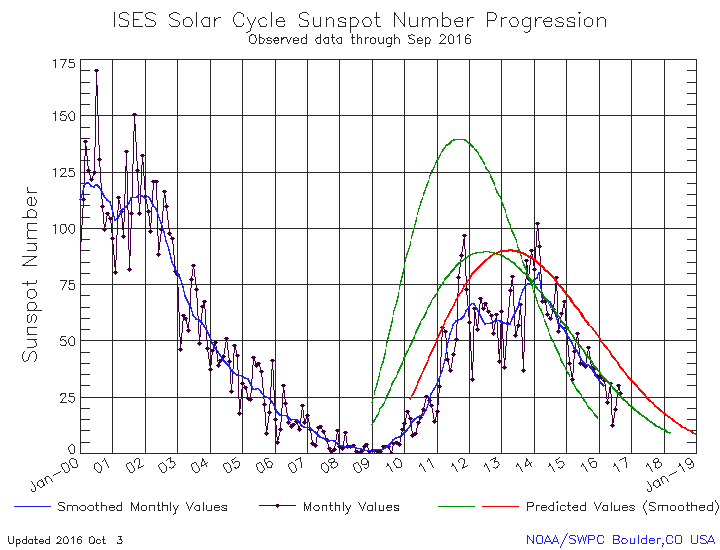
My original post about NOAA’s October update to its monthly tracking of the Sun’s sunspot cycle contained an incorrect graph. For reasons I do not understand, the first graph they posted did not include the data for September, thus creating for me the illusion that little had changed in September. I am now posting the correct graph here, below the fold, with annotations to give it context.

In September numbers showed a slight jump in sunspot activity, though once again nothing so significant as to change the overall trends. Moreover, the correction doesn’t change what I wrote previously in any way: the rate of decline seems to have transitioned down from the 2009 prediction (red curve) to the 2007 weak prediction (lower green curve). This doesn’t real mean much, as the sunspot number can still vary up and down considerable before we reach solar minimum in two or three years.

» Read more

Getting India’s first space telescope working

A moment of terror: During the first week of successful operation, there was an initial moment of terror when the engineers checking out Astrosat, India’s first space telescope, thought the spacecraft was unable to point at its target accurately.

During the first orbit, there was a difficulty in detecting this Crab Nebula as the satellite happened to pass through the South Atlantic Anomaly (SAA) region when Crab was in the field of view. SAA avoidance zone was deliberately kept wide to protect the instruments, and detectors were switched OFF in this interval during the initial days of Astrosat operation. When all the data were systematically analysed and data were selected based on the availability of Crab in the detector field of view, one could see the Crab emerging from Earth’s shadow (Fig 3).

Using the Crab Nebula as Astrosat’s first target, the check-out has been proceeding well, with full research operations expected to begin in the next few weeks.

Back from a weekend underground

Bob Zimmerman underground

The picture on the right will explain why I have been silent posting since Friday. I have just returned with five friends from three days of caving in New Mexico, doing some wild caving plus my first visit to Carlsbad Caverns since 1992, guided by a local caver who has been helping me with my cave survey project in Arizona.

New Mexico probably has the largest concentration of truly large and spectacularly decorated caves in the entire world. I’ve caved there previously, but this was my first trip driving from Arizona. We went to two wild caves, one of which I had never visited before and a second that I had seen during my 1992 trip. The picture shows me in the latter, standing above a large clear pool near the back of the cave with some giant flowstone speleothems all around me.

The new cave contained a room dubbed Speleogasm, because every formation there, of which there are too many to count, is completely festooned with helectites and sodastraws in a mad protrusion that no geologist can as yet explain. Nor is there any way to describe it adequately or photograph it successfully. To witness it you need to go, requiring the specialized caving skills that include the techniques and equipment required to rappel and climb a 40 foot rope.

As always, the advantages of learning how to do this successfully is the reward of seeing things that few ever see. It is why engineers and scientists strive so hard to get planetary probes to distant planets. And why humans want to travel to the planets. For me, getting inside a remote and beautifully decorated cave will just have to do.

3D image of Comet 67P/C-G

Do you own red-blue 3-D glasses? Get them out and go to this link. Rosetta scientists have created a 3-D image of Comet 67P/C-G, including the jets of material shooting out from its surface.

[C]reating a 3d anaglyph of dynamic events like this is notoriously difficult: often the jets are too faint or their duration is too short to find two high-quality images taken several minutes apart that are suitable to pair together to create this type of view. However, the OSIRIS team got lucky with this particular event, capturing two images separated by about two-and-a-half minutes.

The image shows a bright, collimated jet embedded in a broader emission structure. The three dimensional perspective also reveals the conical shape of the jet and that the collimated feature is emitted towards the observer.

Sunlight rolled the rocks on an asteroid

Scientists studying the rounded rocks on the surface of the asteroid 25143 Itokawa, photographed by the Japanese probe Hayabusa, have concluded that sunlight combined with the asteroid’s tiny gravity caused them move and thus erode themselves.

As sunlight bounced off the orbiting boulders, photons provided a tiny push. As they radiated back outward as heat, they triggered a recoil effect that added a gentle spin. Over time, these slowly spinning boulders bumped into each other with enough force to wear their edges into smooth surfaces.

Warning! This is only a model, and thus could very well be wrong. It is reasonable however and worth considering as a factor in studying the early formation history of asteroids.

More confirmation from Curiosity of past lakes in Gale Crater

New data from Curiosity has now provided further confirmation that the deeper sedimentary layers seen in Gale Crater were likely formed far in the past by flowing water.

“Paradoxically, where there is a mountain today there was once a basin, and it was sometimes filled with water,” said John Grotzinger, the former project scientist for Mars Science Laboratory at the California Institute of Technology in Pasadena, and lead author of the new report. “We see evidence of about 250 feet (75 meters) of sedimentary fill, and based on mapping data from NASA’s Mars Reconnaissance Orbiter and images from Curiosity’s camera, it appears that the water-transported sedimentary deposition could have extended at least 500 to 650 feet (150 to 200) meters above the crater floor.”

Furthermore, the total thickness of sedimentary deposits in Gale Crater that indicate interaction with water could extend higher still, perhaps up to one-half mile (800 meters) above the crater floor.

Above 800 meters, Mount Sharp shows no evidence of hydrated strata, and that is the bulk of what forms Mount Sharp. Grotzinger suggests that perhaps this later segment of the crater’s history may have been dominated by dry, wind-driven deposits, as was once imagined for the lower part explored by Curiosity.

This was always the reason to go and climb Mount Sharp. As Curiosity heads uphill it begins to map out the geological history of Mars, first as a wet place with liquid water, then as a dry place in which the water is gone.

Ice and blue skies on Pluto

New data downloaded from New Horizons has confirmed the presence of ice on the planet’s surface, as well as suggesting that the planet’s sky might actually be colored blue.

The haze particles themselves are likely gray or red, but the way they scatter blue light has gotten the attention of the New Horizons science team. “That striking blue tint tells us about the size and composition of the haze particles,” said science team researcher Carly Howett, also of SwRI. “A blue sky often results from scattering of sunlight by very small particles. On Earth, those particles are very tiny nitrogen molecules. On Pluto they appear to be larger — but still relatively small — soot-like particles we call tholins.”

Scientists believe the tholin particles form high in the atmosphere, where ultraviolet sunlight breaks apart and ionizes nitrogen and methane molecules and allows them to react with each other to form more and more complex negatively and positively charged ions. When they recombine, they form very complex macromolecules, a process first found to occur in the upper atmosphere of Saturn’s moon Titan. The more complex molecules continue to combine and grow until they become small particles; volatile gases condense and coat their surfaces with ice frost before they have time to fall through the atmosphere to the surface, where they add to Pluto’s red coloring.

Government admits whole milk was always good for you

The uncertainty of science: A new study has found that whole milk not only does not increase heart disease, it might even help prevent it.

The most significant part of this story however is that when the federal government made the original recommendation that people stop drinking whole milk to avoid fats, the science behind that recommendation was flawed and inconclusive.

But even as a Senate committee was developing the Dietary Goals, some experts were lamenting that the case against saturated fats was, though thinly supported, was being presented as if it were a sure thing. “The vibrant certainty of scientists claiming to be authorities on these matters is disturbing,” George V. Mann, a biochemist at Vanderbilt’s med school wrote in the New England Journal of Medicine. Ambitious scientists and food companies, he said, had “transformed [a] fragile hypothesis into treatment dogma.”

As Morrissey says at the link, “Golly, doesn’t that sound … familiar?

Ozone-destroying gas suddenly decreases for no reason

The uncertainty of science: Scientists are baffled by the sudden drop in one kind of atmospheric hydrochlorofluorocarbon (HCFC) gas that is thought to help create the hole in the ozone layer above the south pole.

New measurements show that after a rapid increase of the compound in the atmosphere of the Northern Hemisphere from 0.13 parts per trillion (ppt) in 2000 to 0.50 ppt in 2013, the concentration suddenly dropped to about 0.44 ppt by early 2015. This drop in concentration is equivalent to a 50 percent decline in global emissions percent of the gas: from 3,000 metric tons (3,300 US tons) in 2011 to about 1,500 metric tons (1,700 tons) in 2014, according to the new study.

Now for the kicker: They not only don’t know why this HCFC suddenly declined, they also don’t know where it is coming from. This gas is not one of the gases that were restricted decades ago to save the ozone hole. Until last year, scientists hadn’t even known it existed. And though the article claims it is human-caused, they haven’t yet identified how humans cause it. They hope its sudden decline in the atmosphere will help them pin down its source.

A planet-forming disk with mysterious ripples

cropped image of dust disk and ripples

The mysteries of science: Astronomers have detected ripples and blobs moving outward through the dust disk surrounding a nearby star, and have no idea what is causing them.

The images reveal a train of wave-like arches, resembling ripples in water. After spotting the features in the SPHERE data the team turned to earlier Hubble images of the disk, taken in 2010 and 2011. The wave-like nature of some of these features were not recognized in the initial Hubble observations. But once astronomers reprocessed the Hubble images they not only identified the features but realized that they had changed over time. The researchers report that these ripples are moving — and they are moving very fast. “We ended up with enough information to track the movement of these strange features over a 3- to 4-year period,” explained team member Christian Thalmann of the Swiss Federal Institute of Technology in Zurich, Switzerland. “By doing this, we found that the arches are racing away from the star at speeds of up to 10 kilometers per second (22,000 miles per hour)!” Co-investigator Carol Grady of Eureka Scientific in Oakland, California, added, “Because nothing like this has been observed or predicted in theory we can only hypothesize when it comes to what we are seeing and how it came about.”

The one theory that is still not refuted is that the star’s flaring activity, which is significant, causes the ripples somehow.

An avalanche on Mars, as it happens

Avalanche on Mars

Cool image time! In their routine monitoring for avalanches at the layered deposits at the Martian north pole, the Mars Reconnaissance Orbiter science team captured the avalanche on the right, as it happened.

This picture managed to capture a small avalanche in progress, right in the color strip. … The small white cloud in front of the brick red cliff is likely carbon dioxide frost dislodged from the layers above, caught in the act of cascading down the cliff. It is larger than it looks, more than 20 meters across, and (based on previous examples) it will likely kick up clouds of dust when it hits the ground.

They note that avalanches in this area of Mars are common in the spring when things are warming, and have been documented previously, but possibly not so dramatically.

Guess where?

Pluto lake

I found the image on the right while trolling about on the various raw image sites for NASA’s planetary missions. No press release yet, and maybe there never will be one. I do know the scientists involved in this particular mission are right now drooling over the details available in the full resolution image, which I have cropped and reduced to fit on the right. Take a look and you will drool as well.

Want to know where this is? I bet you have already guessed, but if you need help, click on the “read more” link below, where I have also added some comments.
» Read more

IPPC replaces head with economist

The politics of climate science: The IPCC has selected an economist, Hoesung Lee, to replace the disgraced railroad engineer, Rajendra Pachauri, who had previously been its leader.

That neither Pachauri nor Lee is an actual climate scientist, nor have they ever even done any climate science, tells us all we need to know about the IPCC. It is a political body, designed to push the political agenda of the advocates of human-caused global warming regardless of the scientific evidence. And that political agenda has nothing to do with science or climate, but using science and climate as a tool to impose Marxist fascist rule on everyone.

And if you doubt me, read this article in the science journal Nature describing the possible directions the IPCC will take under Lee’s leadership.

Ramp down in sunspots continues

Correction! For reasons I do not understand, the graph below, originally posted on the NOAA website, was incorrect and was changed several days after I posted my piece below. See this post for the correct graph and analysis.

The uncertainty of science: On Monday NOAA posted its monthly update of the solar cycle, showing the Sun’s sunspot activity in September. Once again I post it here, below the fold, with annotations to give it context.

For the third month in a row the sunspot count dropped a tiny amount, lingering at about the same number as the previous two months. Moreover, the rate of decline seems to have transitioned down from the 2009 prediction (red curve) to the 2007 weak prediction (lower green curve). This doesn’t real mean much, as the sunspot number can still vary up and down considerable before we reach solar minimum in two or three years.

» Read more

Curiosity’s future path

Looking up Mt Sharp

Cool image time! The Curiosity science team has produced another panorama of Mount Sharp and the regions that the rover will soon traverse.

This composite image looking toward the higher regions of Mount Sharp was taken on September 9, 2015, by NASA’s Curiosity rover. In the foreground — about 2 miles (3 kilometers) from the rover — is a long ridge teeming with hematite, an iron oxide. Just beyond is an undulating plain rich in clay minerals. And just beyond that are a multitude of rounded buttes, all high in sulfate minerals. The changing mineralogy in these layers of Mount Sharp suggests a changing environment in early Mars, though all involve exposure to water billions of years ago. The Curiosity team hopes to be able to explore these diverse areas in the months and years ahead. Further back in the image are striking, light-toned cliffs in rock that may have formed in drier times and now is heavily eroded by winds.

They have adjusted the colors, adding blue, so that things look as they would on Earth, in order to help the geologists understand what they are looking at.

Be sure and click on the link. The full resolution image is quite amazing. Like mountains on Earth, from a distance things look a lot simpler than they do once you get there. The slopes of Mount Sharp are complex and rugged, and will be a big challenge for Curiosity to traverse.

Moreover, this rough terrain illustrates that the Martian surface has, like Earth, been significantly shaped by erosion. The surface we see here is not the surface produced by the impact that produced the crater. It has been reshaped and eroded over many eons by many later processes, including wind and water.

It wasn’t just an asteroid that killed the dinosaurs

Scientists have now obtained enough solid data to confirm that the large extinction of the dinosaurs 65 million years ago was caused not just by the Yucatan asteroid impact but also by the gigantic volcanic event in India called the Deccan Traps.

The researchers said the asteroid strike occurred 66.04 million years ago, plus or minus about 30,000 years. They said eruptions in a region called the Deccan Traps were already underway at a lower intensity but dramatically accelerated after the asteroid strike as if the powerful impact triggered it. The dating method they used found this acceleration began within 50,000 years of the impact, but it could have been in the mere days, months or years afterward. “Within measurement error, they’re simultaneous,” said volcanologist Loÿc Vanderkluysen of Philadelphia’s Drexel University. “The two processes in tandem caused the extinctions,” added Paul Renne, director of the Berkeley Geochronology Center and a University of California, Berkeley geologist, who led the study in the journal Science.

Though many planetary scientists have discounted the Deccan Traps for decades, paleontologists have tended to favor it as a major factor in the extinction. This new study suggests that both were involved, which was the theory held by most of the more reasonable scientists in both fields. While many liked to push one or the other theory in the press, the better scientists considered both a possible factor and have been working to determine this possibility.

Comet 67P/C-G was formed by a soft collision

Scientists, using data from Rosetta, have concluded that Comet 67P/C-G’s double lobed shape was caused by the slow-motion collision of two distinct comets.

By using high-resolution images taken between 6 August 2014 and 17 March 2015 to study the layers of material seen all over the nucleus, they have shown that the shape arose from a low-speed collision between two fully fledged, separately formed comets. “It is clear from the images that both lobes have an outer envelope of material organised in distinct layers, and we think these extend for several hundred metres below the surface,” says Matteo Massironi, lead author from the University of Padova, Italy, and an associate scientist of the OSIRIS team. “You can imagine the layering a bit like an onion, except in this case we are considering two separate onions of differing size that have grown independently before fusing together.”

While erosion continues to eat away at the comet’s surface, changing its shape, the two lobes formed separately, though in much the same way.

India launches its first space observatory

The competition heats up: India today successfully launched Astrosat, its first space telescope.

ASTROSAT, with a mission life of five years, is armed with telescopes that will simultaneously study the space in visible light, ultraviolet (UV) rays and low- and high-energy X-rays, plus an X-ray scanning sky monitor to detect transient X-ray emissions and γ-ray bursts. The observatory aims to study star-birth regions and high-energy processes, including binary star systems of neutron stars and black holes.

This space observatory fills several gaps that have existed in astronomical research since the shut down of NASA’s Rossi X-Ray Timing Explorer in 2012 as well as the International Ultraviolet Explorer in 1996.

The launch also put six other small satellites into orbit, demonstrating once again the reliability of India’s smaller Polar Satellite Launch Vehicle (PSLV).

Using fish to study bone loss in weightlessness

A Japanese experiment on ISS, comparing the development of fish in weightlessness with those on the ground, has provided` scientists more information about bone density loss in weightlessness.

Akira Kudo at Tokyo Institute of Technology, together with scientists across Japan, have shown that medaka fish reared on the International Space Station for 56 days experienced increased osteoclast activity – bone cells involved in the re-absorption of bone tissue – likely leading to a subsequent reduction of bone density. They also found several genes that were upregulated in the fish during the space mission. The team generated fish with osteoclasts that emit a fluorescent signal. They sent 24 fish into space as juveniles, and monitored their development for 56 days under microgravity. The results were compared with a fish control group kept on Earth.

Kudo and his team found that bone mineral density in the pharyngeal bone (the jaw bone at the back of the throat) and the teeth of the fish reduced significantly, with decreased calcification by day 56 compared with the control group. This thinning of bone was accompanied by an increase in the volume and activity of osteoclasts. The team conducted whole transcriptome analysis of the fish jaws, and uncovered two strongly upregulated genes (fkbp5 and ddit4), together with 15 other mitochondria-related genes whose expression was also enhanced. Reduced movement under microgravity also has an influence. The fish began to exhibit unusual behavior towards the latter stages of their stay in space, showing motionless at day 47.

What the data mostly confirms is that long-term weightlessness is a bad thing for the development of bones, and not just in humans. Whether scientists can use these results to counter these harmful effects is not clear, however.

Rosetta data reveals how a comet evaporates

Newly released Rosetta data has shown, for at least one area on the surface of Comet 67P/C-G, the process by which the surface ice is replaced by water ice from below as the comet rotates and sunlight causes the surface ice to evaporate away.

The data suggest that water ice on and a few centimetres below the surface ‘sublimates’ when illuminated by sunlight, turning it into gas that then flows away from the comet. Then, as the comet rotates and the same region falls into darkness, the surface rapidly cools again. However, the underlying layers remain warm owing to the sunlight they received in the previous hours, and, as a result, subsurface water ice keeps sublimating and finding its way to the surface through the comet’s porous interior.

But as soon as this ‘underground’ water vapour reaches the cold surface, it freezes again, blanketing that patch of comet surface with a thin layer of fresh ice. Eventually, as the Sun rises again over this part of the surface on the next comet day, the molecules in the newly formed ice layer are the first to sublimate and flow away from the comet, restarting the cycle.

They discovered this process when they noticed surface ice evaporating in this region during the comet’s 6-hour day and then getting resurfaced with ice during the comet’s 6-hour night.

Meanwhile, Rosetta is about to move as much as 1500 kilometers away from the comet for several weeks so that its scientists can study its coma more broadly.

New Pluto images

thumbnail of Pluto closeup

Cool image time! The New Horizons team has released some new images. A thumbnail of what I think is the most interesting image is shown on the right. Be sure to look at the full resolution image. It shows a flat plain of what look like frozen polygon plates with a thin layer of what appear to be dunes. In the center some rocks poke out like islands, with what looks like a wind-swept wake to the right. The wake could be caused by Pluto’s very thin atmosphere. Or maybe there are currents that slowly push the frozen plates past the harder rocks (which probably are ice, which in Pluto’s very cold environment has the structural strength of granite).

These images were posted on the New Horizons website with no accompanying press release. I think the science team has decided it will just upload them, and reserve press releases for when they have accumulated enough data to announce some intelligent conclusions. Right now, they can only speculate as wildly as I from these images. It is reasonable to give them the time to assess the data more closely before announcing any explanations. At the same time, we should also congratulate them for posting the images immediately so that others can see them.

Update: a press release was released, though it really doesn’t add much except review the images.

Researchers push for access to confidential government records of the public

What could possibly go wrong? Researchers in a number of fields want access to the vast amount of private government data that is routinely gathered from the public.

In the past few years, administrative data have been used to investigate issues ranging from the side effects of vaccines2 to the lasting impact of a child’s neighbourhood on his or her ability to earn and prosper as an adult3. Proponents say that these rich information sources could greatly improve how governments measure the effectiveness of social programmes such as providing stipends to help families move to more resource-rich neighbourhoods.

But there is also concern that the rush to use these data could pose new threats to citizens’ privacy. “The types of protections that we’re used to thinking about have been based on the twin pillars of anonymity and informed consent, and neither of those hold in this new world,” says Julia Lane, an economist at New York University. In 2013, for instance, researchers showed that they could uncover the identities of supposedly anonymous participants in a genetic study simply by cross-referencing their data with publicly available genealogical information.

Read it all. It is terrifying to me how governments worldwide increasingly consider this private data their property to use as they wish. For example:

In the United States, the Census Bureau has been expanding its network of Research Data Centers, which currently includes 19 sites around the country at which researchers with the appropriate permissions can access confidential data from the bureau itself, as well as from other agencies. “We’re trying to explore all the available ways that we can expand access to these rich data sets,” says Ron Jarmin, the bureau’s assistant director for research and methodology.

I ask: What business is it of the Census Bureau to do this? The information they gather was originally intended solely to determine Congressional districts. Moreover, who gave them the right to release the confidential data to anyone? Have they asked anyone for this permission?

Changes on the surface of Comet 67P/C-G

In a science paper now accepted for publication, the Rosetta science team have described changes that have occurred on the surface of Comet 67P/C-G from May through July of this year as the comet moved closer to the Sun and activity increased.

The changes were seen in a smooth area dubbed Imhotep.

First evidence for a new, roughly round feature in Imhotep was seen in an image taken with Rosetta’s OSIRIS narrow-angle camera on 3 June. Subsequent images later in June showed this feature growing in size, and being joined by a second round feature. By 2 July, they had reached diameters of roughly 220 m and 140 m, respectively, and another new feature began to appear.

By the time of the last image used in this study, taken on 11 July, these three features had merged into one larger region and yet another two features had appeared.

Be sure to click on the link to see the images. The changes look like a surface layer is slowing evaporating away.

1 159 160 161 162 163 271