Pedestal craters in the Martian northern lowlands?

Click for full image.
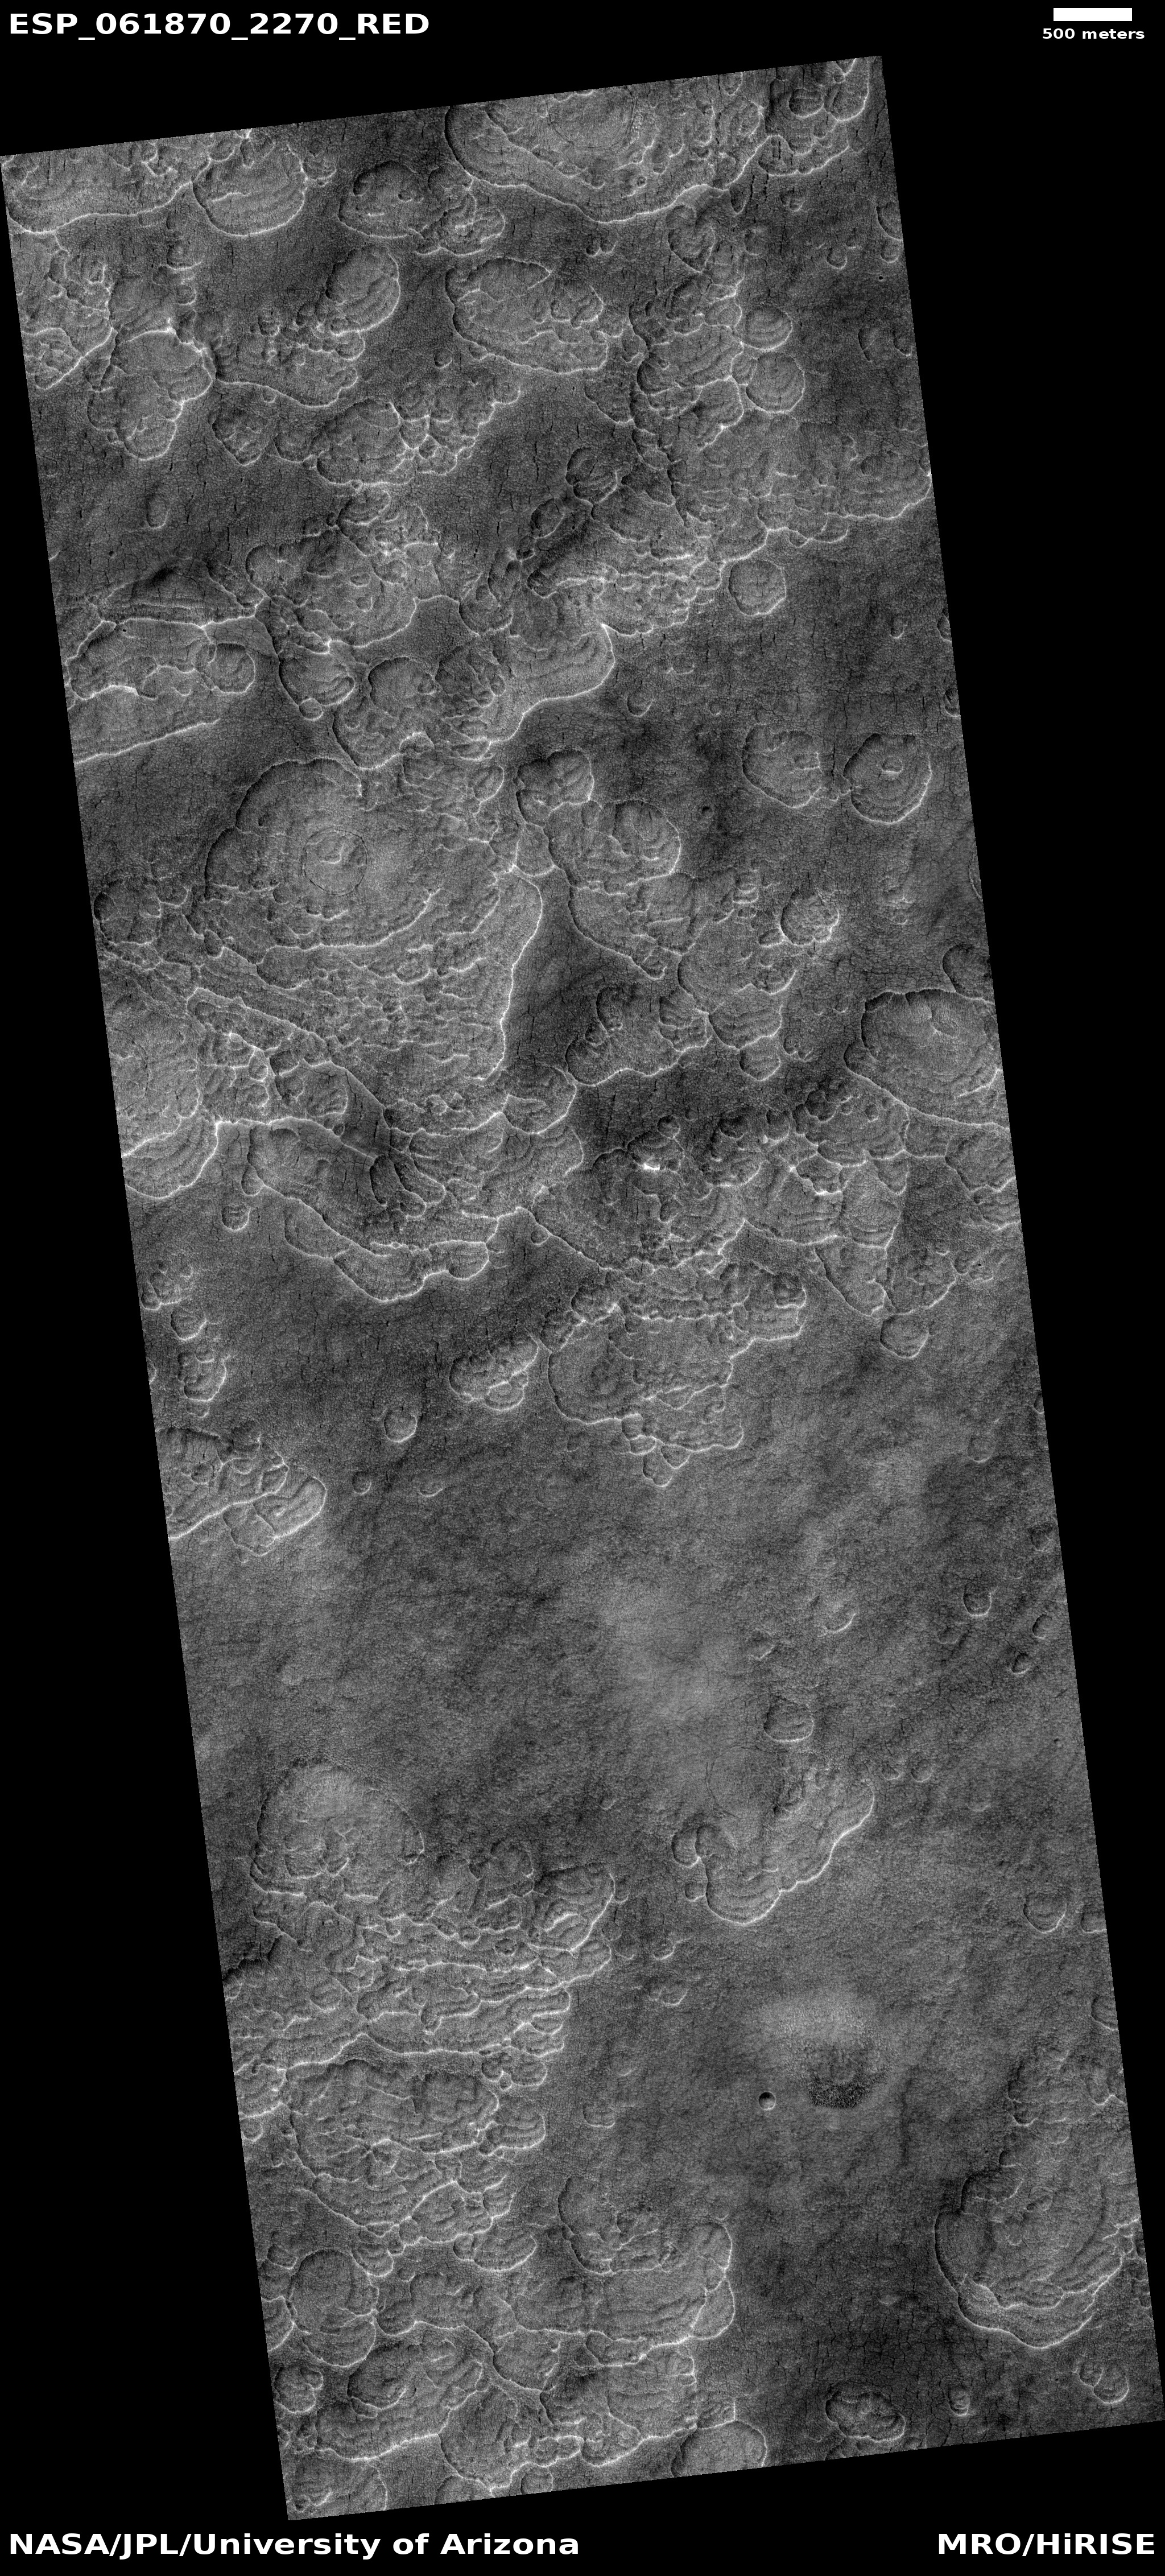
Cool image time! The photo on the right, cropped and reduced to post here, shows a cluster of really strange mesas, craters, and pits, located in Utopia Planitia, the largest and deepest plain of Mars’ northern lowlands where an intermittent ocean might have once existed.
The image was taken on October 26, 2019 by the high resolution camera on Mars Reconnaissance Orbiter (MRO) as part of its regular image-taking program. In this case it was dubbed a “terrain sample” image, meaning that it was not specifically requested by any researcher, but was taken because they need to use the camera regularly to maintain its temperature, and thus sometime produce images over previously untouched areas, not knowing what they will find, as part of that maintenance schedule.
In this case the terrain sampled is especially intriguing. Are the upraised depressions what are called pedestal craters, created when the impact landed on what was once an icy plain, which subsequently sublimated away to leave the crater sitting high above the surrounding flats? Maybe, but this location is at 23 degrees north latitude, and research has generally found these pedestal craters at latitudes higher than 30 degrees.
Moreover, that many of these upraised depressions are not circular suggests that their formation was not impact related.
Other mysteries: Why are all the ridgelines bright? What caused the parallel white streaks to the east and west of some mesas? And if these are impact craters, why are some distorted?
If this region was once the seabed of an intermittent ocean, this fact might explain the features. Then again, it is more likely that this lowland area was once covered in ice in the far past, when the planet’s tilt was greater and the lower latitudes were actually colder than the polar regions, and thus allowed ice to build up in those lower latitudes. We might therefore be seeing the end result of an erosion/sublimation process as that ice disappeared when Mars’ inclination shifted.
Lots of questions, and no answers.