A team of explorers and scientists have today completed the first there-and-back crossing of Antarctica in wheeled vehicles.

A 10-man team of explorers and scientists today completed the first there-and-back crossing of the continent of Antarctica using wheeled vehicles. From the expedition blog:

We quickly took ourselves to the mess tent for some hot coffee and something which we had been craving for a while – Coca Cola. The feeling among the team was satisfaction and elation at what we had achieved and relief that the belt drive had held out! The first Expedition ever to travel coast to coast and back again, with the privilege of visiting the South Pole twice. We joked in the mess tent before deciding that we were not going to sleep and headed over to the Mechanic Area and back to the vehicles.

The Sun is blank

For the first time since October 10, and only the third time since August, the Earth-facing side of the Sun is blank, showing no sunspots. All told, 2010 has only been blank 13% of the time, for a total of 46 blank days, with only 12 days left in the year. These numbers contrast sharply with 2009, when the Sun was blank 71% of the time, or 260 out of 365 days.

It is very clear that the solar minimum is now over, and that the Sun ramping up to its next maximum. Blank days should soon cease (today might very well be the last for years), and the number of sunspots should continue to increase through approximately 2013, when astronomers now expect the maximum to peak.

It will be a weak maximum, however, likely accompanied with cold weather. At least, this has been the pattern for the last ten centuries, based on the best data that scientists have. When the Sun produces sunspots, the Sun gets hotter, and though that increase in radiation appears slight, it seems enough to warm the Earth’s climate. This is what appears to have happened around the year 1000, during what climate scientists call the Medieval Warm Period.

And when the Sun goes blank, or produces fewer sunspots, the Sun dims, and the Earth’s climate cools. This is what happened in the 1600s and 1700s, when the Little Ice Age gripped much of the Earth. It also happened in the first two decades of the 1800s, the last time the Sun produced as few sunspots as it is now, and when at least one year was called “the year without a summer”. Interestingly, that cold period at the beginning of the 1800s was also a period of intense volcanic activity, which threw a lot of dust and material into the atmosphere and thus helped contribute to the cooling of the Earth.

The last half of the 20th century, however, has not seen that much volcanic activity, which has made the atmosphere today clearer than any time in the past five decades. It has also been a time of increased solar activity, with most of the solar maximums peaking at generally higher numbers. No wonder scientists have detected evidence of a slight warming in the climate.

However, that warming appears to be ending, and it is doing so at the same time the Sun is going spotless. Though we don’t yet fully understand the mechanics of how these two events are linked, it behooves us to pay close attention. No climate prediction or computer model will mean anything if it does not.

Meanwhile, solar scientists remain unclear about the causes behind the solar cycle’s ebbs and flows. They have a reasonable idea that the cycle is caused by the Sun’s magnetic dynamo as it flips from one polarity to another. But why this happens is still subject to debate.

More importantly, it remains a complete unknown how long the next sunspot minimum will be. The Sun could spring back to life, as it did in the 1850s, producing lots of sunspots. Or sunspots might fade out for a few additional decades, as they did in the 1600s.

Sadly, based on the state of our science today, this is a question that probably no one will be able to answer — until we actually see it happen.

Looking into a lunar cave

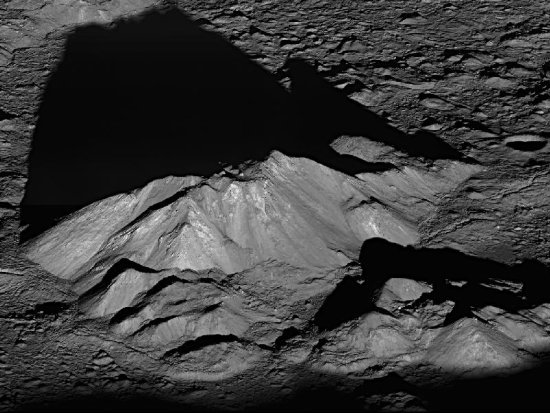
NASA engineer James Fincannon emailed me the image below, cropped from this Lunar Reconnaissance Orbiter scan. It shows a side view of the same lunar pit previously discussed by me in July (here and here).

This image below was almost certainly ordered up by LRO scientists after seeing the images above so that they could get a look at the pit’s walls. I have further cropped it and blown it up so we can get a really good look too! See the second image below.

In this side view, we are looking across the top of the pit at the far wall and floor. On that far wall you can see what look like three coarse horizontal layers, below which is a deeply shadowed floor layer that is probably either cave passage or a significant overhang. Further processing will probably be bring out some further details and hopefully answer this question.

In a previous post, I had noted that this wall is probably about 200 feet deep. This new image thus gives any experienced rock-climber or caver a very nice sense of what a rappel down the side of that pit would be like. To me, it reminds me of some of the open-air cave pits I’ve rappelled into in New Mexico.

Update: I should note that that overhang/cave entrance at the bottom of the pit is probably at least 30 feet high. An impressive entrance, indeed.

Also, lunar scientist Paul Spudis emailed me with these comments:

[The pit] is very similar to some tube systems that I have studied in Hawaii. The wall units are exposed lava flows. They are probably all from the event which made this flow — a single flow can be made up of multiple flow units, hence, the apparent “layering.”

Of course, getting into an open pit and then moving through open void lava tubes that radiate from it are two different things. In terrestrial tube systems, many tubes are open and accessible but sometimes they are not. They can be blocked up by frozen lava or rubble from adjacent tube collapse.

Unfortunately, I don’t think we’re going to know what the situation on the Moon is until we get there. However, I must say, this particular area looks very promising.

Side view of pit

closeup

Scientist makes the first measurements of the magnetic field at the Earth’s core

A scientist has made the first measurements of the strength at the Earth’s core of its magnetic field. What’s most fascinating is that he used the Moon and distant quasars to do it! First he used radio observations of the quasars to get very precise measurements of the Earth’s rotation axis and how the Moon was tugging at that axis and thus affecting its magnetic field. Then,

By calculating the effect of the moon on the spinning inner core, Buffett discovered that the precession makes the slightly out-of-round inner core generate shear waves in the liquid outer core. These waves of molten iron and nickel move within a tight cone only 30 to 40 meters thick, interacting with the magnetic field to produce an electric current that heats the liquid. This serves to damp the precession of the rotation axis. The damping causes the precession to lag behind the moon as it orbits the earth. A measurement of the lag allowed Buffett to calculate the magnitude of the damping and thus of the magnetic field inside the outer core.

Amino acids found on meteorite that crashed in the Sudan

Dead alien life arrives on Earth! Not really but still exciting anyway: Scientists have found the remains of space-born amino acids — essential to life — in the meteorite that crashed in the Sudan in 2008. Key quote:

“This meteorite formed when two asteroids collided,” said Daniel Glavin of NASA’s Goddard Space Flight Center in Greenbelt, Md. “The shock of the collision heated it to more than 2,000 degrees Fahrenheit [1,093 degrees Celsius], hot enough that all complex organic molecules like amino acids should have been destroyed, but we found them anyway.”

The discovery is further evidence that the basic elements of life can form in even the most hostile of environments.

Air Force agrees to Share data on the Meteorites its surveillance satellites detect

The Air Force has agreed to share the meteorite data its surveillance satellites detect.

Though the article above makes it sound like this data includes a lot of Earth-destroying asteriods, almost all of these detections are of smaller rocks burning up in the atmosphere, information researchers need to produce a more complete census of the solar system.

NASA Picks New Chief Scientist

Today’s announcement by the Obama administration of their choice for NASA’s new chief scientist, Waleed Abdalati, reveals once again how much climate research guides their thinking, not space exploration. Key quote:

His research has focused on the study of polar ice cover using satellite and airborne instruments. He has led or participated in nine field and airborne campaigns in the Arctic and the Antarctic.

This is not a criticism of Dr. Abdalati. His research interests, however, make very clear where the Obama administration really wants NASA to look: down at the Earth instead of up beyond Earth orbit.

Clouding the climate picture

Two seemingly conflicting research papers, both focusing on how the formation of clouds might affect, or be affected by, global temperatures, actually end up combining to show that the world’s climate models can’t be trusted. In other words the basic science of predicting climate change remains seriously flawed.

At issue in both papers is how much and under what circumstances clouds help to warm or cool the planet. Do they reflect solar energy back into space or hold it within the atmosphere like a blanket – and by how much? The answer is crucial to determining where global temperatures will be heading in this century – and what if any policies the world’s governments should be adopting to deal with the situation.

The latest research, appearing this week in the journal Science, is the work of Andrew Dessler of Texas A&M University. In it he examines the weather-satellite databases covering atmospheric conditions over the past 10 years, looking for discernible patterns where changes in temperature have resulted in changes in cloud cover, or vice versa.

In particular, Dessler chooses El Niño and La Niña events in the Pacific Ocean. El Niño, which occurs every three to seven years, is accompanied by an enormous finger of warm water extending eastward along the tropical Pacific, all the way to South America and first appearing around year end. La Niña, which also erupts periodically, produces the opposite effect – a large zone of colder-than-normal water stretching across the Pacific. Both events tend to attract attention, because they usually generate severe weather affecting large areas of North and South America and elsewhere.

El Niño and La Niña are ideal subjects for climate researchers. They both develop quickly and produce, respectively, recognizable spikes and troughs in temperatures. For example, scientists studying the relationship of clouds to temperature can observe changes in cloud cover over the Pacific that precede, coincide with, and follow El Niño and La Niña and then use those changes to estimate how cloud cover affects or is affected by air temperature.

As Dessler describes in the Science paper, he did find evidence of what he calls a small positive feedback, meaning that clouds may prevent some solar heat from radiating into space, thereby warming the planet. He also doesn’t rule out the possibility of a small negative feedback, but says it probably isn’t large enough to overcome other factors contributing to warming.

But Dessler includes several assertions in his text that completely debunk the idea that climate science is “settled,” as asserted by former Vice President Al Gore and a host of others. For example, early on in the paper, Dessler acknowledges that “the most complex and least understood” of climate-feedback mechanisms is cloud feedback. And later on, he admits that “what we really want to determine is the cloud feedback in response to long-term climate change. Unfortunately, it may be decades before a direct measurement is possible.”

The earlier paper, published in the summer of 2010 in the Journal of Geophysical Research, by Roy Spencer and William Braswell of the University of Alabama at Huntsville, goes much farther in challenging the cloud-temperature link. The global warming community has tried for years to discredit Spencer’s work and to brand him as a “denier,” partly because for more than a decade he has produced findings that call into question the reliability of the host of earthbound instruments used to collect global temperature data.

Such accusations have been entirely unfair, because even Spencer, in his eminently readable and informative blog, has asserted from time to time that he isn’t sure whether the climate is changing and human activity is responsible. What gets him into trouble with the conventional wisdom is his emphasis on what’s wrong with current climate science and what remains unknown – and though it’s a short list, it’s formidable:

  • “Everyone agrees that the net effect of clouds is to cool the climate system on average. But the climate models suggest that the cloud feedback response to the addition of [carbon dioxide] to our current climate system will be just the opposite, with cloud changes acting to amplify the warming.” [Ed. To put it more simply, clouds cool the climate, except when they are used in global warming climate models.]
  • “While we know that evaporation increases with temperature, we don’t know very much about how the efficiency of precipitation systems changes with temperature.”
  • “There [is] a variety of processes … which can in turn alter the balance between evaporation and precipitation, which will then cause warming or cooling as a result of the humidity change – rather than the other way around.”

[Ed. Concerning the second and third quotes: Since water vapor in the atmosphere is by far the most powerful greenhouse gas, far more important than carbon dioxide, not understanding its detailed relationship with temperature means no model can do a reliable job of predicting the climate.]

In their paper Spencer and Braswell likewise look at the relationship between clouds and temperature. In an extremely detailed and – even to climate researchers – dense examination of the same satellite database, the two authors present an argument that separates the phenomenon of cloud formation from anything relating to temperature changes. As Spencer comments in his blog, regarding the feedback data, “even the experts in the field apparently did not understand them.”

But even interested lay readers can glean the gist of Spencer and Braswell’s findings simply by looking at the graphs they present, which contain jumbles of data points suggesting a complete disconnect between cloud formation and temperatures. This is a strong indication that we don’t know which is the cause and which is the effect, though most climate researchers assume temperature is the cause and clouds are the effect. At best, the researchers conclude, there’s evidence for a slight negative feedback – clouds causing cooling when temperatures rise – but overall there appears to be no link between the two phenomena over long periods.

“I cannot remember a climate issue of which I have ever been so certain,” as Spencer wrote about this finding on his blog.

The debate over the cloud-temperature link is bound to go on, but these two papers should make one thing clear: Until the connection between cloud formation and temperature is established or debunked once and for all, the models being used to predict future climate cannot be trusted. So perhaps when the new Congress looks at climate-related issues its members might want to consider them in this context.

top NASA scientist says that all global warming models are too gloomy

The uncertainty of science! A top NASA scientist says that the models used by global warming scientists are far too gloomy, leaving out the cooling effects of increased plant production in a carbon dioxide rich atmosphere. Key quote:

It now appears, however, that the previous/current state of climate science may simply have been wrong and that there’s really no need to get in an immediate flap. If Bounoua and her colleagues are right, and CO2 levels keep on rising the way they have been lately (about 2 ppm each year), we can go a couple of centuries without any dangerous warming.

1 257 258 259 260 261 271