Sunspot update: Sunspot activity tumbles in February, including the 1st blank days since ’22
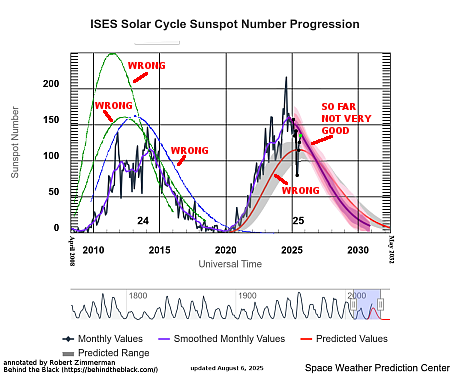
The uncertainty of science! It is the start of the month, and thus time for another sunspot update, using NOAA’s monthly graph of the sunspot activity on the Earth-facing hemisphere, updated by NOAA to include the activity in February but annotated with extra information by me to illustrate the larger scientific context.
Last month I lambasted NOAA’s solar science panel for its consistently failed predictions, and made a tentative prediction of my own, suggesting the ramp down to solar minimum might not be occurring as they had predicted in April 2025.
This month I can lambast myself, because the Sun in February saw a significant drop in sunspots, including three consecutive days in which the Sun was blank of spots, for the first time since 2022. This drop supports the NOAA panel prediction and makes my prediction look foolish, but it also suggests the ramp down is continuing to go faster than predicted.
» Read more