
NOAA’s prediction for the next solar maximum
Last week NOAA introduced a newly revamped graph for tracking the monthly activity of sunspots on the Sun’s visible hemisphere. (You can see an example of the old graph, used by them for more than fifteen years, here.)
In order to properly understand the context of future sunspot activity, it is important to understand how the new graph aligns with the old. My first attempt to do so in my April 3, 2020 sunspot update, unfortunately was a failure. While most of my conclusions in that update remain correct, my attempt to place NOAA’s prediction for the next solar cycle on my graph was in error.
I had not realized that NOAA had changed its sunspot number scale on the graph’s vertical axis. In their old graph they had used the monthly sunspot number count from the Royal Observatory of Belgium. The new graph instead used the sunspot number from NOAA’s own Space Weather Prediction Center (SWPC). Both numbers are creditable, but the solar scientist community has switched entirely to the latter in the past few years because they consider its criteria for determining the count across all past cycles to be more accurate.
The Belgium numbers have traditionally been about one third lower than SWPC’s. Not realizing that NOAA’s new prediction was based on the SWPC numbers, I therefore placed it on the graph using the Belgium numbers and thus made the peak of the solar maximum 33% too high.
Below is NOAA’s new graph, annotated properly with both the past and new solar cycle predictions added now correctly.
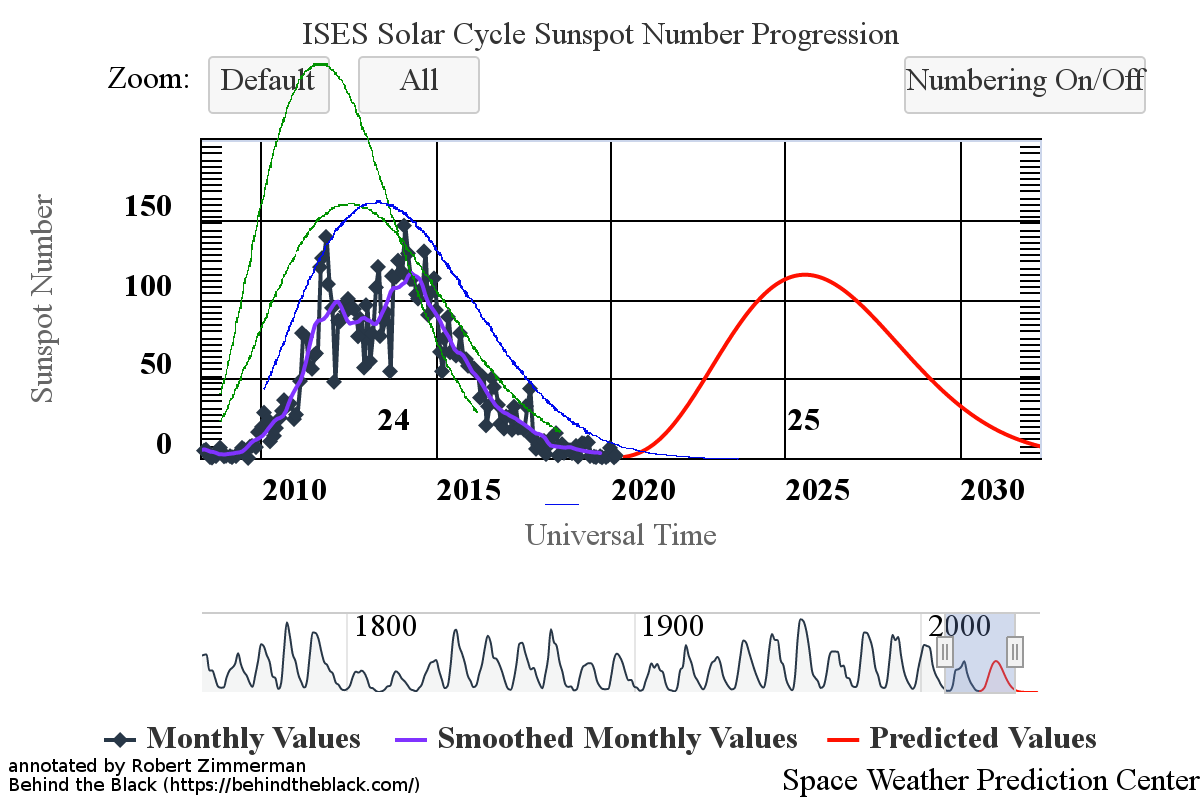
The graph above has been modified to show the predictions of the solar science community for both the previous and upcoming solar maximums. The green curves show the community’s two original predictions from April 2007 for the previous maximum, with half the scientists predicting a very strong maximum and half predicting a weak one. The blue curve is their revised May 2009 prediction. The red curve is the new prediction, first posted by NOAA in April 2020.
From this corrected graph it is obvious that the new prediction coming from NOAA expects an even weaker solar maximum in 2025 than the weak solar maximum that just passed in 2014. Readers should be aware however that this prediction does not represent a consensus among the solar science community, only the decision of NOAA’s Solar Cycle 25 Prediction Panel. There is evidence of some disagreement within the entire community about this prediction.
Future monthly sunspot updates will be based on this image above. As the sunspot cycle proceeds and NOAA slowly erases its prediction from their graph, I will put it back in, as you see it above. This way we will be able to see if their prediction was accurate, or indicated a bit of guesswork, as demonstrated by the previous three predictions for the last maximum.

On Christmas Eve 1968 three Americans became the first humans to visit another world. What they did to celebrate was unexpected and profound, and will be remembered throughout all human history. Genesis: the Story of Apollo 8, Robert Zimmerman's classic history of humanity's first journey to another world, tells that story, and it is now available as both an ebook and an audiobook, both with a foreword by Valerie Anders and a new introduction by Robert Zimmerman.
The print edition can be purchased at Amazon or from any other book seller. If you want an autographed copy the price is $60 for the hardback and $45 for the paperback, plus $8 shipping for each. Go here for purchasing details. The ebook is available everywhere for $5.99 (before discount) at amazon, or direct from my ebook publisher, ebookit. If you buy it from ebookit you don't support the big tech companies and the author gets a bigger cut much sooner.
The audiobook is also available at all these vendors, and is also free with a 30-day trial membership to Audible.
"Not simply about one mission, [Genesis] is also the history of America's quest for the moon... Zimmerman has done a masterful job of tying disparate events together into a solid account of one of America's greatest human triumphs."--San Antonio Express-News
This new graph seems more reasonable to me. We will not “know” until 2025 happens.
I still have the nagging question that whether some of the sun spots we are now seeing would have been missed during the Maunder Minimum.
Small telescopes with filters cannot compare to our modern sensing devices. Just the same, the minimum lasted for nearly 50 years associated with a little ice age.
Just like we are experiencing now with the late spring. Trees are trying to bud but we’re still getting snowfall in northern Utah. (Ski resorts are upset because of the coronavirus, they could’ve been making money until July…)
Cosmic radiation counts are high, associated with the usual wet weather leading to flooding in summer. It’s normal for the low in the sunspot cycle. I remember shoveling 3 feet of snow off the roof in 94 allowing me to walk down without a ladder, and sandbagging rivers that are normally small streams in the low of 83. The great Salt Lake got so high that it threaten to flood the airport. Which led to $50 million worth of pumps to drain the lake down, flooding the desert with water. (Pumps have not been used since 86?)
Oh no, possible bad news about the new comet, it might be breaking apart.
http://www.astronomerstelegram.org/?read=13620
Phill O makes a very good observation about the 1650 sunspot observation, maybe it was not as granular as we need it to be now. There is another metric to watch, the (TSI) measurement taken over time shows a steady decline in sun total radiance. Whatever is going on with total sun activity does not seem to have reached bottom yet.