The New York Times today published an op-ed outlining the serious dangers we face should the Sun unleash a solar flare or coronal mass ejection of sufficient power to knock out our electrical grids. After describing the horrors of Hurricane Katrina, the author then says
We are similarly unready for another potential natural disaster: solar storms, bursts of gas on the sun’s surface that release tremendous energy pulses.
Now this might be interesting, had it been published in 1988. At that time, the electrical grids used in the U.S. and Canada were very much unprepared for a sudden solar storm. Moreover, the Sun at that time was ramping up towards a particularly active solar maximum. The result: On March 13, 1989, the power grid that supplied electricity to Quebec and 200 utility companies in the U.S. came crashing down, overloaded by a power surge caused by a burst of energy sent hurtling towards the Earth, by the Sun.
However, to report this threat today as if it was news is somewhat laughable. Since the 1990 solar maximum, the world’s electrical systems have been very much aware of the problem and have instituted numerous safeguards should the Sun burp at them again. It was for this reason that there were few problems during the next solar maximum in 2001, even though it was almost as powerful as the maximum in 1990.
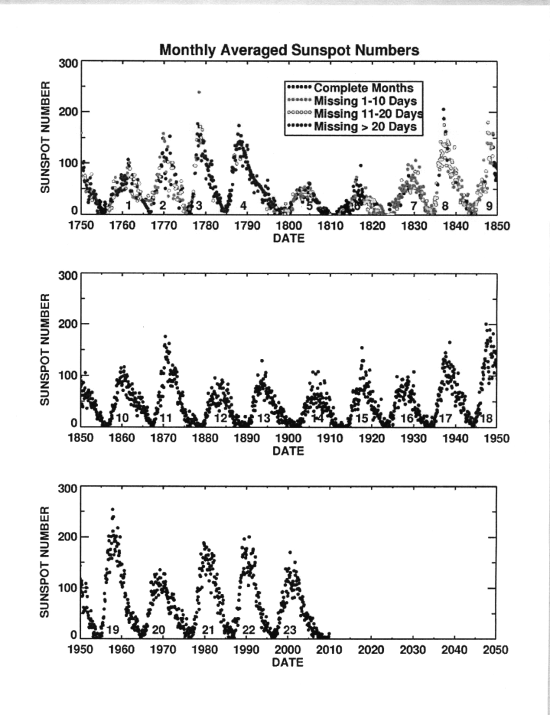
The real news story concerning the Sun is how inactive it has been, for reasons scientists do not understand. Not only was the recently concluded solar minimum the longest and deepest in almost a hundred years, the subsequent solar activity leading to the next solar maximum has been far weaker than every prediction. At the moment, the Sun appears headed for the weakest solar maximum in two hundred years. And when that last happened, the Earth experienced a period of significantly cold weather, also for reasons that scientist do not yet understand.
It is this story that journalists should be covering.