
Sunspot update: Practically no sunspots for a month
It is sunspot update time again! NOAA today updated its monthly graph for tracking the Sun’s monthly sunspot activity, and I have posted it below, with additional annotations by me to show the past solar cycle predictions.
July and August had seen sunspot numbers higher than the new NOAA prediction (shown by the red curve on the graph below). September however was almost totally blank, with only two weak sunspots for the entire month, as shown on the SILSO graph below.
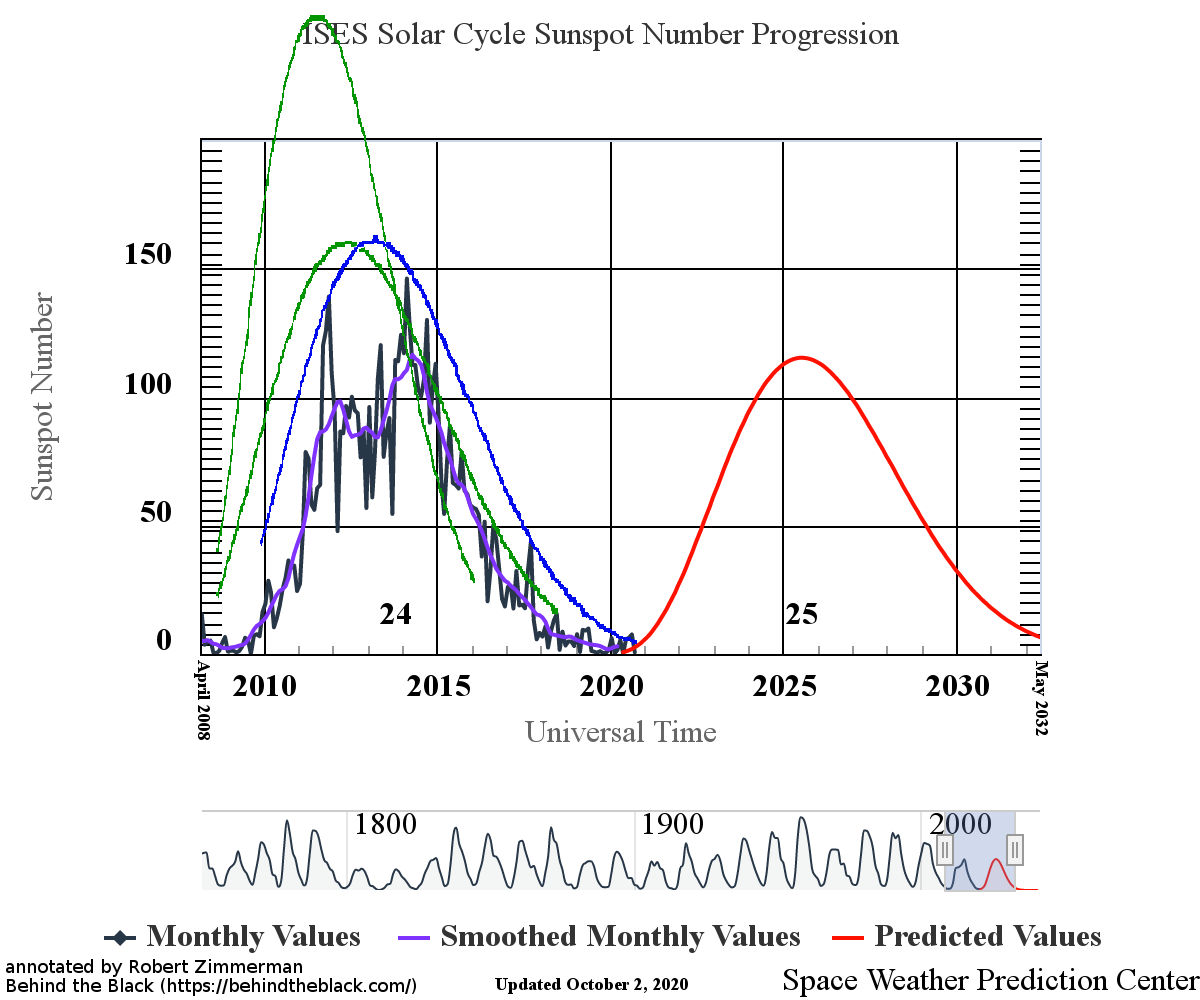
The graph above has been modified to show the predictions of the solar science community for the previous solar maximum. The green curves show the community’s two original predictions from April 2007 for the previous maximum, with half the scientists predicting a very strong maximum and half predicting a weak one. The blue curve is their revised May 2009 prediction. The red curve is the new prediction, first posted by NOAA in April 2020.
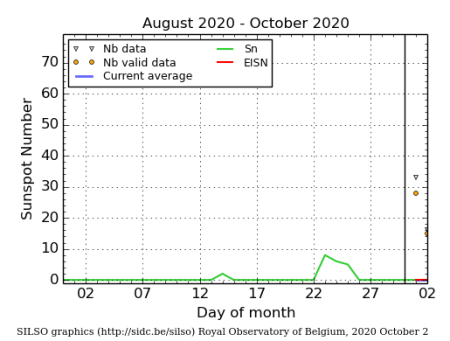
The first sunspot, on September 14th, was so weak it was never given an official number. The second, which was named on September 24th, was stronger but very short-lived, disappearing very quickly.
Both however had polarities assigning them to the upcoming maximum. We have now gone almost three months with no sunspots with the previous maximum’s polarity. These two facts reinforce the conclusion reached by NOAA scientists two weeks ago that the ramp up to the next maximum has started, and that the slowly ending minimum reached its nadir in December 2019.
At the same time, two weeks ago those same scientists hinted that because solar activity in the previous two months had exceeded their prediction, the next maximum would match the strength of the last maximum, weak though it was. Their official prediction, from April 2020 had however predicted a slightly weaker maximum in 2025, and the lack of activity in September suggests the April prediction might still hold.
It really is too early to say. For activity to fluctuate above and below the prediction from month to month is entirely normal. We will not get a full sense of the strength of the upcoming maximum until it is mostly passed and we can look back at it with some perspective.
We will also have to wait till then, sometime in 2026, to get some sense of that maximum’s effect on the Earth’s climate. Historically, the data suggests that low sunspot activity corresponds to a cooling of the global climate. The cause of this correlation is not yet understood, but the correlation appears to exist, nonetheless. Not only did the Little Ice Age in the 1600s correspond to the last grand minimum, when there were no sunspots for most of that century, the lack of any warming in the past twenty years matches the weak sunspot cycles over that same period.

On Christmas Eve 1968 three Americans became the first humans to visit another world. What they did to celebrate was unexpected and profound, and will be remembered throughout all human history. Genesis: the Story of Apollo 8, Robert Zimmerman's classic history of humanity's first journey to another world, tells that story, and it is now available as both an ebook and an audiobook, both with a foreword by Valerie Anders and a new introduction by Robert Zimmerman.
The print edition can be purchased at Amazon or from any other book seller. If you want an autographed copy the price is $60 for the hardback and $45 for the paperback, plus $8 shipping for each. Go here for purchasing details. The ebook is available everywhere for $5.99 (before discount) at amazon, or direct from my ebook publisher, ebookit. If you buy it from ebookit you don't support the big tech companies and the author gets a bigger cut much sooner.
The audiobook is also available at all these vendors, and is also free with a 30-day trial membership to Audible.
"Not simply about one mission, [Genesis] is also the history of America's quest for the moon... Zimmerman has done a masterful job of tying disparate events together into a solid account of one of America's greatest human triumphs."--San Antonio Express-News
“Historically, the data suggests that low sunspot activity corresponds to a cooling of the global climate. The cause of this correlation is not yet understood, but the correlation appears to exist, nonetheless.” Hendrik Svensmark wrote explaining how the strength of the suns magnetic field changes global temperature. When the sun’s magnetic field is stronger the earth warms and when the sun’s magnetic field weaker the earth cools.
Chilling Stars : A New Theory of Climate Change by Henrik Svensmark
https://www.amazon.com/Chilling-Stars-New-Theory-Climate/dp/1840468661
Terrence: It is a reasonable hypothesis, as are others. It, as the others, have not been proven.
Bob wrote “The cause of this correlation is not yet understood, but the correlation appears to exist, nonetheless. Not only did the Little Ice Age in the 1600s correspond to the last grand minimum, when there were no sunspots for most of that century, the lack of any warming in the past twenty years matches the weak sunspot cycles over that same period.”
Very accurate analysis!
I continue to point out that the data collected during the Maunder minimum was spotty as indicated by the data points (https://en.wikipedia.org/wiki/Solar_cycle#/media/File:Sunspot_Numbers.png) rather than a data line.
It seems most likely that many of the sun spots from this next cycle would not have been observed during the Maunder Minimum. However, like Bob indicates, we will not know much more until 2026.
In the mean time, the farmers a bit northwest of Calgary Alberta have had a harvest this fall. For two years running, they have had to finish the harvest in the spring. It is still my opinion that the marginal farming areas should be closely monitored as they tend to show climate changes first. And that this monitoring requires decades not years.
Terrence Thanks for the tip on the book! Will read next month.
“. . . the lack of any warming in the past twenty years matches the weak sunspot cycles over that same period.”
Lack of warming?
https://woodfortrees.org/plot/wti/from:2000/trend/plot/gistemp/from:2000/trend/offset:-0.4/plot/hadcrut4gl/from:2000/trend/offset:-0.3/plot/rss/from:2000/trend/offset:-0.14/plot/uah6/from:2000/trend/offset:0.04
As far as Henrik Svensmark’s, new theory on climate change, the physic of the theory have proven to be based on rock solid physics. This is a good explanation of theory: https://www.icr.org/article/new-theory-climate-change/. The CLOUD experiment at CERN in Geneva confirmed Hendrik’s eperiments done at the Center for Sun-Climate Research at the Danish National Space Center.
Andrew, do you ever look at what you’re posting? In 20 years there has been a .3° increase in temperature +/- .1
With the daily temperature variations extending to summer/winter temperature extremes… It all averages out to an insignificant variation.
Less than 1/2 of a degree is statistically unimportant. A mole hill, is just a mole hill. But you would argue to look at it from an ant’s point of view.
Even the sun itself has an insignificant variation in its temperature. 1° difference despite the sunspot cycle. That is twice as much as earths variation as a comparison.
Climate change takes thousands of years, baring an extinction level event, (planet impact, comet impact, “massive” solar flare, the collision of our solar system with supernova gas/dust remnants drifting between stars…) which our geological record show has happened at least three major times.
Out of the many theories, the 11 year Solar cycle connection of increase in cosmic radiation’s direct correlation to reflecting cloud cover has excellent evidence in “cause and affect”.
The slightly larger molecule of a trace gas carbon dioxide has no cause-and-effect correlation that can be shown in any direct measurements.
There is direct evidence that the sun heats the earth. You can take a baseline when the sun is off (night) and subtract that from when the sun is on (day) and you have the total of heating that can/does occur. It does not account from where the rest of the heat comes from. (The moon and the space station varies from 300° below 0 to 250°F… A 550° variation that the earth does not experience but only a fraction of)
Magnetic heating through induction occurs, Io is proof of this. Does the sun magnetically heat the earth? I would think that the suns magnetic field would need to be stronger than the earths magnetic field to have an effect and overcome the modulating influence.
There is a weak but measurable difference between a magnetic field that matches the earth in the way it pushes against “compressing” the earths magnetic field with “like” polar fields pushing against each other, and the next solar cycle with the negative and positive polls complement each other and are attracted to each other. This causes every other solar cycle to be more extreme in droughts/floods.
Yes, magnetism does affect our weather. This is good science. The farmers almanac relies on this guesstimation and is correct more than it is wrong.
Hydrogen sulfide was not mentioned in Terrence’s excellent link to article on cloud chamber experiment. (It is lighter but similar to sulfur dioxide) This is by far the most influential part of our acid rain atmosphere. It is emitted by plankton in the ocean and is condensation nuclei for water vapor. Without it, water molecules charges oppose each other and will not form clouds.
Cosmic radiation enhances this process. It also ads an electrical charge to the clouds. Charged ions cannot hold still inside of a magnetic field causing the storm to rotate. A cyclone on land, a hurricane at sea which gets stronger and rotates faster with the greater pH of the storms water vapor. (Frequent lightning is a good indicator of high pH)
Personally I favor the heating mechanism to be primarily atmospheric pressure causing friction. Reproducible everywhere it is measured from below sea level (hot) to the tops of the mountains (cool) average dry heat loss of 5.4° per thousand feet you rise above sea level.
Similar metrics can be applied to every planet in our solar system that has an atmosphere. The thicker the atmosphere, the hotter the planet. The Suns influence is small in comparison.