
Sunspot update: Hints of the next maximum
It’s time for another monthly sunspot update! NOAA yesterday updated its monthly graph for tracking the Sun’s monthly sunspot activity, and as I do every month, I am posting it below with additional anotations by me to show the past and new solar cycle predictions.
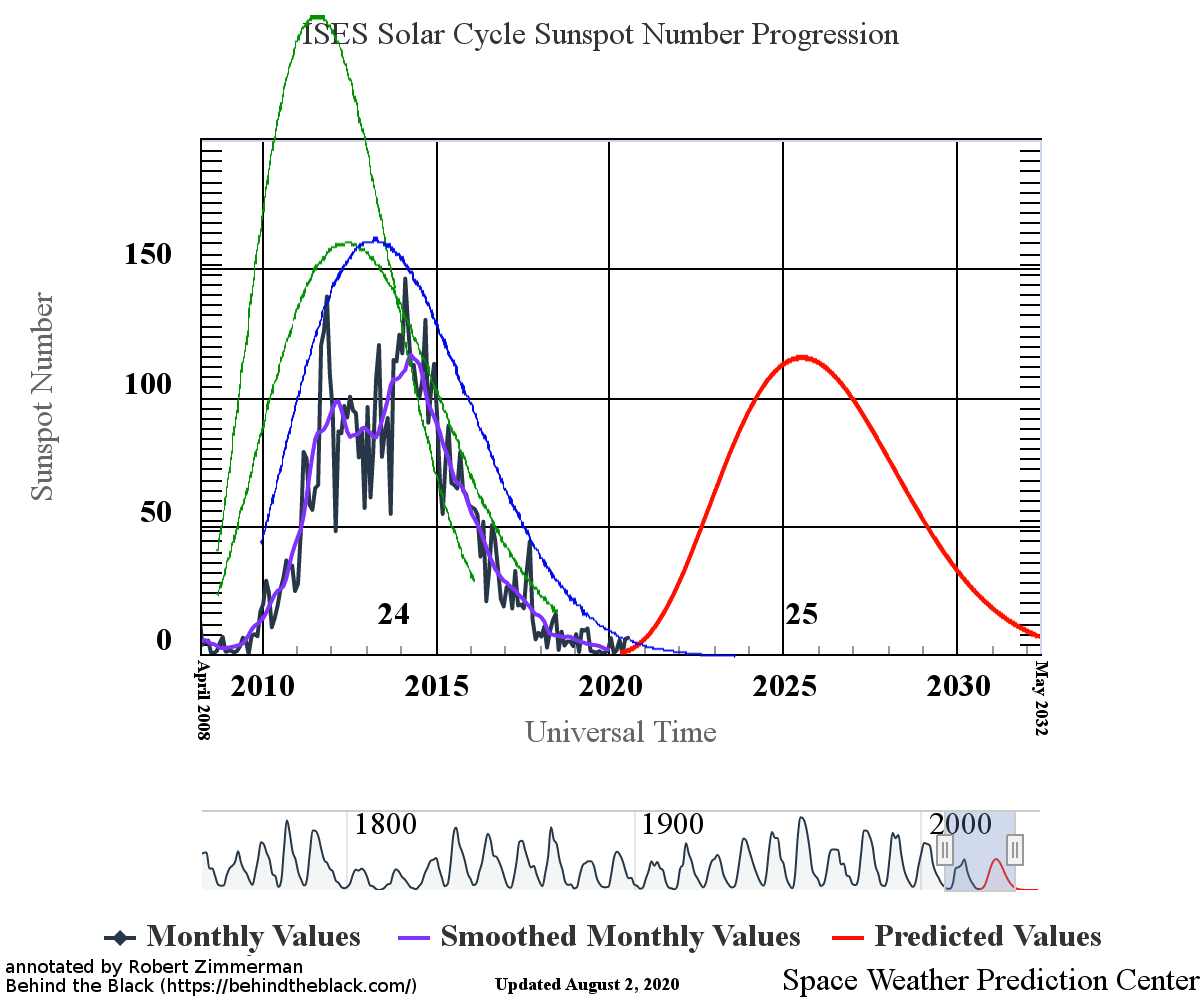
The graph above has been modified to show the predictions of the solar science community for both the previous and upcoming solar maximums. The green curves show the community’s two original predictions from April 2007 for the previous maximum, with half the scientists predicting a very strong maximum and half predicting a weak one. The blue curve is their revised May 2009 prediction. The red curve is the new prediction, first posted by NOAA in April 2020.
July continued the trend from June, with a slight uptick in activity. The SILSO graph below for July illustrates this.
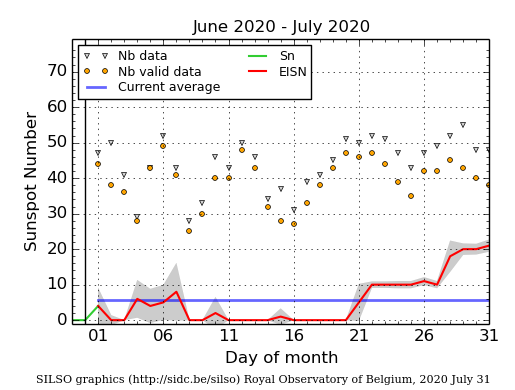
It shows the one weak sunspot at the beginning of the month and the two stronger sunspots late in the month. The first sunspot had a polarity linking it to the previous fading solar cycle, while the last two had polarities assigning them to the new solar cycle. This continues the trend of the past few months, where more and more new sunspots belong to the new cycle as the old cycle fades away.
NOAA’s newly designed interactive graph above, introduced in April, appears in one way very fundamentally different than the old monthly graph that I had been annotating since 2010. In 2010 and for the next decade I needed to add the predictions of the solar science community as the past solar maximum unfolded, since NOAA would remove those predictions month by month as they added the actual data.
Now that we have several months of updates with this new inactive graph, we find that the agency has apparently made the wise decision to leave the red curve for the next prediction in place as the months unfold. I will no longer need to add it.
Moreover, if you go to the first link above and hover your mouse over the red curve, they also now provide the actual sunspot prediction for each particular month, and for the past two months they provide both that prediction and the actual sunspot count. This allows us to see instantly the difference between prediction and actuality. For May actual activity was less than the prediction, while in June it was higher. The fluctuation up and down is entirely acceptable, but that it is fluctuating above and below the prediction suggests the prediction is a strong one.
Of course, we are only two months into the new eleven-year cycle, so drawing conclusions at this point is silly. To find out how good the prediction for the next sunspot maximum really is we will just have to wait and see.

On Christmas Eve 1968 three Americans became the first humans to visit another world. What they did to celebrate was unexpected and profound, and will be remembered throughout all human history. Genesis: the Story of Apollo 8, Robert Zimmerman's classic history of humanity's first journey to another world, tells that story, and it is now available as both an ebook and an audiobook, both with a foreword by Valerie Anders and a new introduction by Robert Zimmerman.
The print edition can be purchased at Amazon or from any other book seller. If you want an autographed copy the price is $60 for the hardback and $45 for the paperback, plus $8 shipping for each. Go here for purchasing details. The ebook is available everywhere for $5.99 (before discount) at amazon, or direct from my ebook publisher, ebookit. If you buy it from ebookit you don't support the big tech companies and the author gets a bigger cut much sooner.
The audiobook is also available at all these vendors, and is also free with a 30-day trial membership to Audible.
"Not simply about one mission, [Genesis] is also the history of America's quest for the moon... Zimmerman has done a masterful job of tying disparate events together into a solid account of one of America's greatest human triumphs."--San Antonio Express-News
Welcome goes to the sunspots of cycle 25! I am tired of the wetter and cooler and cloudier conditions brought by the hiatus in solar activity a global warming. I rather long the the skies of 20 years ago.
However, being realistic, I am waiting to see how big the next maximum will be before declaring the solar drop over. As have said before, cycles happen slowly over time and if we are going into a grand minimum, it will happen gradually.
You see how the double top of the maximum has gotten wider and wider for each recent cycle. It is as if the cycle is composed of two waves with slightly different period. If this pattern of widening tops continues, the cycles will get flatter and flatter. One could estimate the rate of widening tops to predict for how many cycles sun spot activity will be lower than it was in the recent cycle.
Thanks for your work Robert
What are your thoughts on this prediction?
“Our method predicts that SC25 will probably be among the strongest solar cycles ever observed, and that it will almost certainly be stronger than present SC24 (116 spots) and most likely stronger than the previous”
https://arxiv.org/pdf/2006.15263.pdf
Shawn Williams: It is a prediction, based not on a true understanding of causes of the solar cycle, but on the patterns of past solar cycles. They are trying to extrapolate future events based on past performance, without really understanding why that past performance occurred.
In other words, you could just as well flip a coin.
They could be right, but it won’t really mean much because their prediction will not really teach us much about the Sun itself.
Take a look at the two green lines for the past maximum. These was the solar scientist communities predictions then. The high prediction was especially bad. And both were based on the same techniques.
A study (by Reinhold+) of light fluctuations of a few hundred nearby Sun like stars in Gaia data, recently showed that almost all of them are much more active than the Sun. Judging from variations in their light curves. Perhaps the Sun is only temporarily (as in thousands to millions of years) less active, or perhaps it is somehow different altogether.
An average Solar corona mass ejection contains about as much mass as Mount Everest, in individual protons. I think that heliophysics should be the top most priority of science, it might be good to know something about that little baby that contains 99.86% of the mass of the Solar system. I’m glad there are two new spacecrafts out there to study it, and also new observatories on the ground. Heliophysicists seem confused by several recent results. Dynamic magnetic fields is the most difficult subject in all of physics.
Btw, have you heard of this paper that finds a correlation between Solar activity and Earthquakes? But only for big Earthquakes. It is suggested that variations in the Sun’s magnetic field squeeze the Earth’ inner enough to trigger them.
https://www.nature.com/articles/s41598-020-67860-3
Everybody is saying what a dud 24 was, but the University of CO team came out in 2013 and said we missed another Carrington Event by a week in July 2012? As we become more and more dependent on technology for our survival, shouldn’t every maximum cycle be considered dangerous?