Yippee! Solar scientists finally get it right
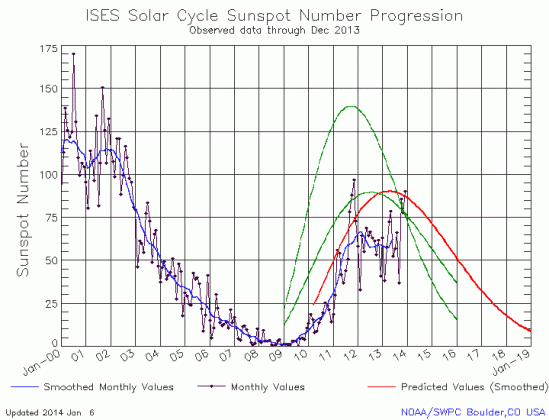
Earlier this week NOAA posted its monthly update of the solar cycle, showing the sunspot activity for the Sun in December. As I do every month, I am posting it here, below the fold, with annotations.
December was an active month for sunspots, so much so that for only the second time during this solar maximum has the Sun’s activity actually met and exceeded the predictions of the solar science community. In fact, the Sun’s high activity in both November and December has made this second peak in solar maximum almost as strong as the first peak in October 2011. Normally, the second peak of a double-peaked maximum is relatively weak. Not so this time.

The graph above has been modified to show the predictions of the solar science community. The green curves show the community’s two original predictions from April 2007, with half the scientists predicting a very strong maximum and half predicting a weak one. The red curve is their revised May 2009 prediction.
The recent activity has also done a lot to rehabilitate the predictions of the solar science community. Unlike the fakery used by the solar scientists at the Marshall Space Flight Center, where they change their prediction after the fact to make it seem like they got it right, the red line prediction shown above was made in May 2009. For a long while, during the extended dip between the maximum’s double peaks, that prediction looked like it had significantly overestimated the activity levels of the Sun during maximum, as well as overestimated the length of the solar maximum. The strength of the second peak, however, has now made that 2009 prediction more closely resemble the actual maximum, even if the overall numbers are less than predicted.
I wish we could say this closer match was because of the accuracy of the theories of the solar science community. Unfortunately, I don’t think that is the case. Instead, I think it is more luck than planning that has made this prediction appear reasonably close.
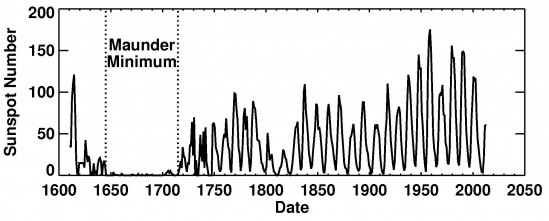
I also want to emphasize that though the Sun has been active these last two months, that activity still remains quite low for a solar maximum. You can get a sense of this just looking at the graph above and comparing this maximum with the previous maximum in 2000-2001. The previous maximum was far far stronger. We can also compare this maximum will all past maximums, as shown on this graph:

In order to find any maximums weaker than the present maximum you must go back two hundred years.
That event in the early 1800s was known as the Dalton Minimum. During that time period the Earth’s climate cooled significantly. Pinning the cooling to the weak solar maximum is not so simple, however. For one, there was also significant volcanic activity at that time, which also acts to cool the climate. For another, no one really has come up with a convincing mechanism for linking low solar sunspot activity to a cooling climate. There are theories, but nothing has been solidly proven.
What will happen next? Who knows? We can only watch, and wait.
On Christmas Eve 1968 three Americans became the first humans to visit another world. What they did to celebrate was unexpected and profound, and will be remembered throughout all human history. Genesis: the Story of Apollo 8, Robert Zimmerman's classic history of humanity's first journey to another world, tells that story, and it is now available as both an ebook and an audiobook, both with a foreword by Valerie Anders and a new introduction by Robert Zimmerman.
The print edition can be purchased at Amazon or from any other book seller. If you want an autographed copy the price is $60 for the hardback and $45 for the paperback, plus $8 shipping for each. Go here for purchasing details. The ebook is available everywhere for $5.99 (before discount) at amazon, or direct from my ebook publisher, ebookit. If you buy it from ebookit you don't support the big tech companies and the author gets a bigger cut much sooner.
The audiobook is also available at all these vendors, and is also free with a 30-day trial membership to Audible.
"Not simply about one mission, [Genesis] is also the history of America's quest for the moon... Zimmerman has done a masterful job of tying disparate events together into a solid account of one of America's greatest human triumphs."--San Antonio Express-News


I am worried about another minimum while I am on this Earth (mostly made of bodies of water). Fascinating charts. Thank you Robert!