
Polygons and an inexplicable depression in ancient Martian crater floor
Click for full image.
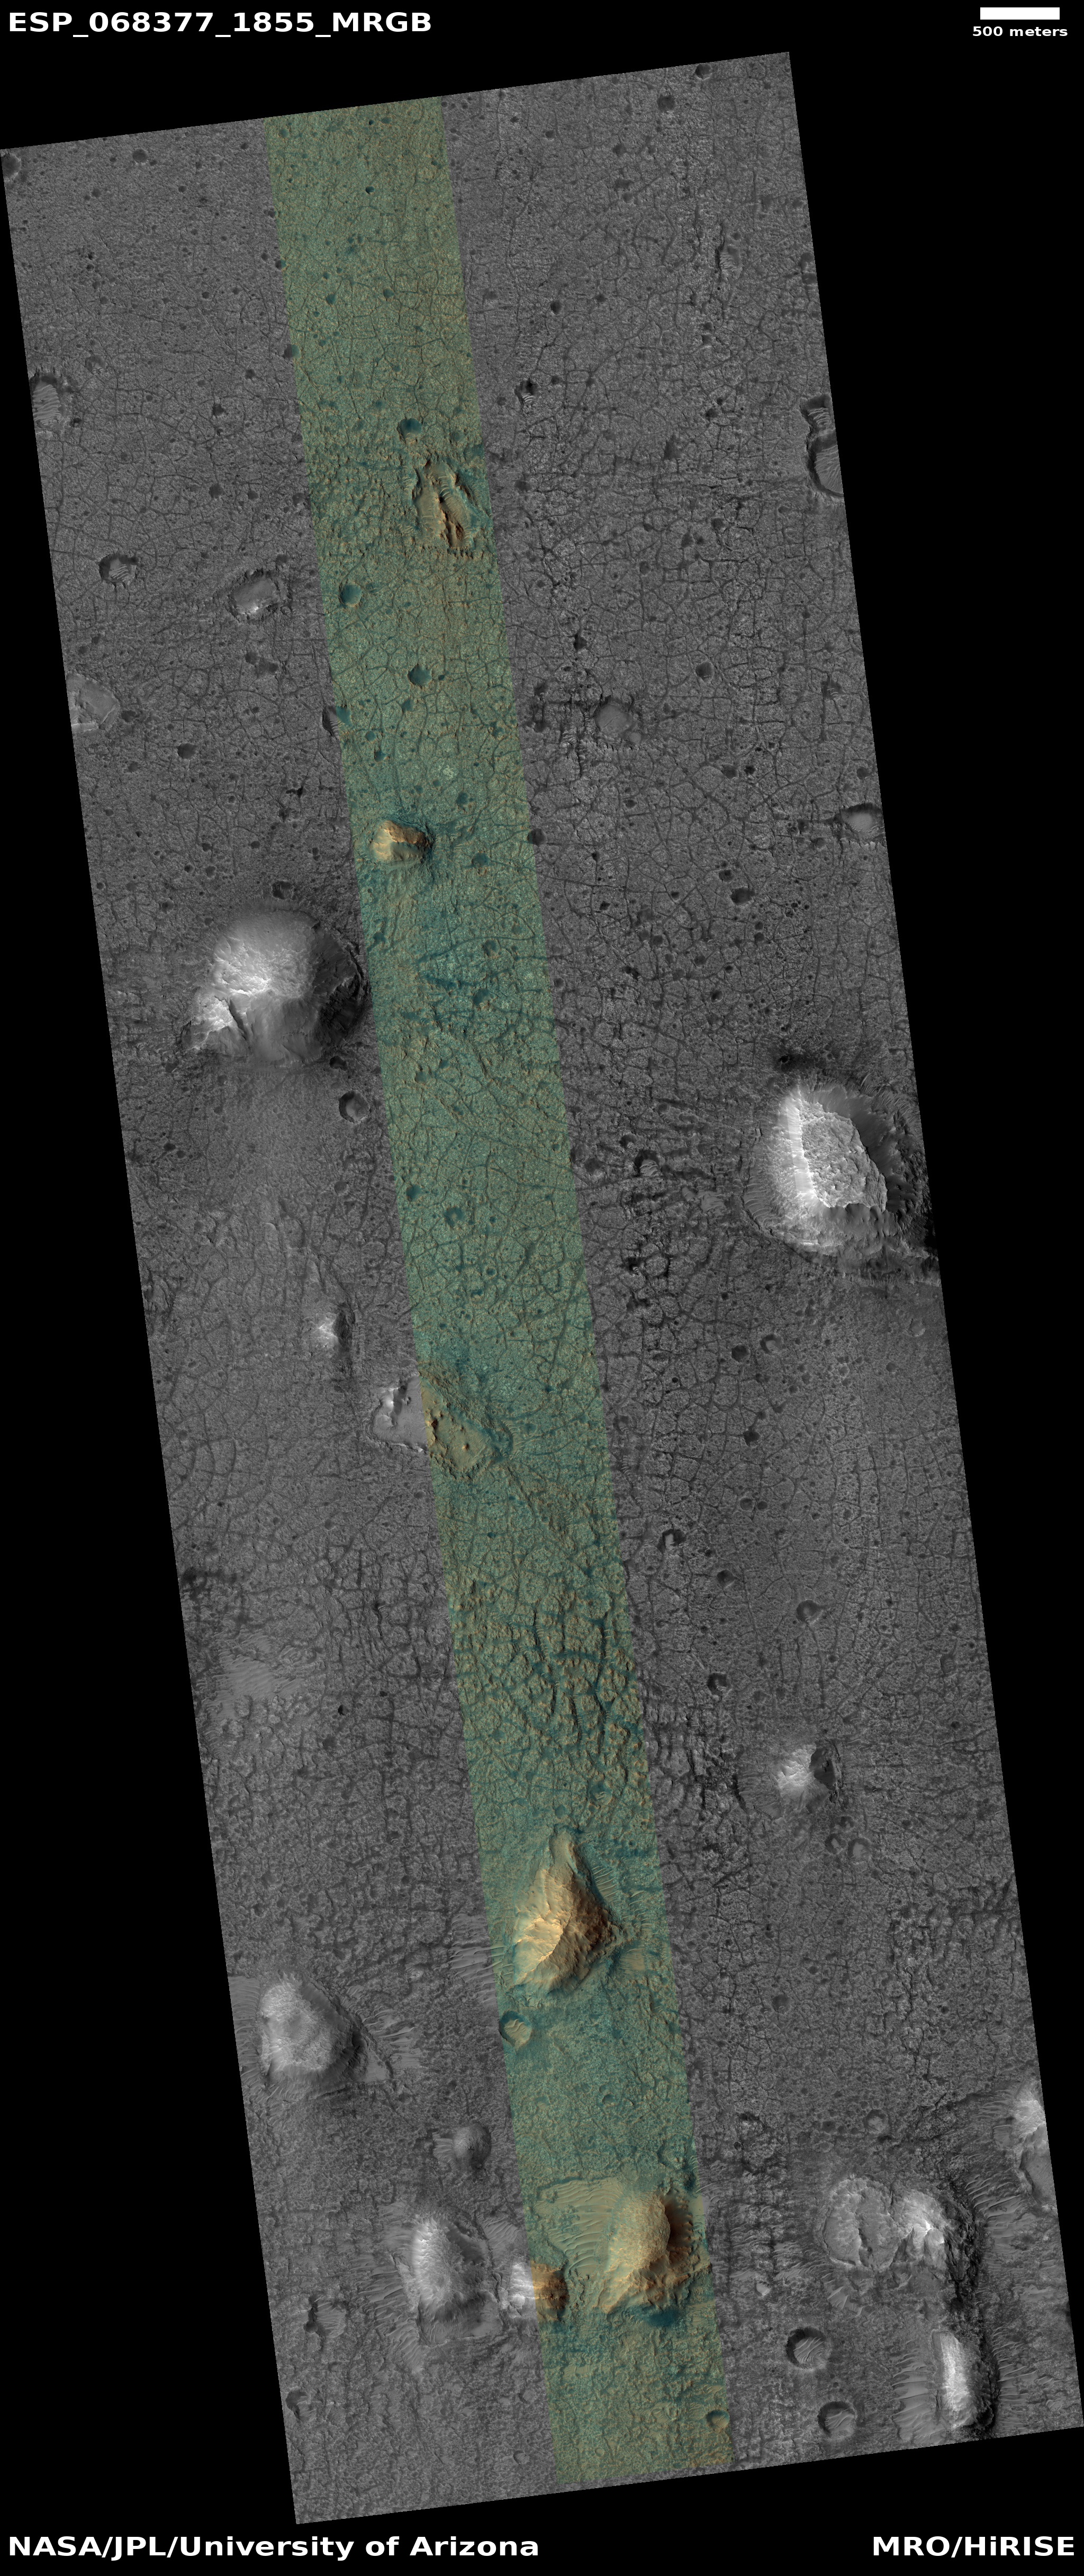
Cool image time! The photo to the right, cropped to post here, was taken on February 26, 2021 by the high resolution camera on Mars Reconnaissance Orbiter (MRO) of a small section of the floor of 85-mile-wide Galilaei Crater.
The main focus of the image is the polygonal cracks that cover the flat low areas of the crater floor, interspersed randomly by small mesas and shallow irregular depressions. The depression in this particular image is especially intriguing. It to me falls into my “What the heck?!” category, for I can’t imagine why among this terrain of polygons and pointed mesas there should suddenly be an irregularly shaped flat depression with a completely smooth floor that has no cracks at all.
The polygons are less puzzling. Galilaei Crater is very old, its impact thought to have occurred about 4 billion years ago. Though it sits at 5 degrees north latitude, practically on the Martian equator and thus in what is now Mars’ most arid region, scientists believe that once there was a lot of liquid surface water here. The overview map below illustrates this.
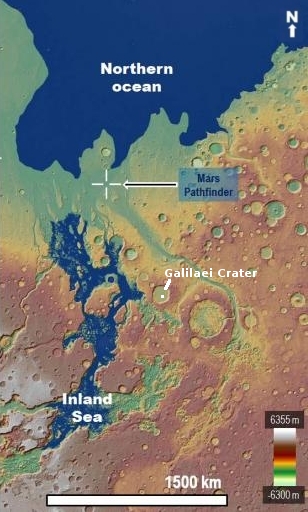
This map, annotated slightly to post here, comes from figure 3 in a 2019 paper that proposed, based on existing data and simulations, that once catastrophic floods had burst forth from the giant canyon Valles Marineris to the west to form the intermittent oceans shown on the map. The white dot in Galilaei Crater marks the location of today’s image.
When this region was wet, the floor of Galilaei Crater was likely also wet, with its own short-lived lake. When that lake dried away, the cracks formed. As explained in an 2010 paper,
We propose desiccation to be a dominant mechanism for the formation of Crater Floor Polygons without ruling out thermal contraction as a possible contributor in some cases. This implies that lakes or water-rich sediments occupied the craters in the past.
On Earth such polygons are frequently seen in mud flats after the water has evaporated away. The mud as it dries contracts, and cracks to form the polygons.
The greenish-blue color of the terrain in the color strip suggests [pdf] a coarse material of sand or rocks, though I am not certain this is entirely correct. The tiny mesas in the depression are light reddish and tan, suggesting those mesas are covered by dust and fine-grained sand. Why the polygons and the floor of the depression have little dust (assuming my interpretation of the colors is correct) while the surrounding flats do not is most baffling.

On Christmas Eve 1968 three Americans became the first humans to visit another world. What they did to celebrate was unexpected and profound, and will be remembered throughout all human history. Genesis: the Story of Apollo 8, Robert Zimmerman's classic history of humanity's first journey to another world, tells that story, and it is now available as both an ebook and an audiobook, both with a foreword by Valerie Anders and a new introduction by Robert Zimmerman.
The print edition can be purchased at Amazon or from any other book seller. If you want an autographed copy the price is $60 for the hardback and $45 for the paperback, plus $8 shipping for each. Go here for purchasing details. The ebook is available everywhere for $5.99 (before discount) at amazon, or direct from my ebook publisher, ebookit. If you buy it from ebookit you don't support the big tech companies and the author gets a bigger cut much sooner.
The audiobook is also available at all these vendors, and is also free with a 30-day trial membership to Audible.
"Not simply about one mission, [Genesis] is also the history of America's quest for the moon... Zimmerman has done a masterful job of tying disparate events together into a solid account of one of America's greatest human triumphs."--San Antonio Express-News
85 mile wide crater? That’s a large collision. The impact was most likely so deep that the surface became molten, drying on the surface first making the cracks? It would occur similar to the mud except harder than bed rock that time would not erase very quickly.
It’s interesting that there are hills of unusual shape along with the depression. Some of The surface cracks are radial. The green color at first look like plants growing, it’s more likely to be obsidian with copper in it? I like the mountain that a portion simply broke off… (Reminds me of the crevice that Paul Atreides ran in to in the movie Dune)
The temperatures at large impacts can generate matter with unusual properties. The temperatures can exceed a supernova. That’s what happens when an immovable object comes in contact with an unstoppable force…
Science talks of a mars sized object hitting the earth… There’s strong evidence that our moon was that object, even analysis of the moon rocks indicates that it is composed of the same material as the earth. 2 miles of the lunar surface, facing the earth, is missing… exposing the lunar core. The missing mass approximates the mass of continents on earth that have continental drift. Dirt sliding around on the ancient mineral bodies of plankton that makes up the calcium carbonate (limestone) that was once our agent carbon dioxide atmosphere. The heat and pressure turns it into oil and volcanoes. People often ask, “how did the dinosaurs get so deep beneath the earth?” 10% of earths crust is made of the once living lime stone that all the lunar material fell on top of. That’s how it got the name “fossil fuel”.
The plasma from such a collision would’ve created heavy elements similar to a supernova… except rather than be blasted into space, the transmuted elements would be absorbed by the surrounding impacting dirt allowing the heavy elements to be found on the surface or crust of our world. (We’re not made of star stuff, we are made of moon stuff)
If this theory holds true, it’s possible that mars is rich in heavy metals, possibly uranium. The Helena’s basin would be a prime location.
Max asked, ” The green color at first look like plants growing, it’s more likely to be obsidian with copper in it?”
What you need to do is spend some time reading the pdf document here that provides a quick overview of the meaning of these colors (which by the way is from the RGB image). The IRB image can be obtained at the link for the photo itself.
You then need to explore the CRISM site here, as that database is of the imaging spectrometer on MRO. I tried to dig in, but didn’t have the time or energy to really find out more. If you dig you might find CRISM images of this location that tell us something about the geology here.
The green is of course not plant life. I also strongly doubt it is ” obsidian with copper.” The color is not really true. You need to do some research, and we all would be most interested in what you find.
Thanks Z-man, this 4 page article explains the limited light wave length of the pictures taken, the reduction of information for transmission, and errors that occur due to cold, or cosmic rays.
The green color of the picture reminded me of a bad Mars fantasy science-fiction movie with Val Kilmer. (they came across valleys of life that created oxygen to allow them to remove their helmets)
The 2000 trailer, full movie is also available.
https://duckduckgo.com/?q=mars+movie+with+val+kilmer&t=h_&iax=videos&ia=videos&iai=https%3A%2F%2Fwww.youtube.com%2Fwatch%3Fv%3DIpF691nGMW8
You are right Robert, the colors are not true.
Here’s my selective highlights of the article for those with low education (like me) or Limited time or attention span;
Information for Scientific Users of HiRISE Color Products:
“Reduced Data Records (RDRs) — These are radiometrically calibrated, geometrically mapped images with lossless JPEG2000 compression (file names end in .JP2). Lossless compression means that the data volume is reduced without sacrificing any information.”
“The official PDS products are enormous files, typically larger than 1 GB in size, and quite difficult to work with. So we also create a set of RDR “Extras” at reduced scale or with slightly “lossy” compression to produce smaller files that are much easier to display. “Lossy” compression eliminates some small-scale detail (such as random noise), which enables compression into smaller files that are easier to transfer, store, and manipulate.”
“3-color image consisting of RED, BG, and synthetic blue images. The BG image has been warped to line up with the RED.NOMAP image. The BG (blue-green) bandpass primarily accepts green light. The synthetic blue image digital numbers (DNs) consist of the BG image DN multiplied by 2 minus 30% of the RED image DN for each pixel. This is not unique data, but provides a more appealing way to display the color variations present in just two bandpasses, RED and BG colors. For the Extras products, each color band is individually stretched to maximize contrast, so the colors are enhanced differently for each image based on the color and brightness of each scene. Scenes with dark shadows and bright sunlit slopes or with both bright and dark materials are stretched less, so the colors are less enhanced than is the case over bland scenes.”
“Radiometric calibration of the data into units of I/F (ratio of reflected intensity to incident intensity of sunlight in each color bandpass) is a work in progress. It is probably accurate to only about the 10% level, but we hope to improve this in the future. Atmospheric variability introduces a comparable or even larger uncertainty in the I/F of surface materials.”
“Two of the CCDs have special noise or DN dropouts due to poor performance of an electronic part when cold: CCDs IR10 and RED9. These bad data sometimes lead to poor contrast stretches and odd colors. One other CCD, BG13, has on very rare occasions (twice that we know of while imaging Mars) suffered from a malfunction that creates down-column smear. Due to these problems we have sometimes applied more pixel binning (4×4 rather than 2×2) to BG13 or IR10 than to BG12 or IR11, resulting in loss of color resolution over half of the color image.”
You have heard Zimmerman talk about pictures taken at random to keep the camera warm, there’s your reason why. That’s enough, you have a synopsis. For all the details read article.
Max: I must note that every time I have in the past described what the colors of these Mars images likely mean I have always linked to this pdf. Always. It is my policy to always provide my source material. You should not have needed me to direct you to it. You should looked closely at my links and found it for yourself.
My goal is not to be critical, but to encourage all of my readers to dig a little before expressing opinions. There is no reason you can’t do the same research I do, since all of the raw data is on the web, available for everyone.
Zimmerman, your diligence to the details and the source materials is the primary reason that’s your opinion is highly valued and trusted. Your only agenda is the truth, unlike the sensualized mockingbird media that lies to us repeatedly.
Due to “reading comprehension” in an unfamiliar scientific language, your explanations are usually more informative than the articles.
I have a bad habit of commenting on my first impressions usually associated with stories or visuals from movies.
The imaging spectrometer link is interesting but harder to understand its usefulness because of its complexity and variations in different spectral wavelengths. The choosing of Gail crater for example is explained from pictures in 2012, but haven’t been verified by the rover yet as to being correct. I’m excited for the verification of the mapping results, as we have the proof of concept of a working helicopter.
An example from CRISM (contact reconnaissance imaging spectrometer for Mars)
“Not all of the observations exhibit spectral evidence for mineralogical diversity. If a location is covered in dust, it appears red in VNIR_FEM and VNIR_FM2 and bland in the other products. Sites with diversity in igneous mineralogy will appear interesting in IR_MAF. Sites with minerals formed by interaction of crustal rocks with liquid water will appear interesting in IR_PHY and IR_HYD. Sites obscured by dust or water ice clouds or hazes on the surface or as clouds will appear greenish in VNIR_FEM, with a strong but gradual gradient in color across the observation.”
It’s time for me to get ready for another 13 hour shift, 50 hour work week. Hopefully I can find the time for more research on my phone as this is a very detailed and complex instrument. This is more Edwards Bailywick as I have no background in the subject.
Max: When you get a chance, can you include the link to the specific CRISM page where you found this quote:
“Sites obscured by dust or water ice clouds or hazes on the surface or as clouds will appear greenish in VNIR_FEM, with a strong but gradual gradient in color across the observation.”
That information might (but only might) explain the green color in the subject image above.
Saw your query on my 15 minute lunch break.
http://crism.jhuapl.edu/msl_landing_sites/index.php
(I thought an education site would be easier to understand and self-explanatory)
The quote is near the bottom of the first page just above the four links to the spectral pictures of other sites that we’re being considered, Before Gail crater was chosen.
Another detail that I didn’t mention is that light in the UV and infrared, which are not visible, we’re given faults colors.
There are many materials and molecules that are invisible to the naked eye that will stand out in these wave lengths. Very useful. But useless to a person looking at the picture without a color legend.
Polygon is what happens when your Parrot flew away