
Sunspot update: Activity again exceeds prediction but ramp up pauses
NOAA this weekend published, as it does at the start of every month, its October update of its monthly graph that tracks the number of sunspots on the Sun’s Earth-facing hemisphere. As I have done since I started this website in 2011, I have published that graph below, with some additional details added to provide context.
An increase in sunspot activity in September wiped out the decline seen in August, so that the sunspot number in September once again matched or exceeded the numbers seen during the middle of the previous solar maximum from 2012 to 2014, a low period of activity between that maximum’s two peaks. Activity also continued to exceed the predictions of the panel of government solar scientists put together by NOAA.
At the same time, since May the ramp up to maximum has stalled, something I noted last month and has now become more evident.
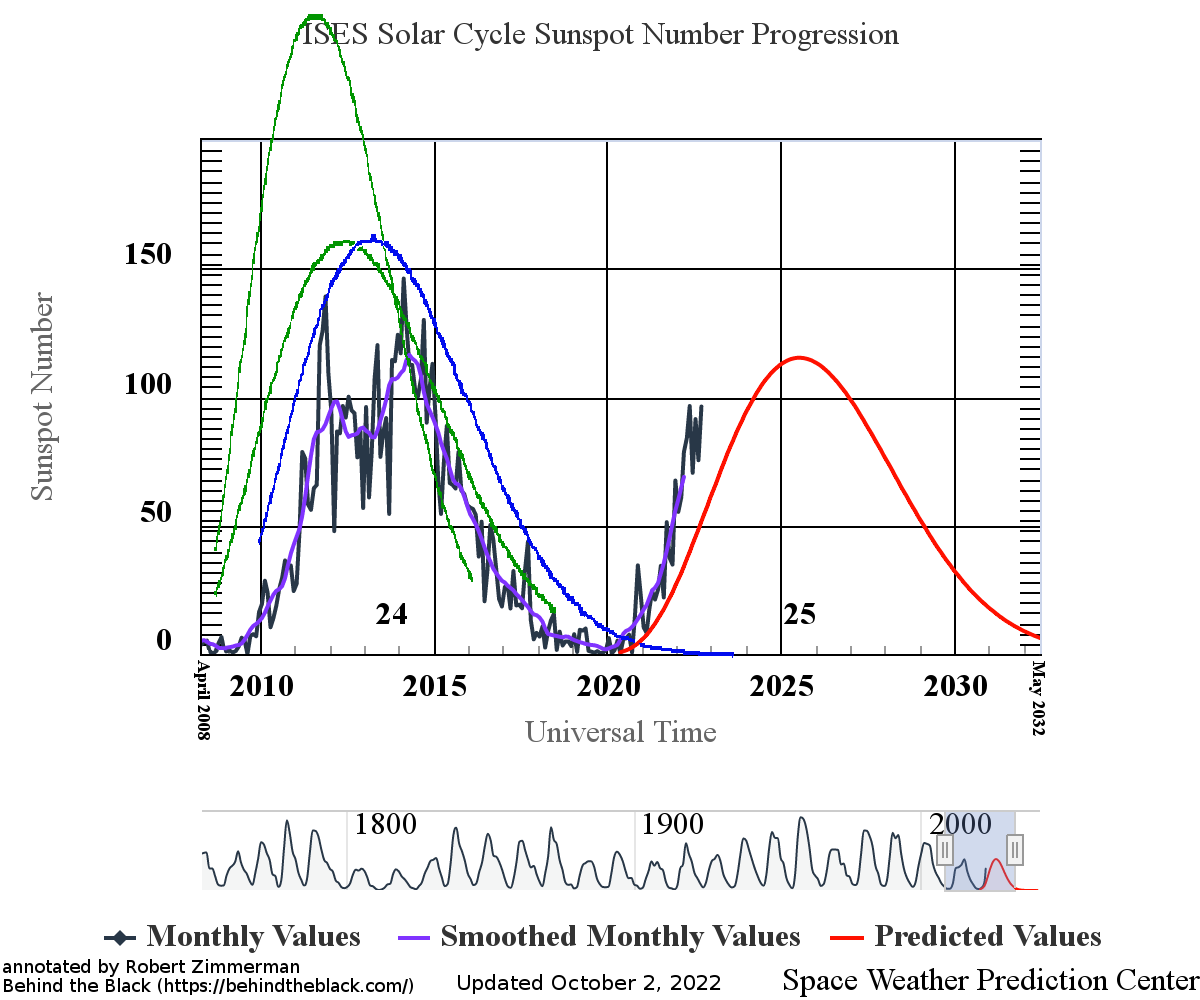
The graph above has been modified to show the predictions of the solar science community for the previous solar maximum. The green curves show the community’s two original predictions from April 2007 for the previous maximum, with half the scientists predicting a very strong maximum and half predicting a weak one. The blue curve is their revised May 2009 prediction. The red curve is the new prediction, first posted by NOAA in April 2020.
Moreover, the month of September saw no blank days again. For 2022 so far there has been only one day that the visible hemisphere of the Sun has been blank, and it is likely we will not see another blank day for several years, until maximum is over and sunspot activity begins its decline to minimum again.
Though the numbers continue to be well above the consensus prediction of NOAA’s panel of solar scientists (as indicated by the red curve), the stall this summer suggests the possibility that in the end the maximum might not be has high as these early high numbers have suggested.
All guesses. We will not really know what the Sun will do in the next four years, until it does it. The prediction for this upcoming maximum is as much an educated guess as the three predictions made for the last solar maximum. Though scientists know the Sun’s magnetic dynamo creates sunspots, no one really understands the fundamental processes that create the Sun’s sunspot cycles. Thus, almost all the predictions made by scientists have generally been based on extrapolating different interpretations of past performance into the future, a very unreliable prediction method.
The higher activity however strongly suggests the likelihood that the Earth’s climate will warm somewhat because of that activity. We as yet do not understand the connection, but circumstantial evidence since the 1600s links higher sunspot activity to warmer temperatures on Earth, and lower activity to colder temperatures.
It will be very educational to see if that pattern holds over the next four years.

On Christmas Eve 1968 three Americans became the first humans to visit another world. What they did to celebrate was unexpected and profound, and will be remembered throughout all human history. Genesis: the Story of Apollo 8, Robert Zimmerman's classic history of humanity's first journey to another world, tells that story, and it is now available as both an ebook and an audiobook, both with a foreword by Valerie Anders and a new introduction by Robert Zimmerman.
The print edition can be purchased at Amazon or from any other book seller. If you want an autographed copy the price is $60 for the hardback and $45 for the paperback, plus $8 shipping for each. Go here for purchasing details. The ebook is available everywhere for $5.99 (before discount) at amazon, or direct from my ebook publisher, ebookit. If you buy it from ebookit you don't support the big tech companies and the author gets a bigger cut much sooner.
The audiobook is also available at all these vendors, and is also free with a 30-day trial membership to Audible.
"Not simply about one mission, [Genesis] is also the history of America's quest for the moon... Zimmerman has done a masterful job of tying disparate events together into a solid account of one of America's greatest human triumphs."--San Antonio Express-News
I am back on the mend after total knee replacement Aug 30. 5 weeks post surgery and I am feeling halfway human!
Alberta has returned this year to the falls I got used to during the 1970s and 80s. Is this linked to the sun spot uptick? Amateur astronomy has not returned yet to those levels in that the crystal clear skies are not totally back.
However, farmers are very happy to be able to get all the crops off the field in the foothills just east of the Rockies, something that has not happened for a number of years now.
Thank you for all your contributions here, it’s hard to find good information these days… your site is a breath of fresh air. The solar cycle has been of particular interest to me over the past several years, and after a several year deep dive, seems obviously connected to climate.. Imagine my surprise when I learned that the suns impact was never part of the global warming/climate change discussion. Only recently has this connection been postulated/investigated. Given the current geopolitical focus on policies to “fix” the climate, and considering the enormous costs (political/economic/societal) associated with this, the fact that the sun’s part continues to be obfuscated looks intentional.. and damming… and the fact that it’s so hard to find good data on this subject feels intentional as well. Thank you again.
Doug Johnson: Thank you for your kind words. To paraphrase Yoda, I not only try, I do.
To all: If you like what I do, than consider dropping a donation or subscription into the tip jar. Every penny helps. Or you might consider reading my books, where I actually dig much deeper into the subject at hand.
You will comply and you will agree:
“We own the science” https://youtu.be/cKoAoPi8sc0
You can have any opinion you desire, as long as it is the correct opinion.
Has it paused, or are we really seeing an unexpectedly early and disappointing peak before the Sun proceeds on to a Maunder class persistent minimum? Given the decline we’ve seen over the preceding few.cycles which have triggered conjecture of a possible grand minimum I don’t think this possibility can be easily discounted because we have no data on what entering such an era really looks like in detail, much less models to attempt to explain it well.
As you say Bob, the uncertainty of science. But time will tell : )
MDN: You are correct. This pause in the ramp up could be the maximum followed by a quick decline, though I have doubts. I think it is more likely an example of the typical random fluctuates that occur during all solar cycles.
But we shall see.
A large sunspot with strong negative and positive polarity has just came around the edge of the sun. The conditions are right for X class flares over the next few weeks. A few smaller flares are becoming exciting as a strong one overtakes a week one recently. Click on the image to start a movie what what it may look like as it engages the earth.
https://www.swpc.noaa.gov/products/wsa-enlil-solar-wind-prediction
With the increase of solar activity, the drought should worsen. But then, can we really predict? The last solar cycle was very low in intensity, and yet we did not get more than average rainfall as the model would indicate. Normally, droughts should worsen, Pakistan is still underwater as is many other places… except the ones who normally get a lot of rain.
Strange times.
Solar influence on the earth is very complex, some influences we are still discovering (like ground currents triggered by Aurora) and it was wondered if the suns magnetic field creates or induces current and heating of our core, the way Jupiter’s magnetic field heats Io…
The sun flips polarity every 11 years which works against or complements the earths magnetic field. Every other cycle’s affect on the earth is intense.
Solar radiation in the visible spectrum is responsible for around 30° of heat each day (and all life photosynthesis hence “the green zone”) subtract the low of the night from the high temperatures of the day to know how the sun’s shortwave radiation affects/heats your local area.
Long wave heat heat does not penetrate our atmosphere, we know this because the higher we climb in altitude, the colder it gets. The 2 law of thermodynamics. (it’s the law!)
The space station and the moon are 250°F in the sunlight. None of this heat penetrates our upper atmosphere which is very cold day or night.
(in shadow, space temperature drops to 300° below zero… Making earths average temperature 100° warmer than the moon’s average temperature near the equator… The cratered polar areas are as cold as Pluto)
The largest known solar influence, summer to winter, is caused by the tilting of the earth. Shorterwave radiation, which is also the most energetic, has a reflective index that tends to reflect off the curvature of our atmosphere rather than penetrate allowing mostly longer wave radiation to penetrate during the daytime resulting in cooler light without much heat content. That’s why winter exists.
This is the same reason that Antarctica doesn’t melt during the summer with 24 hour sunlight for four months. In fact it averages 40° below 0 Fahrenheit during the summer, only 30°F warmer then six months of winter with no sunlight.
My point? The suns influence on our climate is not the largest factor. Very important yes, but there is something missing in the model not accounted for responsible for the majority of our climate.