
Sunspot update: After going through the roof last month, sunspots drop into the attic this month
With the start of another month NOAA this week updated its graph that tracks the number of sunspots on the Sun’s Earth-facing hemisphere. As I do every month, I have posted that updated graph below, adding some additional details to provide some context.
Last month the number of sunspots rocketed upward to the highest seen since 2014, and only the second time since November 2002 that the Sun was that active. In February those high numbers dropped, though the sunspot activity during the month remained well above the 2020 prediction by NOAA’s panel of solar scientists.
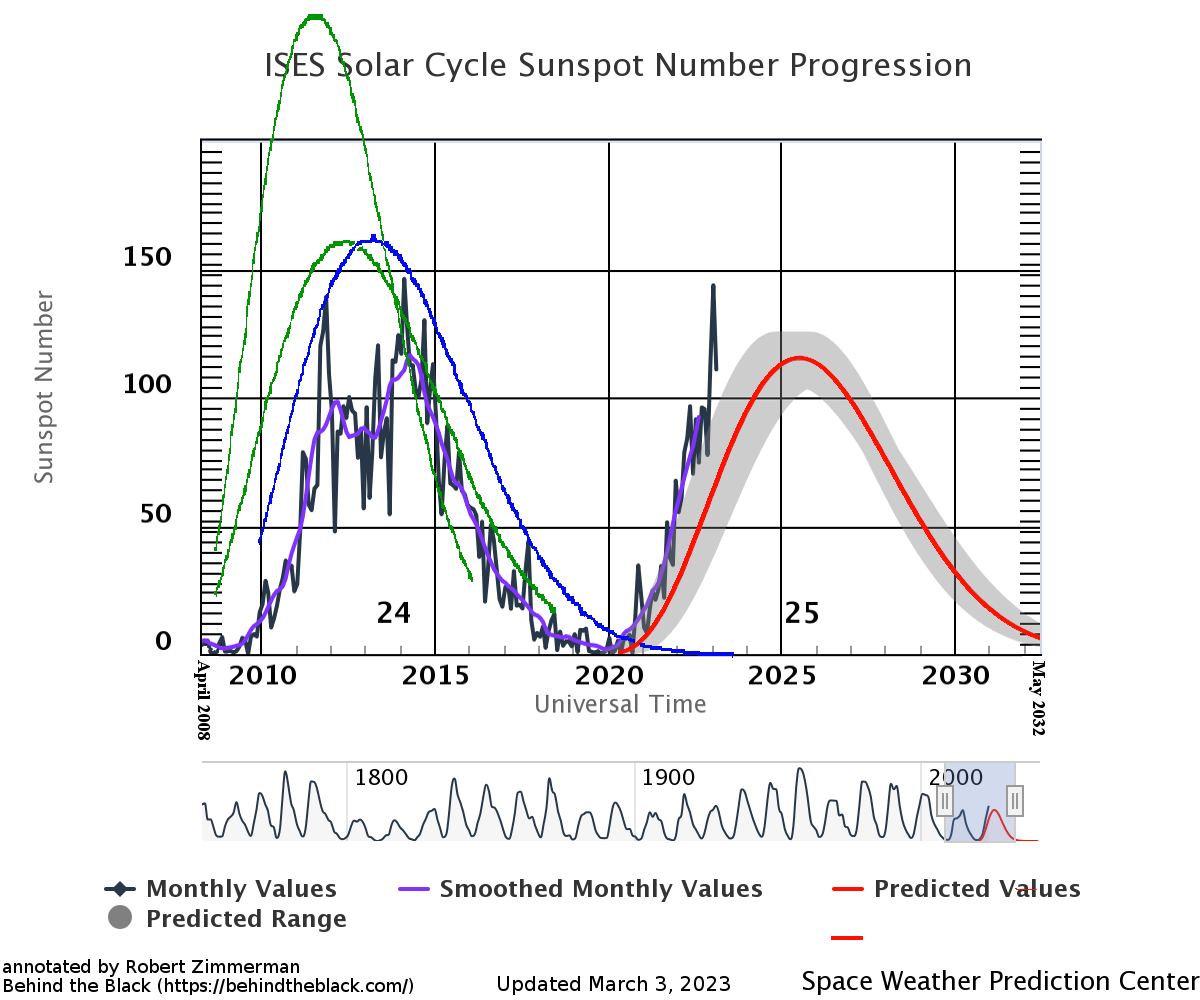
The graph above has been modified to show the predictions of the solar science community for the previous solar maximum. The green curves show the community’s two original predictions from April 2007 for the previous maximum, with half the scientists predicting a very strong maximum and half predicting a weak one. The blue curve is their revised May 2009 prediction. The red curve is the new prediction, first posted by NOAA in April 2020.
Since last month the people at NOAA who post this graph decided to add one detail, the margin of error for the 2020 prediction, what they label as the “predicted range.” This is a reasonable addition, since the prediction was always considered an estimate, not precise.
This range suggests that the 2020 prediction is not failing as badly as it appeared previously. Since the beginning of the ramp up to maximum in 2020 the actual sunspot numbers have been consistently above the predicted red curve, suggesting the maximum in 2025 would be much more active than predicted. By showing the predicted range, NOAA’s scientists make it obvious that those higher counts were not that far different than the upper end of the prediction. In fact, except for last month, the actual numbers month-to-month tracked quite closely to that upper end.
Even so, the numbers still suggest that the prediction of NOAA’s panel was too conservative, and that the outlier prediction of a high solar maximum by a handful of dissenting solar scientists could still be right.
For example, the drop in February merely brought the sunspot count closer to the high end of the 2020 NOAA prediction, but still well above it. The trend lines still point to a more active solar maximum than the 2020 prediction.
Based on the Sun’s 11-year sunspot cycle, maximum should occur sometime around 2025, about two years from now. We shall therefore not have long to wait to find out whether that maximum will be weak or strong. If strong, the ramp up in the next year will continue over the next year. If weak, that ramp up should stall, so that it remains hovering at the level of activity it is right now, and stay there for the next three to four years. The previous three solar maximums all did this, staying near the top of activity for three to four years before sunspot activity began to decline to solar minimum.

On Christmas Eve 1968 three Americans became the first humans to visit another world. What they did to celebrate was unexpected and profound, and will be remembered throughout all human history. Genesis: the Story of Apollo 8, Robert Zimmerman's classic history of humanity's first journey to another world, tells that story, and it is now available as both an ebook and an audiobook, both with a foreword by Valerie Anders and a new introduction by Robert Zimmerman.
The print edition can be purchased at Amazon or from any other book seller. If you want an autographed copy the price is $60 for the hardback and $45 for the paperback, plus $8 shipping for each. Go here for purchasing details. The ebook is available everywhere for $5.99 (before discount) at amazon, or direct from my ebook publisher, ebookit. If you buy it from ebookit you don't support the big tech companies and the author gets a bigger cut much sooner.
The audiobook is also available at all these vendors, and is also free with a 30-day trial membership to Audible.
"Not simply about one mission, [Genesis] is also the history of America's quest for the moon... Zimmerman has done a masterful job of tying disparate events together into a solid account of one of America's greatest human triumphs."--San Antonio Express-News
The more informative graph would have many more cycles displayed, to help folk get the complete picture. However, that would not be helpful if one has an alternate objective (lying with statistics).
Too bad NOAA does not provide this info.
Phill O: You are wrong. NOAA’s graph displays ALL past cycles, and gives you the option to pick and choose and even zoom in on one or more.
Minor edit in first paragraph: “ I have posted”
Andi: Thank you as always. Fixed.
I stand corrected. One needs to click on your “graph” link and then click “ALL” on NOAA’s site.
They do not have the historical data for the 10.7 cm band though.
It was very informative to view the historical sunspot data.
Interesting – sunspots UP – we’re warmer here – sunspots DOWN – cooling off here! Gee, could there be ANY connection? I’ve noticed the SAME PHENOMENON when I adjust the THERMOSTAT in my HOME!
BLSinSC: You are doing the same as the global warmists. Daily weather is merely random local fluctuations and is completely separate from large scale long term climate shifts. Nor is the sunspot effect, if confirmed, immediate. It takes time to show up.