
Sunspot update: The pause in the ramp up to solar maximum continues
NOAA has once again published its monthly update of its monthly graph that tracks the number of sunspots on the Sun’s Earth-facing hemisphere. Below is that November graph, annotated by me with some additional details added to provide context.
Though sunspot number continued to be much higher than the prediction (almost double), October saw almost exactly the same number of sunspots as seen in September, which is why this new graph seems almost identical to last month’s.
In other words, the pause in the ramp up to solar maximum, first noted in August, continues.
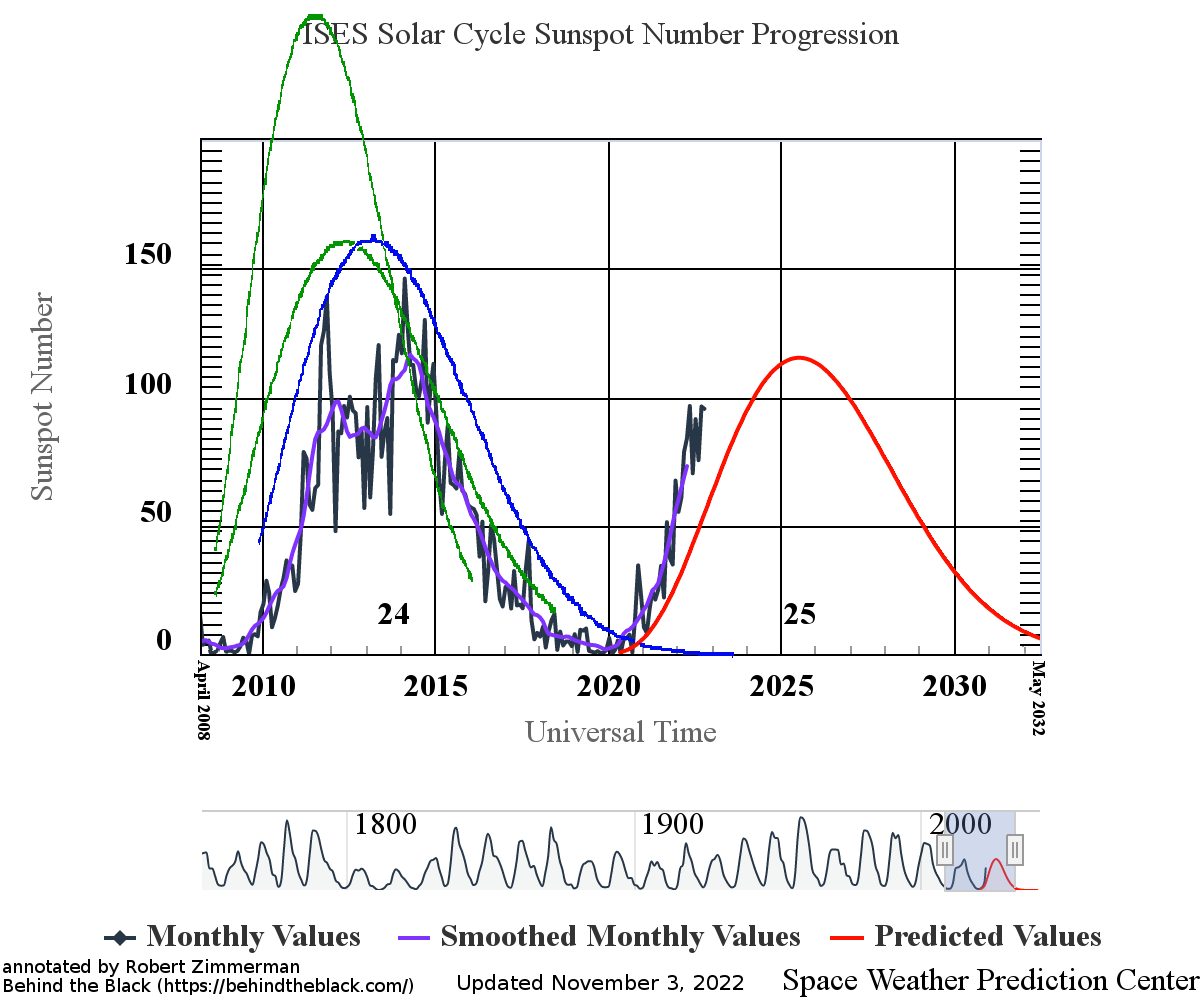
The graph above has been modified to show the predictions of the solar science community for the previous solar maximum. The green curves show the community’s two original predictions from April 2007 for the previous maximum, with half the scientists predicting a very strong maximum and half predicting a weak one. The blue curve is their revised May 2009 prediction. The red curve is the new prediction, first posted by NOAA in April 2020.
October once again saw no blank days, continuing the pattern for all of 2022, which has so far seen only one day where the visible hemisphere of the Sun has been blank. It is likely we will not see another blank day now until after maximum, several years hence.
The pause in ramp up suggests the maximum might not be as high as the earlier numbers had suggested. At the same time, the numbers continue to be significantly higher than the prediction, (95 to 54). For the actual sunspot count to come into alignment with the prediction we would either need to see a sudden drastic drop in sunspots (unlikely), or the pause would have to continue for the rest of this year and all of ’23. The prediction did not call for a monthly sunspot number of 95 until January 2024.
Such a pause would be entirely unprecedented. The normal solar cycle pattern for the past two centuries is for the ramp up to be steep and fast, and the ramp down to be more gradual. The peak at maximum meanwhile can go on for months, even a year or so.
What is going to actually happen in the coming months however remains a complete mystery. As I wrote last month,
We will not really know what the Sun will do in the next four years, until it does it. The prediction for this upcoming maximum is as much an educated guess as the three predictions made for the last solar maximum. Though scientists know the Sun’s magnetic dynamo creates sunspots, no one really understands the fundamental processes that create the Sun’s sunspot cycles. Thus, almost all the predictions made by scientists have generally been based on extrapolating different interpretations of past performance into the future, a very unreliable prediction method.
In other words, the Sun will do what the Sun wants to do.
Stay tuned. It is going to be most interesting to see what happens over the rest of this year.

On Christmas Eve 1968 three Americans became the first humans to visit another world. What they did to celebrate was unexpected and profound, and will be remembered throughout all human history. Genesis: the Story of Apollo 8, Robert Zimmerman's classic history of humanity's first journey to another world, tells that story, and it is now available as both an ebook and an audiobook, both with a foreword by Valerie Anders and a new introduction by Robert Zimmerman.
The print edition can be purchased at Amazon or from any other book seller. If you want an autographed copy the price is $60 for the hardback and $45 for the paperback, plus $8 shipping for each. Go here for purchasing details. The ebook is available everywhere for $5.99 (before discount) at amazon, or direct from my ebook publisher, ebookit. If you buy it from ebookit you don't support the big tech companies and the author gets a bigger cut much sooner.
The audiobook is also available at all these vendors, and is also free with a 30-day trial membership to Audible.
"Not simply about one mission, [Genesis] is also the history of America's quest for the moon... Zimmerman has done a masterful job of tying disparate events together into a solid account of one of America's greatest human triumphs."--San Antonio Express-News
This appears to be the peak of Northern sunspot activity. Now we will likely have a second slightly higher peak of Southern sunspots. This cycle may turn out to be weak and short. Always fascinating to watch.
I find it very interesting that sunspot activities SHOULD be causing Our Earth to heat and cool respectively. I have seen any charts that show the TRUE Temps vs Sunspot Activities. They must be relative or the experts would be denying the relationship daily and at full volume! I do know for certain that when I step out of the shade into direct sunlight I feel an IMMEDIATE difference. I do believe the sun has FAR more influence on Our Earth than cow farts!
BLSinSC wrote: “I find it very interesting that sunspot activities SHOULD be causing Our Earth to heat and cool respectively. I have seen any charts that show the TRUE Temps vs Sunspot Activities.”
The relationship, if it exists, is not a strong influencer. The hypothesis is that the solar magnetic fields associated with sunspots tend to divert galactic rays away from the Earth. These rays are thought to be catalysts for cloud formation, so during decades-long durations of lower number of sunspots, the galactic rays are able to form slightly more clouds than during times with sunspots, and the Earth cools over the course of those decades. The hypothesis in not that the Earth’s temperature follows the sunspot curves, such as the ones shown above in Robert’s post, but acts slowly over decades or centuries. The observations from which this hypothesis is created are the Maunder Minimum and the Dalton Minimum. The first corresponds with the Little Ice Age, and the temperatures fell a little bit for the second. The Earth’s temperatures have been generally rising ever since, so global warming may be nothing more than a recovery from the Little Ice Age and not so much associated with man’s activities, such as the tremendous increase in fossil fuel use over the past century. To verify this hypothesis and come closer to making it a theory, it must successfully predict cooler temperatures during another long period of low sunspot activity. This could take a few centuries to happen, or it could conceivably by happening now.
We already know that the “pause” that started in the mid 1990s was either not associated with man’s activities, as we all were still emitting similar amounts of CO2, or else it was associated with the reduction of CO2 production from the United States, despite not signing the Kyoto Accords, so the U.S. reduction has saved us from global warming. Since no one cheered that we were saved but instead the climatologists declared that the cessation of global warming was merely a “pause,” then we can conclude that there are forces influencing Earth’s temperatures and climates that far exceed man’s contributions. Otherwise the temperature increase would not have paused, because we continue to emit CO2, worldwide, at an ever increasing rate, thanks to the Kyoto Accord and the Paris Agreement exclusions of China, India, Brazil, and other nations that continue to build many, many coal fired power plants and to burn down their rain forests.
Another hypothesis that I came across in the late 1980s associated global temperature changes with the periods of the solar maxima. I vaguely remember that higher temperatures corresponded to shorter periods. This hypothesis came with a chart showing the correlation, but I kept the chart folded in my wallet and it eroded away in about a decade.
Many non-solar hypotheses also exist. One of my favorites is that forested areas tend to have higher air temperatures because the vegetation releases water vapor, a major greenhouse gas. Since we now have more forested land in many parts of the world than we had a century ago, this hypothesis suggests that global temperatures should be increasing. However, Brazil is burning down its rain forest, so maybe global temperatures could begin to fall. Ha! Now that I think about it, maybe that is where the “pause” comes from: Brazil has finally burned more forest than has grown elsewhere. This hypothesis just moved up one notch closer to the solar cycle hypotheses on my favorites.
Edward: “We already know that the “pause” that started in the mid 1990s was either not associated with man’s activities,”
The 1998-2012 “pause” was a result of a very strong El Nino in 1998 with moderately strong La Nina at the end of the period. El Nino with westerly winds dominant at low and mid latitudes pushes warm water from the West Pacific across the ocean, slowing ocean uptake of atmospheric warmth, La Nina has conditions with easterly winds dominant at those latitudes pushing cooler East Pacific surface water across the oceans surface, increasing ocean uptake of atmospheric warmth. The effect is easy to see when you look at what temperatures were doing in the Pacific compared to the rest of the world.