
Changes on the slopes of Olympus Mons?
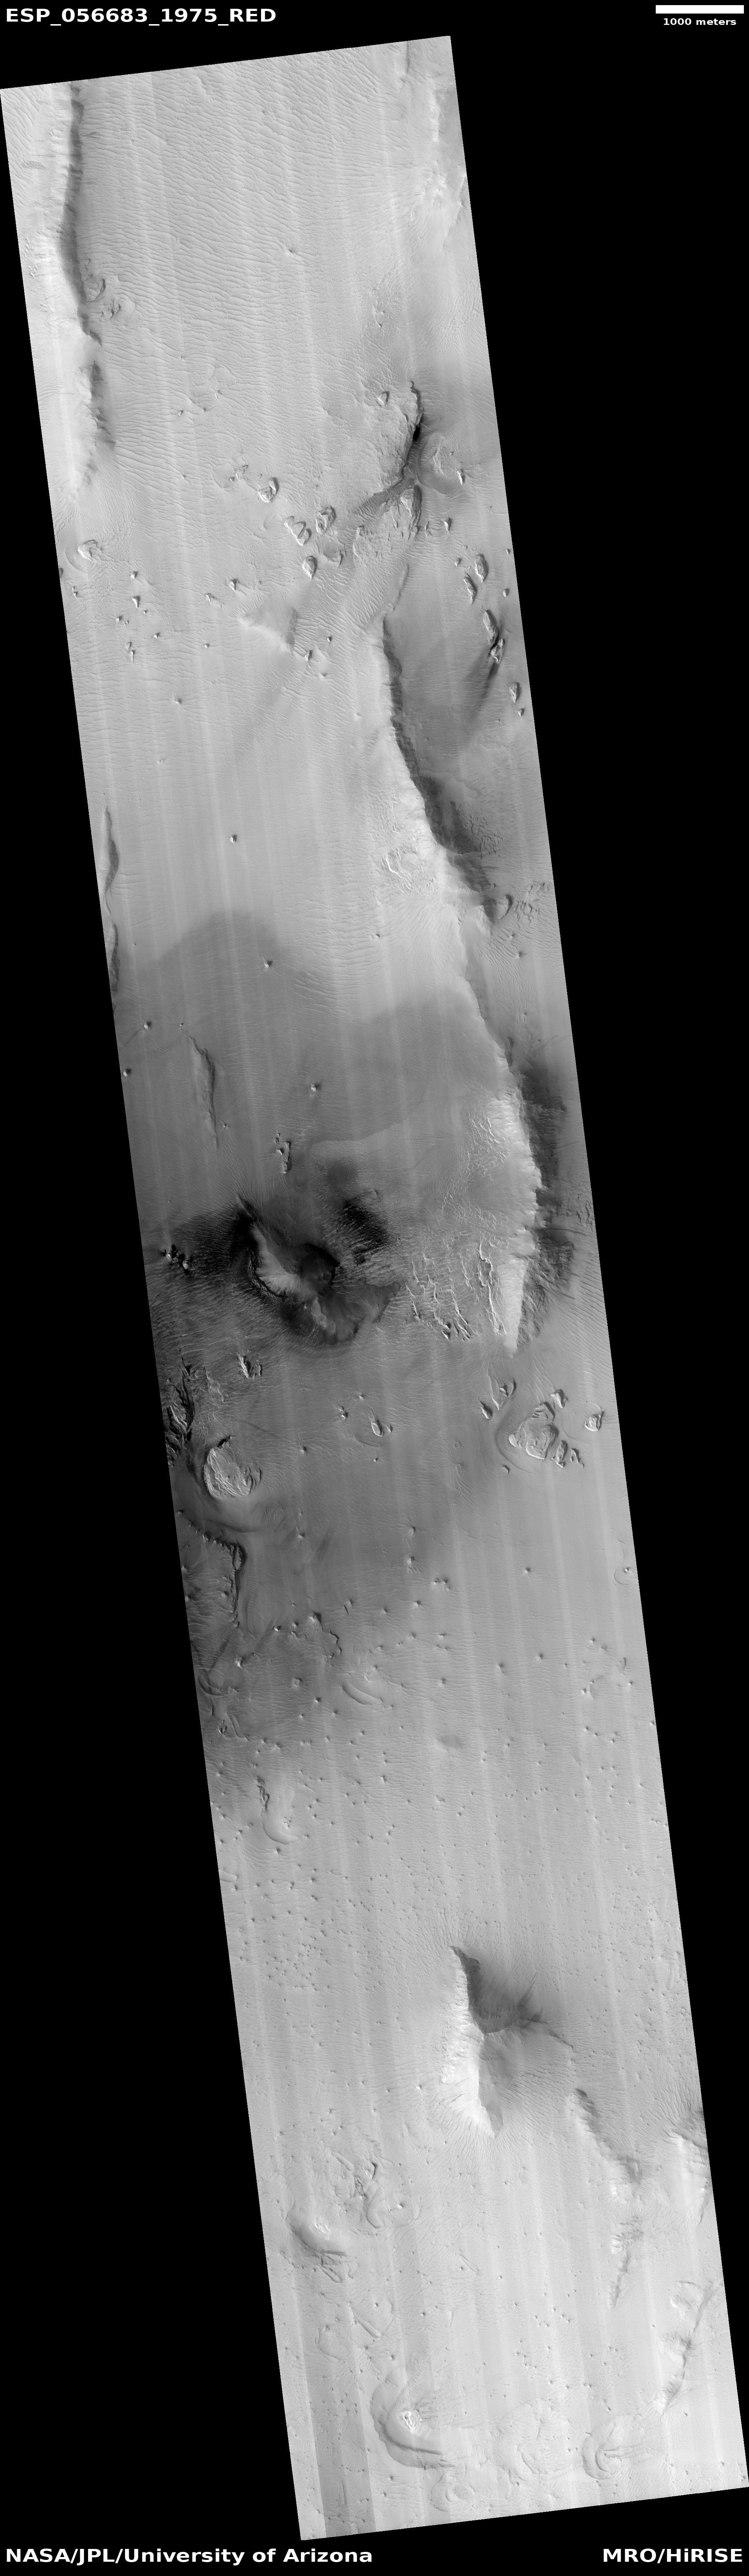
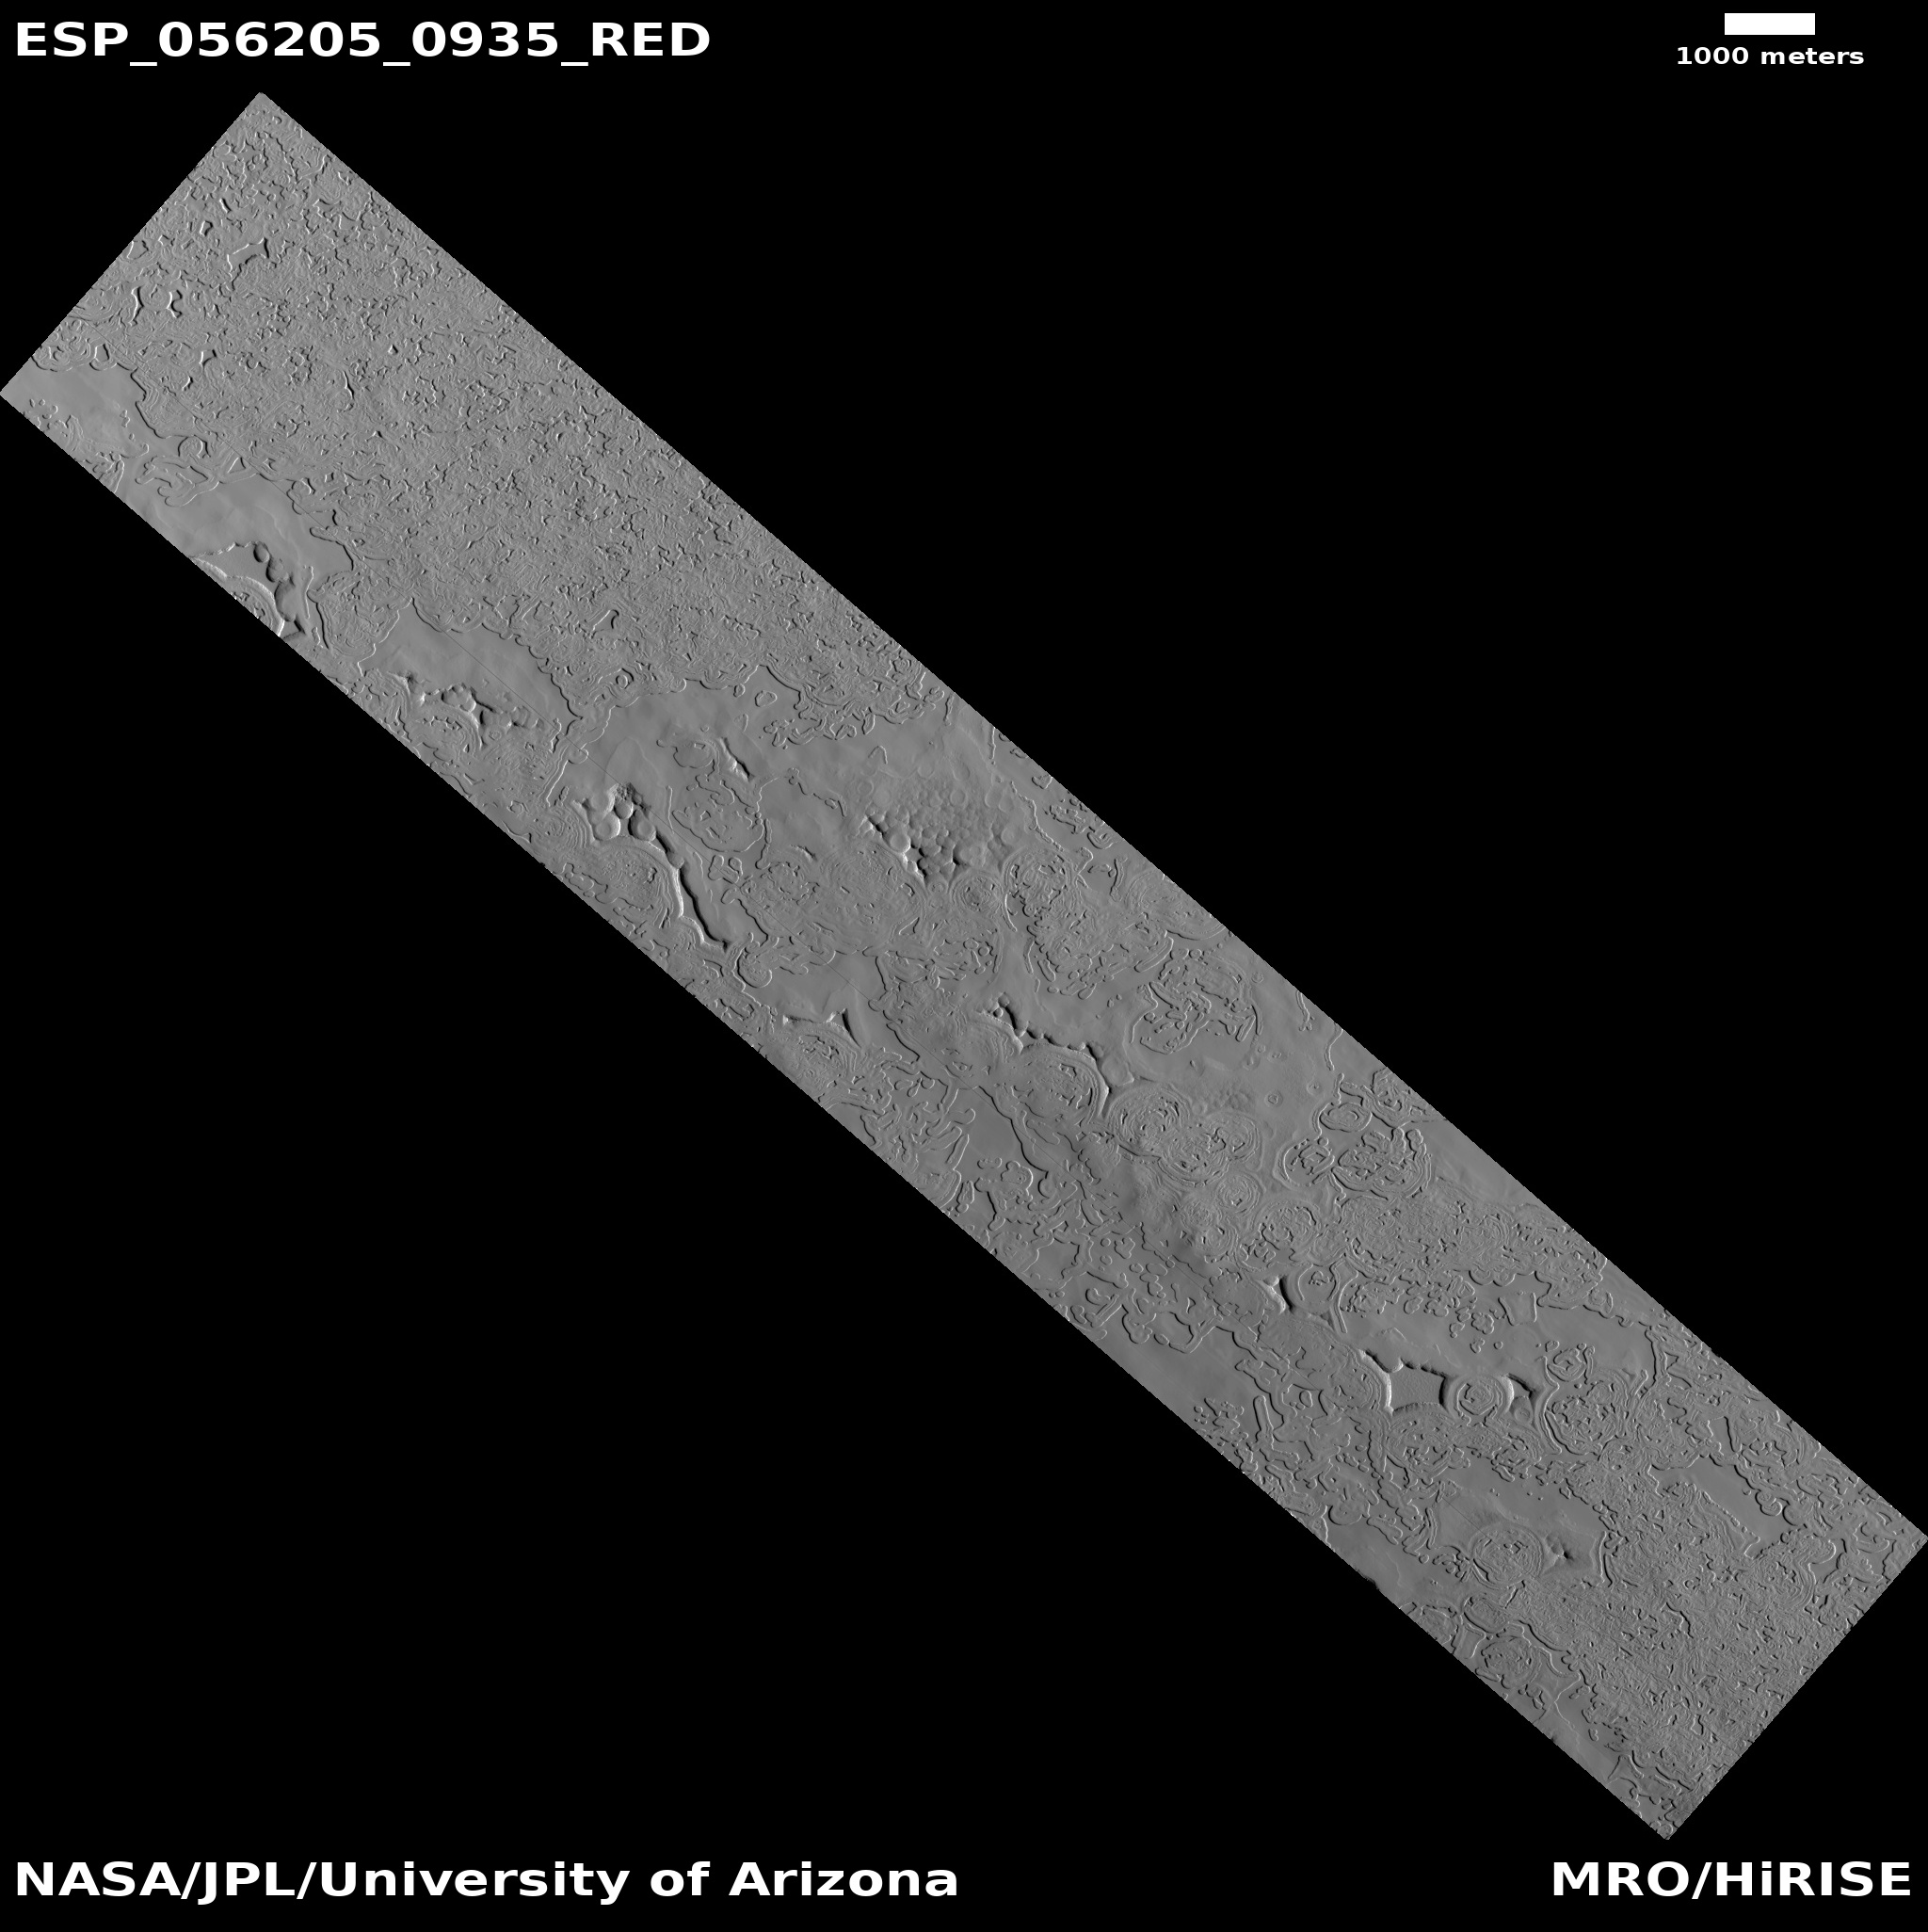
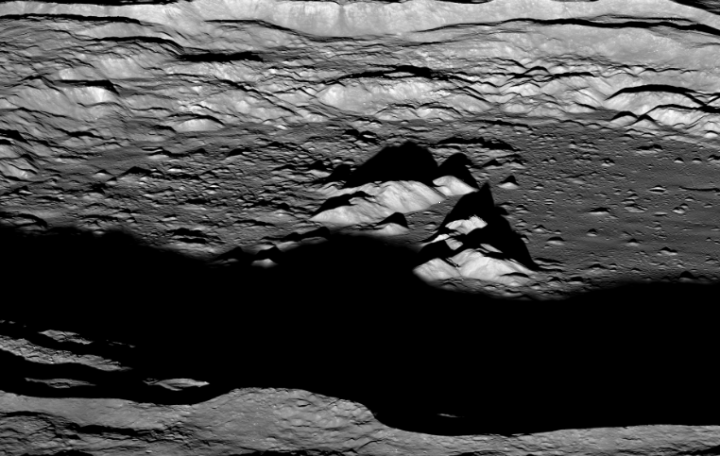
Cool image time! In reviewing the many images from the October image release from the high resolution camera on Mars Reconnaissance Orbiter (MRO), I came across two images, here and here, labeled “Change Detection in Olympus Maculae.” The image on the right is a cropped and reduced section of the first image, centered on the area of most interest. If you click on the image you can see the full photograph.
I did some research to see if I could find the changes indicated by this title. The location is an area on the outer western slopes of Olympus Mons, the largest volcano in the solar system. I found that MRO has taken images of this location twice before, in 2007, in 2009. I spent about fifteen minutes trying to find something that had changed, but was unable to locate anything, other than what look like a few wind-blown streaks probably caused by dust devils. I suspect I do not know what to look for.
Maybe my readers can spend some time and find these changes. If you do, please let us know in a comment.
Nonetheless, these two images revealed an area on the slopes of Olympus Mons that is most intriguing. It appears that there is a whole string of these dark splotches in this area, all of which have been carefully imaged by MRO several times. These splotches, along with the image titles, suggest that this might be area where there is activity from below that is causing the surface to darken. Could it be volcanic? Not likely. More likely is that there is underground frozen water located here, and like the spiders at the poles, this ice periodically pushes up as it sublimates to burst out as gas, and in the process darkens the surface.
If this guess on my part is correct, it suggests that this is an area in the mid-latitudes of Mars where water might be reasonably accessible. For future settlers this would be a significant discovery. And if my guess is wrong no matter. The features are puzzling, which explains why the scientists are aiming MRO at them repeatedly.
If I was to writing my science fiction novel Pioneer today, this is where I would have placed the discovery of the body of the Sanford Addiono, the astronaut who had disappeared on an asteroid near the orbit of Jupiter forty-six years previously. As the press release for the book’s release noted,
How Addiono had gotten to Mars from a distant lost asteroid–without a spaceship–was baffling.
That riddle was magnified by what Addiono had brought back with him. Among his effects was a six-fingered robot hand that had clearly been made by some alien civilization, along with a recorder and memo book describing what Addiono had seen.
What better place to put the start of this mystery but here, on a dark splotch on the slopes of Olympus Mons that also indicates its own geological mystery, a place some underground activity might be reshaping the surface of Mars.


