A star with giant misaligned rings
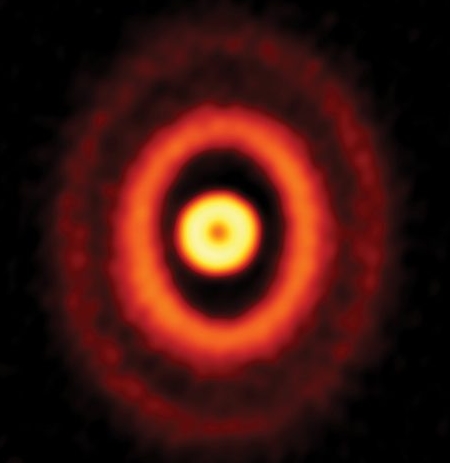
Astronomers using the Atacama Large Millimeter/submillimeter Array (ALMA) have detected a nearby star, dubbed GW Ori, with multiple rings of dust with several tilted in relation to the others.
The rings, with dust equaling 75, 170, and 245 Earth masses each, are 46, 188, and 336 astronomical units (au) each from their star. (An au is the distance of the Earth to the Sun.) If you look closely at the image to the right, you can see that the inner rings are circular, while the outer rings appear oval, suggesting that we are looking directly down at the inner rings, but the outer rings are tilted to our line of sight. Moreover, another team of astronomers
…observed GW Ori with ALMA and the European Southern Observatory’s Very Large Telescope (VLT). Near infrared observation with VLT showed for the first time that the innermost ring casts a shadow on the outer rings, which is clear evidence of disk misalignment. Kraus and his colleagues also performed a computer simulation and suggest that the triple star system can create misaligned rings, without gravitational assistance from planets. The two teams have different theories for the origin of the misaligned rings, but no conclusions have been reached so far. Nevertheless, GW Ori is a precious example to understand planet formation in the complex gravitational environment around multiple stars. [emphasis mine]
As noted, there is no agreement on the cause of the misalignment, only that it does exist.