
Sunspot update: The Sun confounds the predictions again!
It is time for my monthly update of the Sun’s ongoing sunspot activity, using the update that NOAA posts each month to its own graph of sunspot activity but annotated by me with extra information to illustrate the larger scientific context.
The activity in May was shocking in that it completely contradicted all expectations by everyone in the solar science community, with the Sun’s sunspot count changing in a way that was somewhat unprecedented. The graph below makes this very clear:
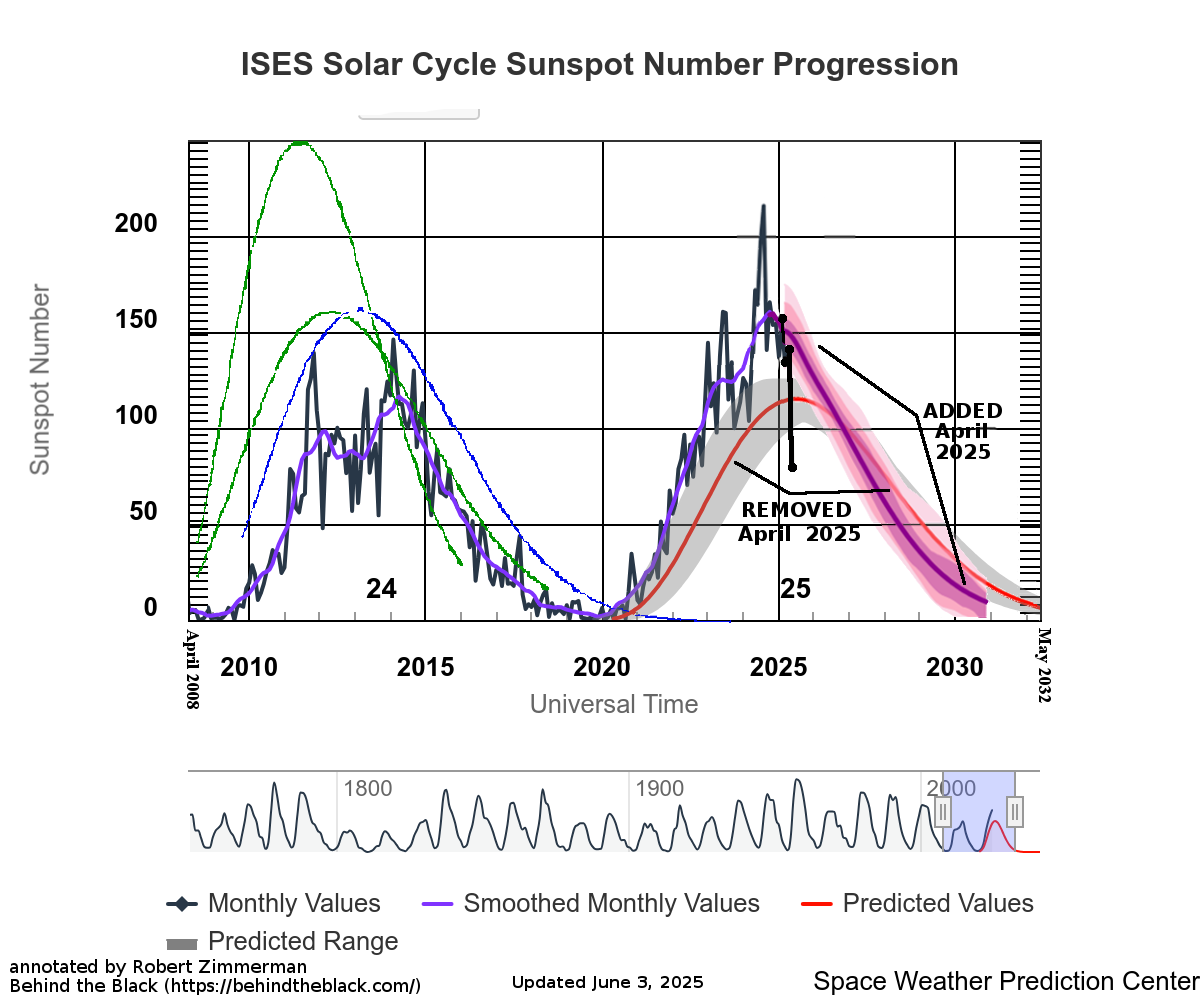
The graph above has been modified to show the predictions of the solar science community for both the previous solar maximum as well as the ongoing maximum. The green curves show the community’s two original predictions from April 2007 for the previous maximum, with half the scientists predicting a very strong maximum and half predicting a weak one. The blue curve is their revised May 2009 prediction. The red curve is the new prediction, first posted by NOAA in April 2020.
At the beginning of April 2025 NOAA’s panel of solar scientists added the purple/magenta curve line, then predicting that solar maximum is over, and the ramp down to minimum had begun
Activity in March and April seemed to more or less match that new prediction. The activity in May, just posted this week, is however completely beyond any prediction. I cannot find any past solar maximum that saw this much of a sudden steep drop in sunspot activity.
Past ramp downs from maximum have always tended to stretch out more slowly than the ramps up to maximum. Here however the Sun has done the opposite, its activity crashing in only one month.
Does this mean solar minimum is just around the corner? Hardly. Just as the Sun’s sunspot activity dropped so unpredictably in May, it could increase exponentially in June. Moreover, even with this drop there is still no reason at this moment to assume the new 2025 prediction of NOAA’s scientists is right either. As you can see by the green, blue, and red lines (indicating past predictions), their track record has been generally poor in the past two decades. It is still entirely possible that the Sun is presently in a double-peaked maximum (as seen in the previous maximum), and that we shall see a new rise in the coming months.
Or not. As I have said now repeatedly for years, no one yet understands the fundamental processes in the Sun’s magnetic dynamo that cause the magnetic field to flip polarity every eleven or so years and thus produce this cycle of sunspots. Nor do we understand why sometimes this cycle ceases for decades, producing few sunspots at all. And without that understanding, no prediction by anyone has much chance of being reliable.

On Christmas Eve 1968 three Americans became the first humans to visit another world. What they did to celebrate was unexpected and profound, and will be remembered throughout all human history. Genesis: the Story of Apollo 8, Robert Zimmerman's classic history of humanity's first journey to another world, tells that story, and it is now available as both an ebook and an audiobook, both with a foreword by Valerie Anders and a new introduction by Robert Zimmerman.
The print edition can be purchased at Amazon or from any other book seller. If you want an autographed copy the price is $60 for the hardback and $45 for the paperback, plus $8 shipping for each. Go here for purchasing details. The ebook is available everywhere for $5.99 (before discount) at amazon, or direct from my ebook publisher, ebookit. If you buy it from ebookit you don't support the big tech companies and the author gets a bigger cut much sooner.
The audiobook is also available at all these vendors, and is also free with a 30-day trial membership to Audible.
"Not simply about one mission, [Genesis] is also the history of America's quest for the moon... Zimmerman has done a masterful job of tying disparate events together into a solid account of one of America's greatest human triumphs."--San Antonio Express-News
I really don’t like that they removed the prediction graph. Since it is all online, how do you know how bad a guess they made? That is not science. Science is accepting the data with a “well that’s interesting” and get to work understanding.
Joe: FYI, the red curve prediction is still available, but you need to activate it by clicking on the vaguely labeled “add/remove series” dropdown box need the bottom of the graph.
That they remove their predictions when it becomes clear that the predictions were wrong has been par for the course for this NOAA department for more than two decades. It is why I annotate their graph so that their failed predictions become obvious.
This behavior is sadly systemic now across any science field dealing with climate and/or government funding.
Wow!
I knew something was up from monitoring the sunspots each day, but this jump was totally unexpected. Seems this lower rate is extending into June. Past performance is certainly not a sure way to predict this star: and past performance seems the way solar scientists predict solar activity.
uh oh
let’s hope this doesn’t signal the Sun moving into a more variable stage
we already know it’s unusually quiet compared to other stars
The ANSWER to all the UNCERTAINTY and lack of CONSISTENCY is OBVIOUS!! The Sun is a WOMAN!
I wonder, is there a possibility that the sun spot itself is erroneous? I have no idea how the data is collected and compiled. An anomaly such as this, the first step I’d take would be to reconfirm the sun spot count.