
Sunspot update: More evidence of an upcoming weak maximum
On July 4th NOAA updated its monthly graph tracking the monthly activity of sunspots on the Sun’s visible hemisphere. Below is that updated graph, annotated by me to show the past and new solar cycle predictions.
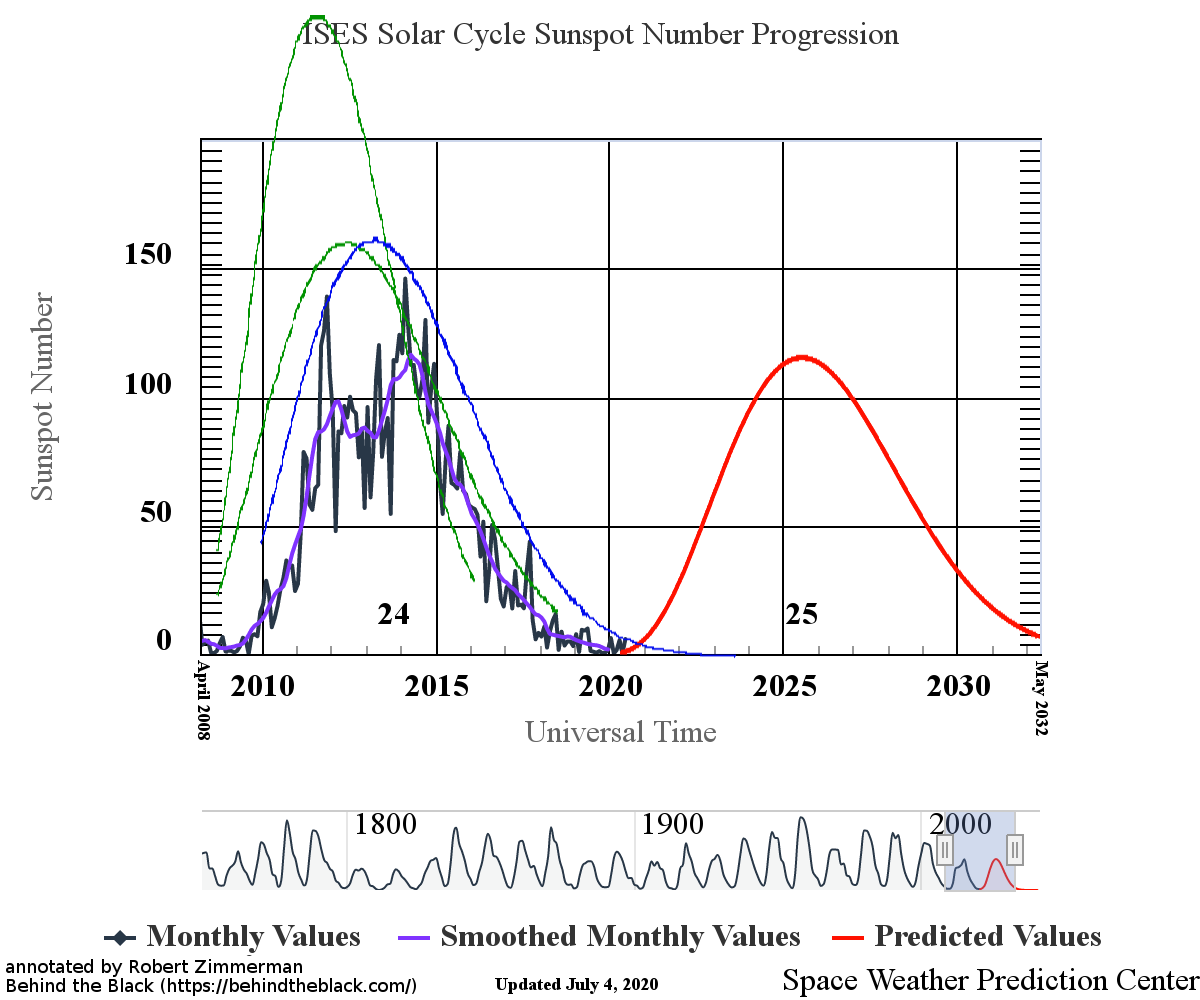
The graph above has been modified to show the predictions of the solar science community for both the previous and upcoming solar maximums. The green curves show the community’s two original predictions from April 2007 for the previous maximum, with half the scientists predicting a very strong maximum and half predicting a weak one. The blue curve is their revised May 2009 prediction. The red curve is the new prediction, first posted by NOAA in April 2020.
June saw an uptick of activity since my last update, though that activity remains quite low. We saw two sunspots during the month, both with polarities that link them to the next maximum and thus providing evidence that we will have a maximum in about five or six years. The first of those sunspots was also one of the strongest new cycle sunspots yet seen, and lasted for almost two weeks before it rotated off the visible face of the sun.
The ratio of next cycle sunspots vs sunspots from the past maximum has also been shifting. More and more, the new sunspots belong to the next cycle and less to the last. The ramp up to the next maximum is definitely beginning, though to call it a “ramp up” at this point is a big exaggeration. Sunspot activity remains low, though the last few months have seen some activity, unlike the seven months of nothing seen during the second half of last year.
The upcoming prediction for the next maximum calls for it to be very weak. Interestingly, the activity in June surpassed that prediction. This does not mean that the prediction will be wrong, only that June was more active when compared to the smooth prediction curve. As the cycle unfolds the monthly numbers will fluctuate up and down, as they did last cycle. The question will be whether their overall numbers will match closely with the prediction. In the past cycle actual sunspot activity was consistently below all predictions. It is too soon to say how well the new prediction is doing.

On Christmas Eve 1968 three Americans became the first humans to visit another world. What they did to celebrate was unexpected and profound, and will be remembered throughout all human history. Genesis: the Story of Apollo 8, Robert Zimmerman's classic history of humanity's first journey to another world, tells that story, and it is now available as both an ebook and an audiobook, both with a foreword by Valerie Anders and a new introduction by Robert Zimmerman.
The print edition can be purchased at Amazon or from any other book seller. If you want an autographed copy the price is $60 for the hardback and $45 for the paperback, plus $8 shipping for each. Go here for purchasing details. The ebook is available everywhere for $5.99 (before discount) at amazon, or direct from my ebook publisher, ebookit. If you buy it from ebookit you don't support the big tech companies and the author gets a bigger cut much sooner.
The audiobook is also available at all these vendors, and is also free with a 30-day trial membership to Audible.
"Not simply about one mission, [Genesis] is also the history of America's quest for the moon... Zimmerman has done a masterful job of tying disparate events together into a solid account of one of America's greatest human triumphs."--San Antonio Express-News
Now, NOAA would say there were sunspots visible 50% of the time. Lying with statistics, IMO. Total sunspot numbers as presented by Bob here, is the best manner of data presentation.
Note, there is no scientific evidence so far that sunspots effect climate. If sunspots effected climate, we would see an 11 year annual effect, when sunspots always decline, and always have. We do not.
The only time anyone can point to sunspots and climate is during the “little ice age”. During that time, there was periods of low sunspot activity that lasted for many decades. Thus, even if sunspots effect climate, it takes decades, many decades, to do so. The rest of Earths history, there have been longish periods with few sunspots, and no noticeable effect on Earth’s climate.
To put the record straight, we have about 400 years of data for sunspots : https://en.wikipedia.org/wiki/Solar_cycle#/media/File:Sunspot_Numbers.png
The early data is sporadic and are noted in red. More continuous data is in blue. The link (what ever it may be) is scientific. We have no real data which explains the link. There is a link between the “greeness” of the grass and umbrellas found on buses in England. Current observations may show what the relationship is between the sunspots and climate. Yes, for this to affect climate, it by definition is over decades not an 11 year cycle.
There have been some who try to relate sunspots before there were observations, but these require assumptions, which tend to have problems. Give me empirical data over models anytime!
Here is a new tool by NOAA
https://www.swpc.noaa.gov/products/solar-cycle-progression
Interesting that they have eliminated data from the grand minimum known as the Maunder Minimum!
Phill O: Um, this is the graph I link to and use every month. I wrote about it extensively earlier this year when they introduced it.
Also note how the scale is changed each time one looks at a particular data set.
When I went on, the scale changed for every time I clicked on an era. If it were all on one scale, it might be much easier to see trends. As it is represented, I get the idea that they do not want people to draw their own conclusions. Might explain why you were fooled for a brief time.