
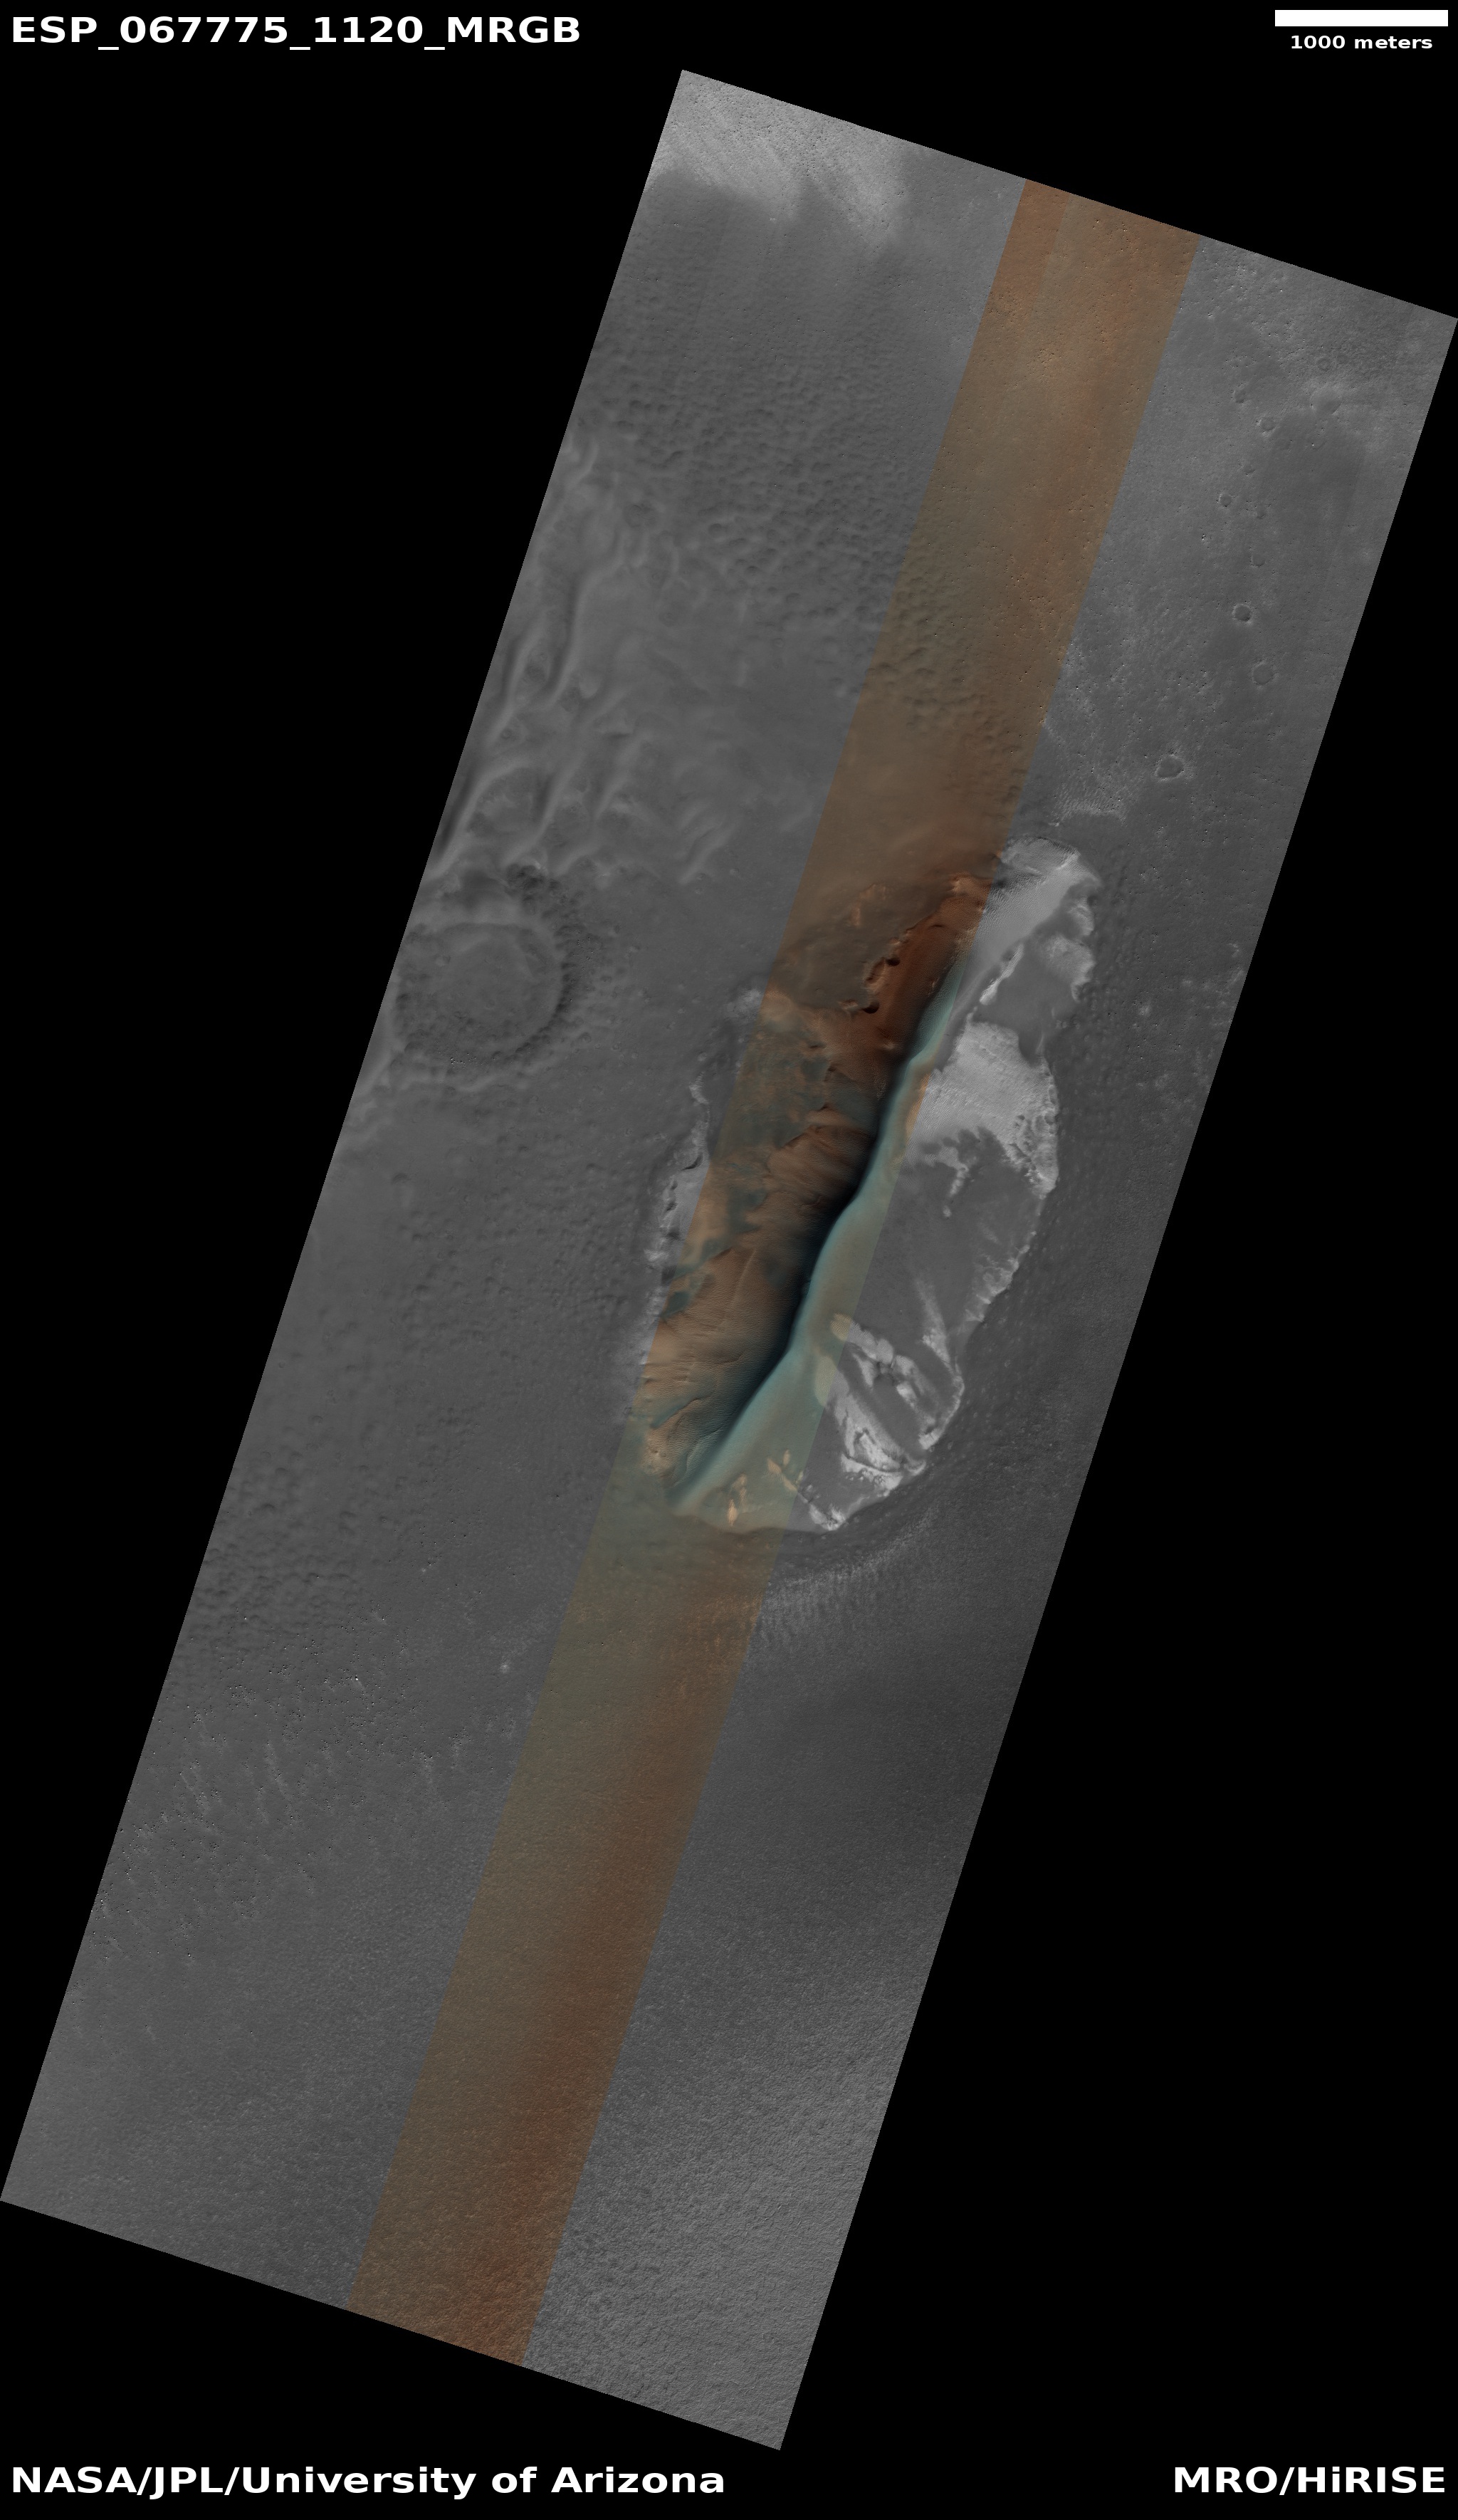
Strange ridge ripples on the windswept plateau above Mars’ biggest canyon
Click for full image.
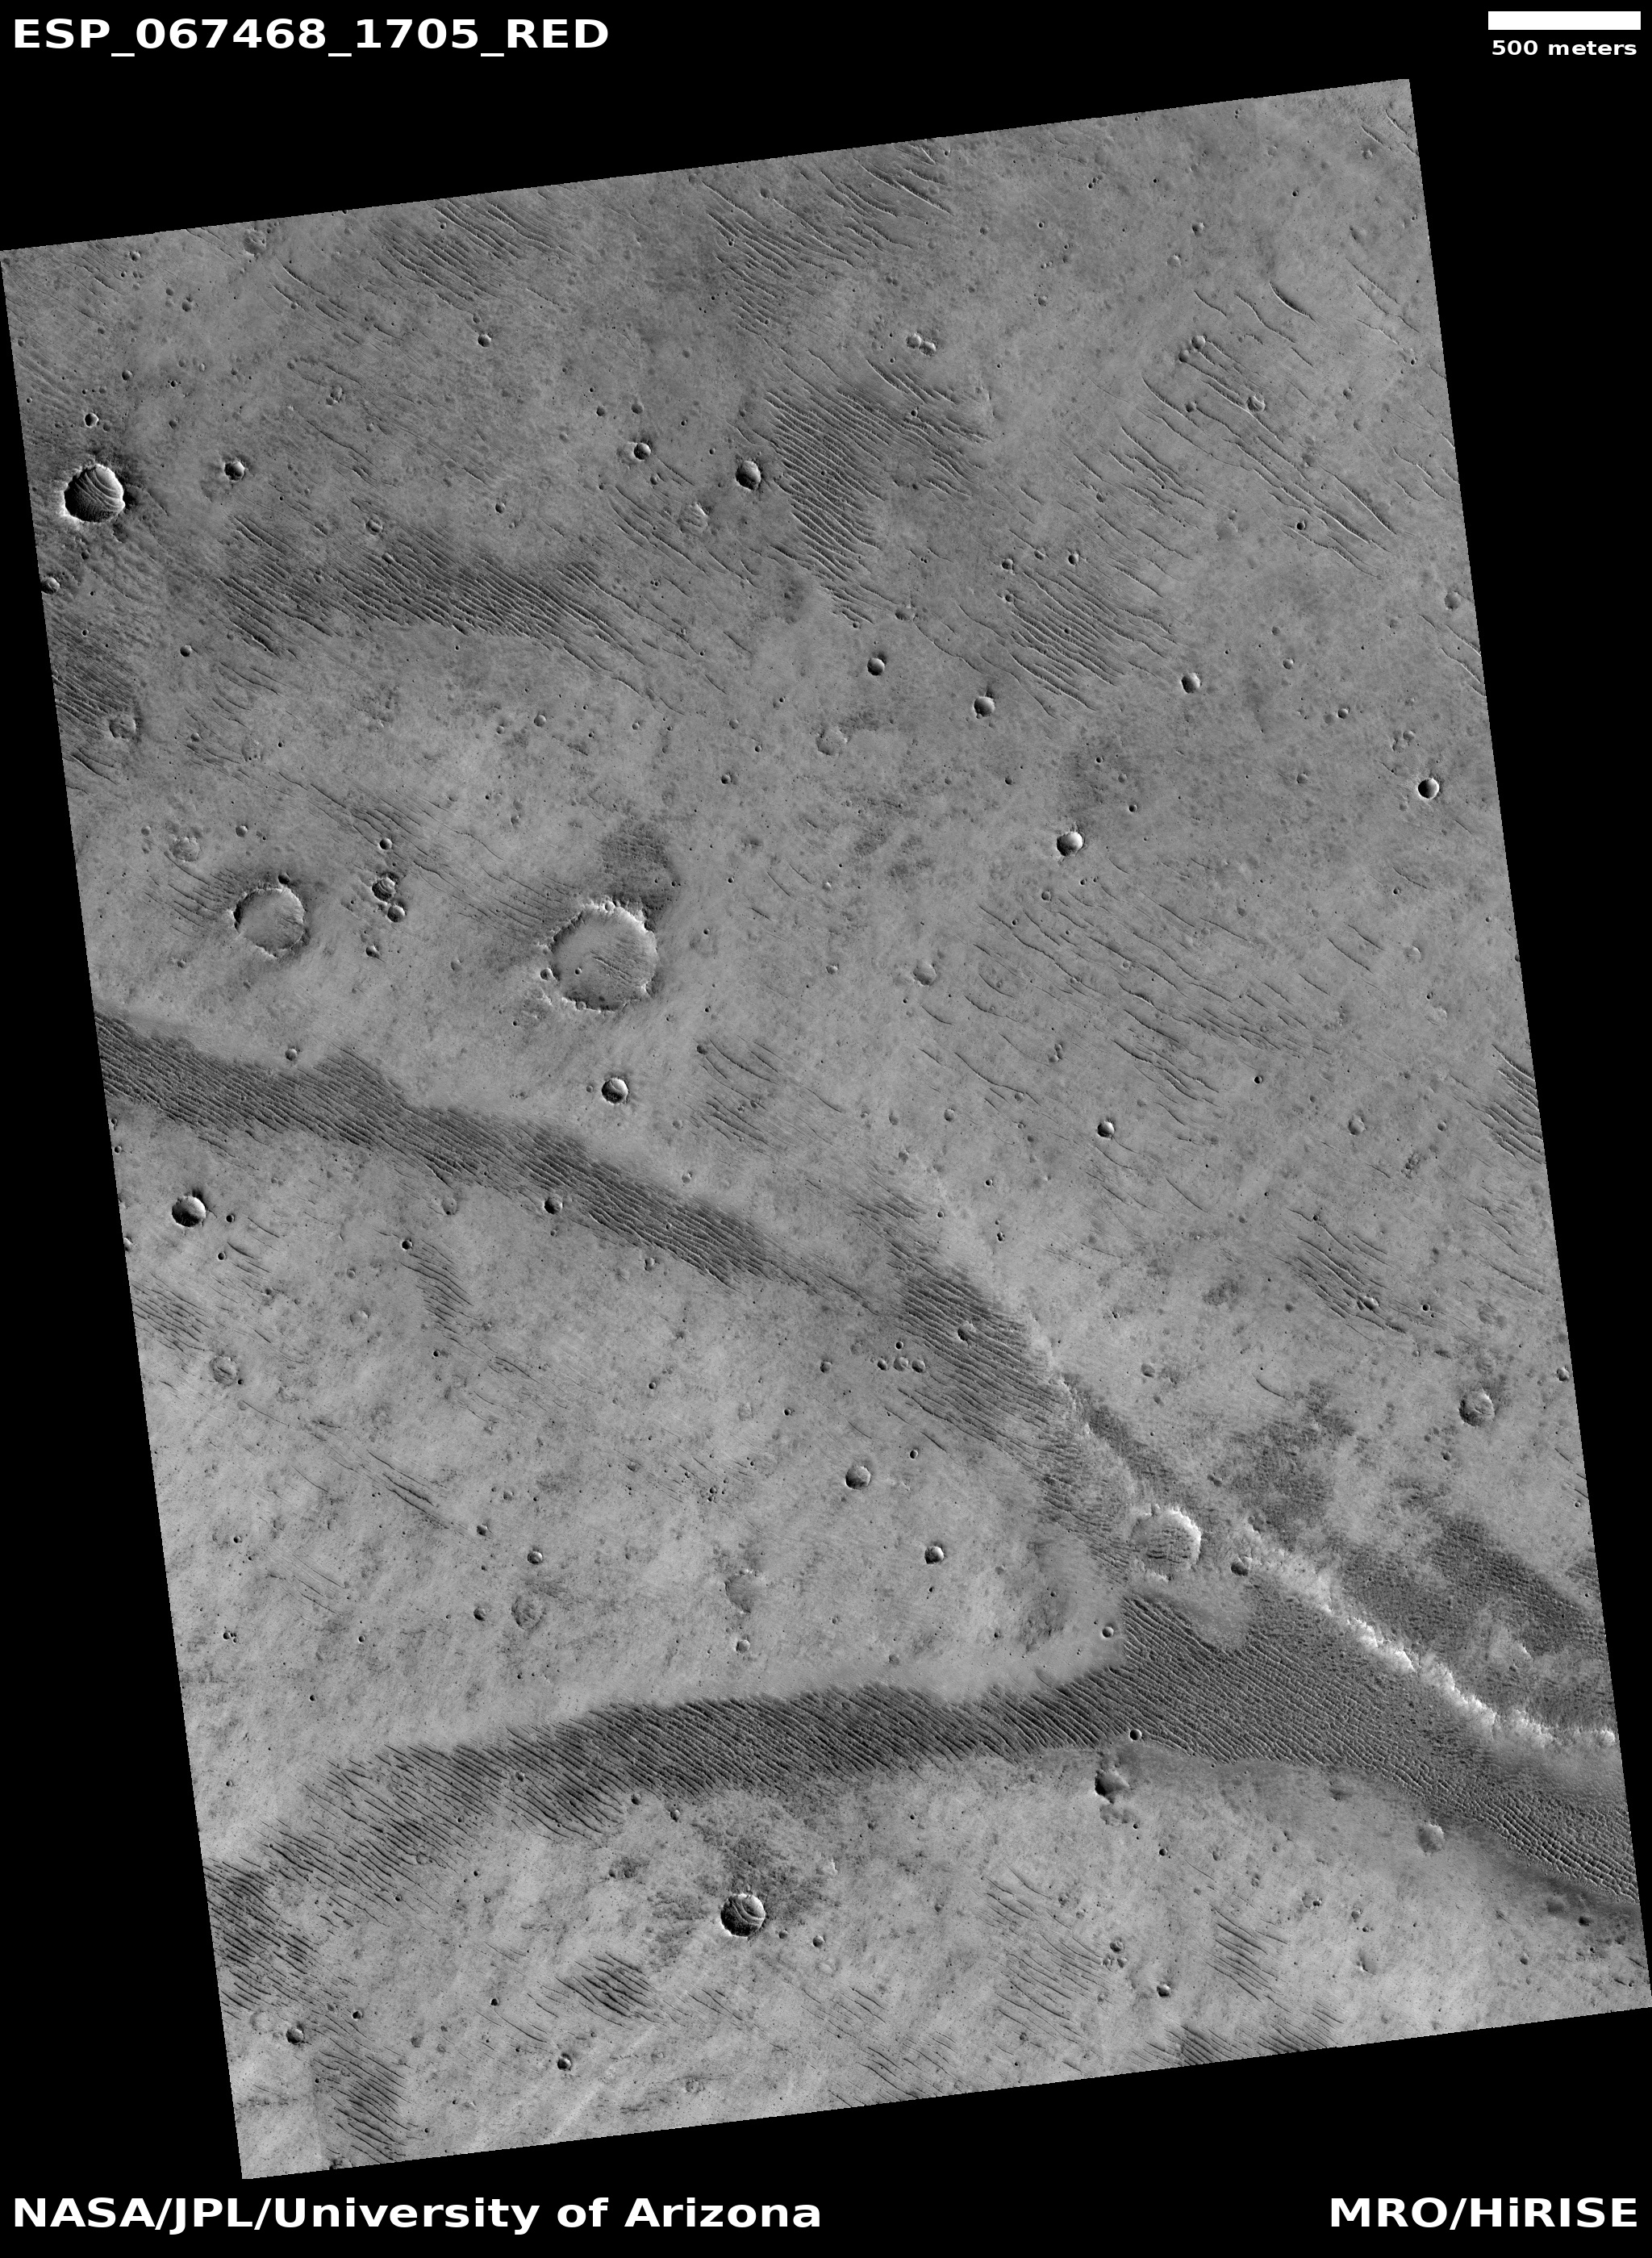
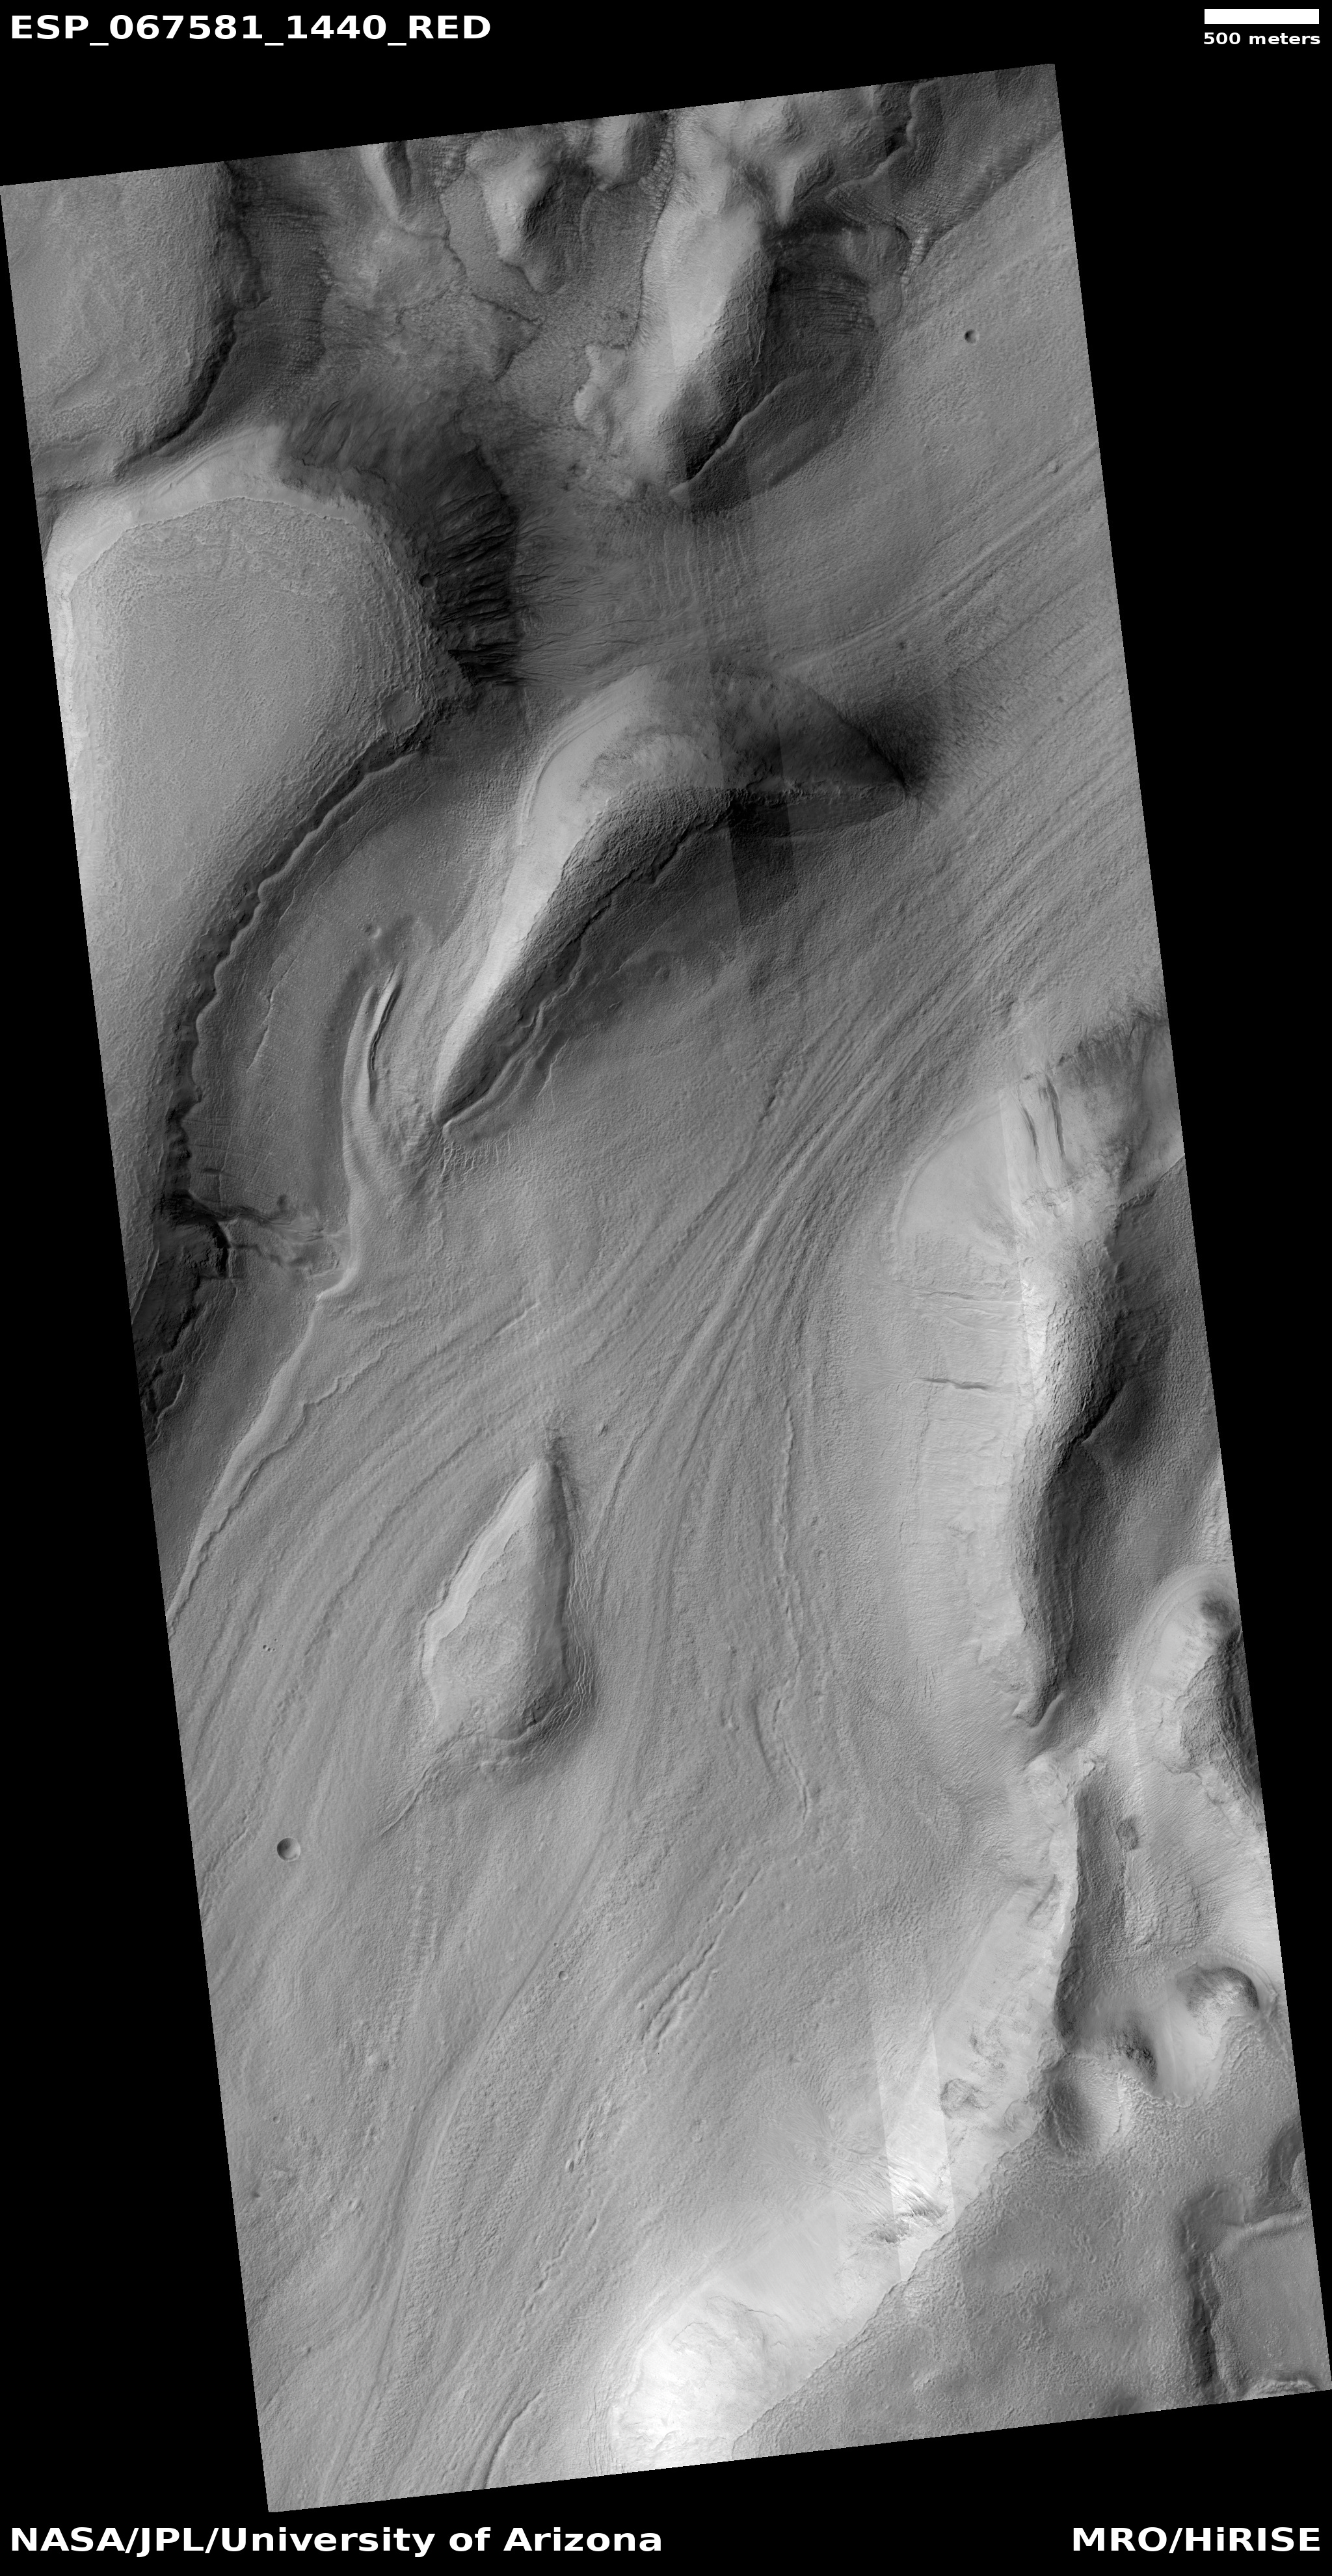
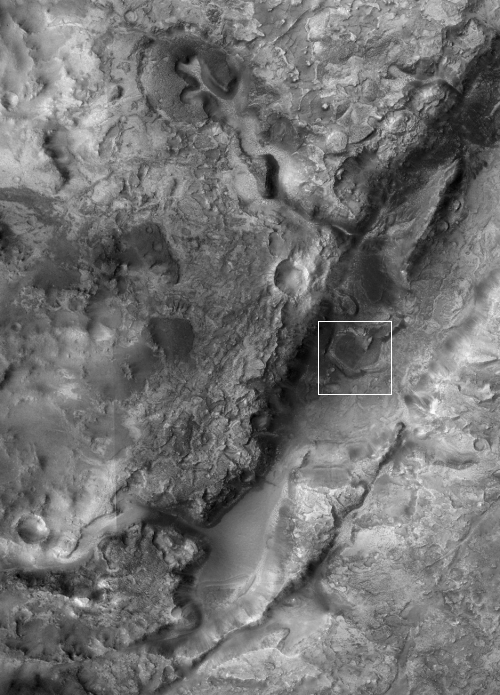
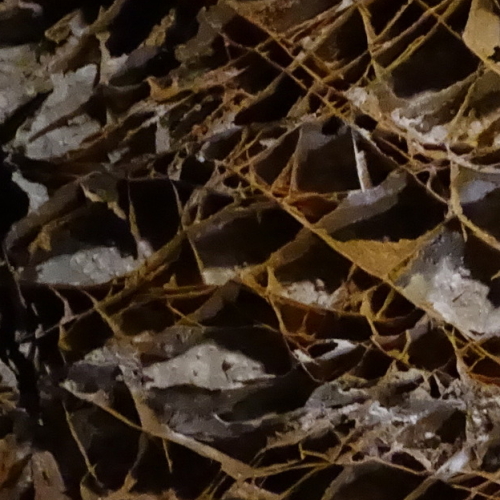
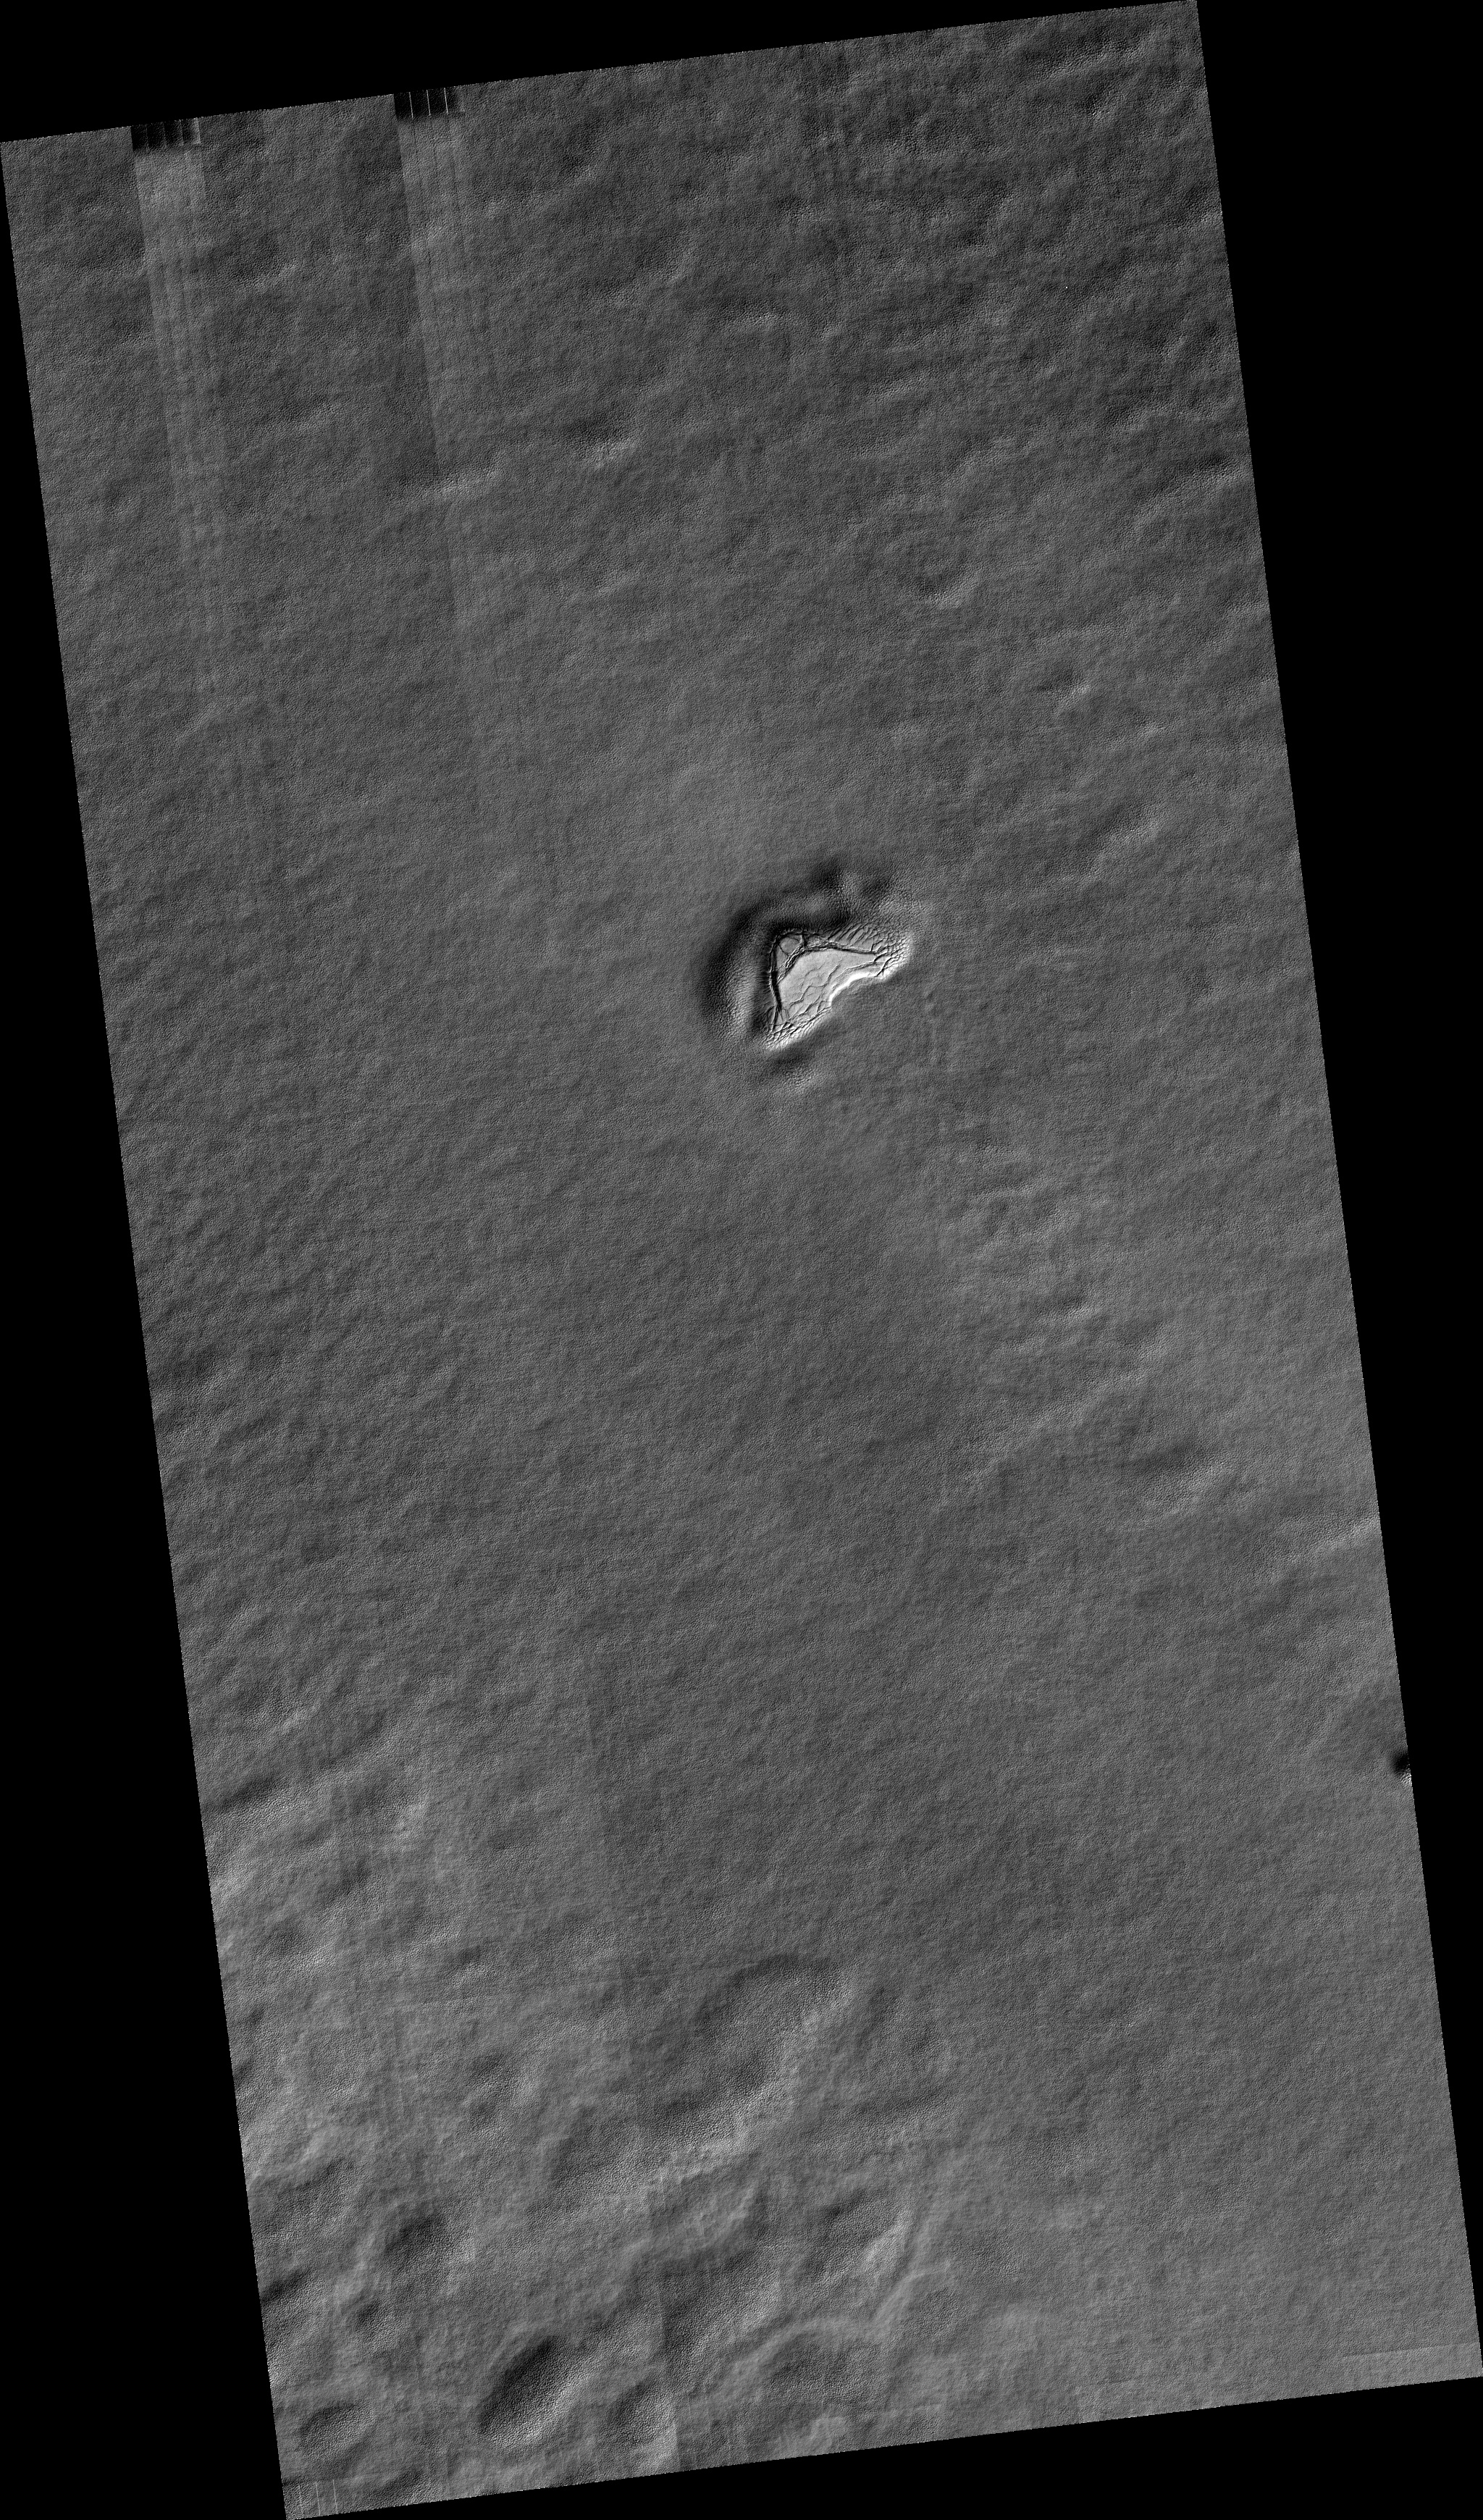
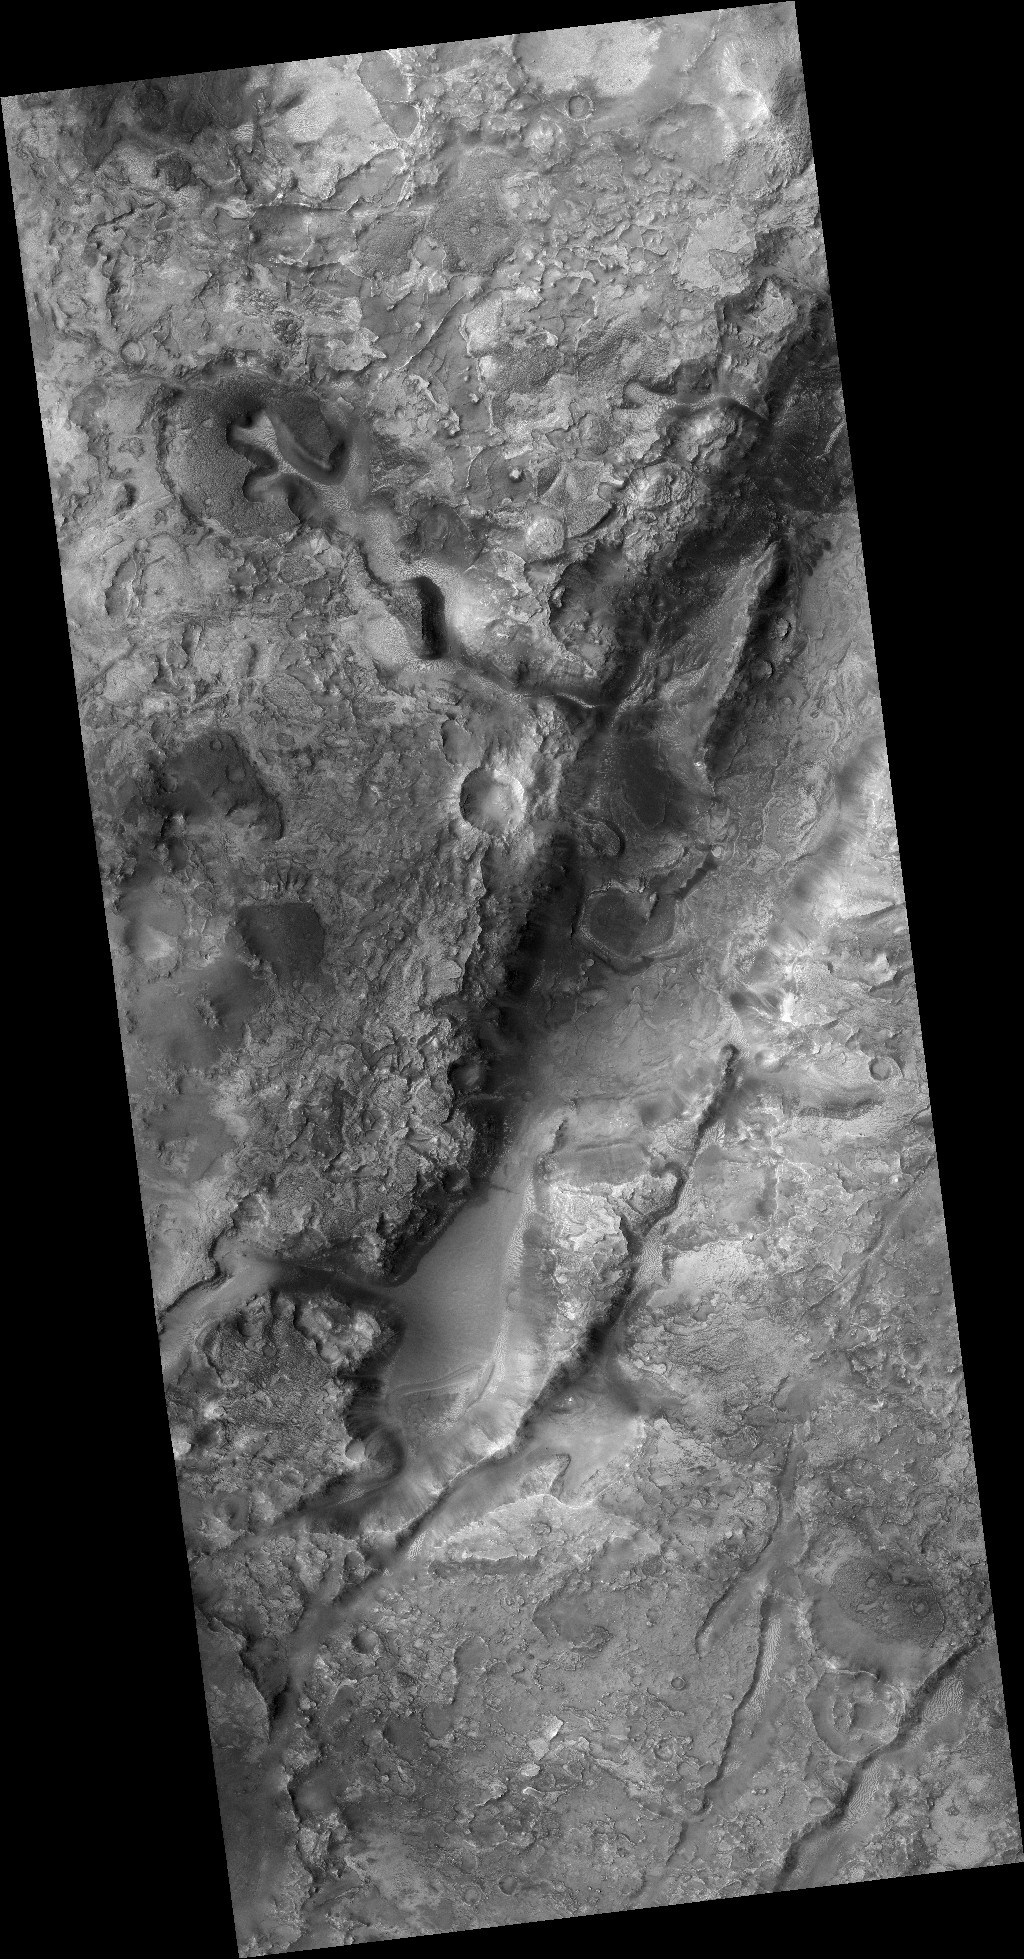
Today’s cool image is once again another of what I dub a “what the heck?” photo. The picture to the right, cropped to post here, was taken on December 17, 2020 by the high resolution camera on Mars Reconnaissance Orbiter (MRO) and captures some very strange ridges on the plateau above Mars’ biggest canyon, Valles Marineris.
The image, labeled merely as a “terrain sample,” was taken not as part of any specific research project but scheduled by MRO’s science team in order to maintain the camera’s temperature. When they do this they try to take pictures covering something interesting, but often it is a potshot that sometimes shows little of interest.
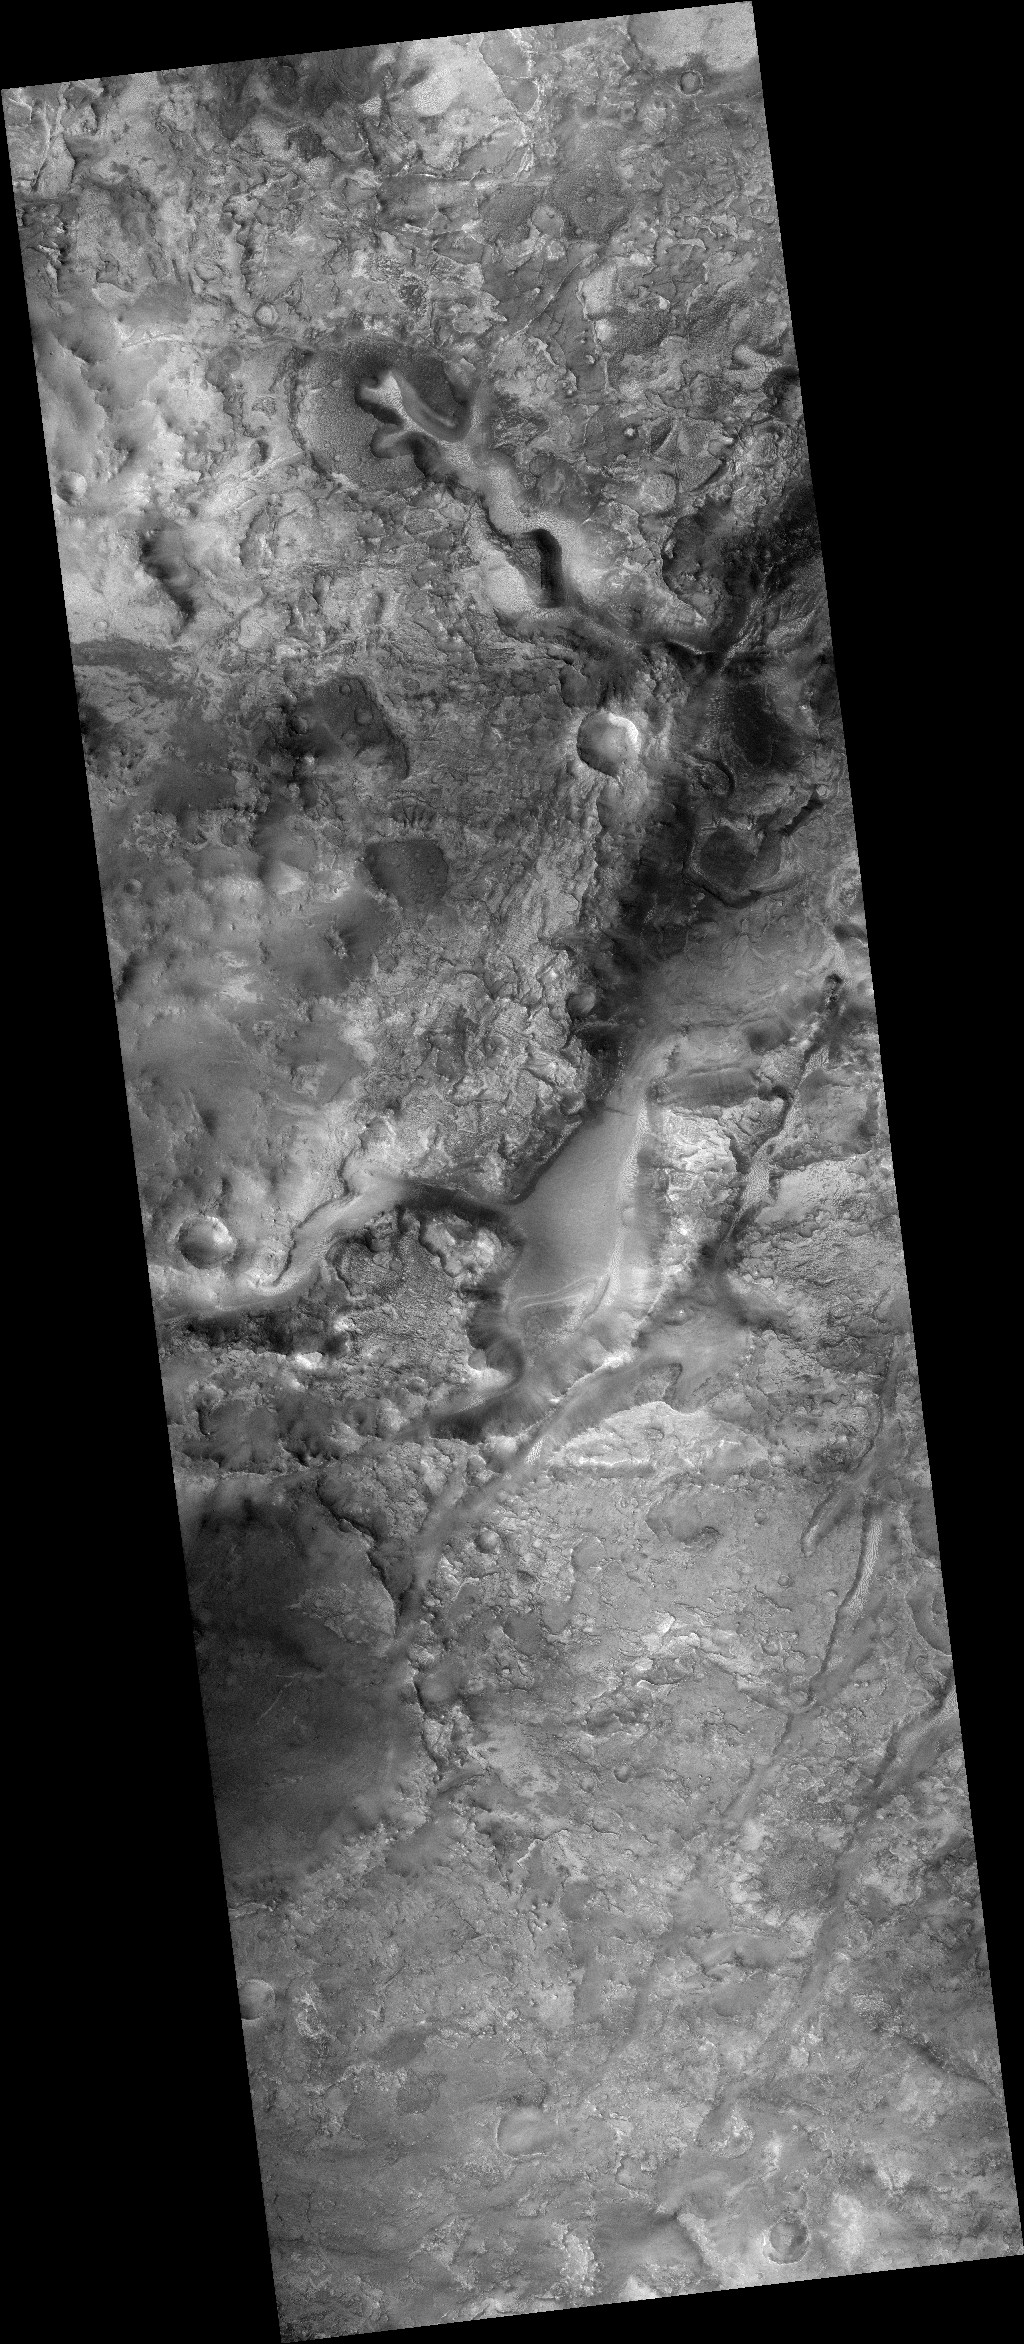
In this case the photo shows something very strange. The ridges in the sample are packed into one area only, but if you look at the full image you will see that they are also scattered about randomly and sometimes isolated on the flat plains surrounding this spot.
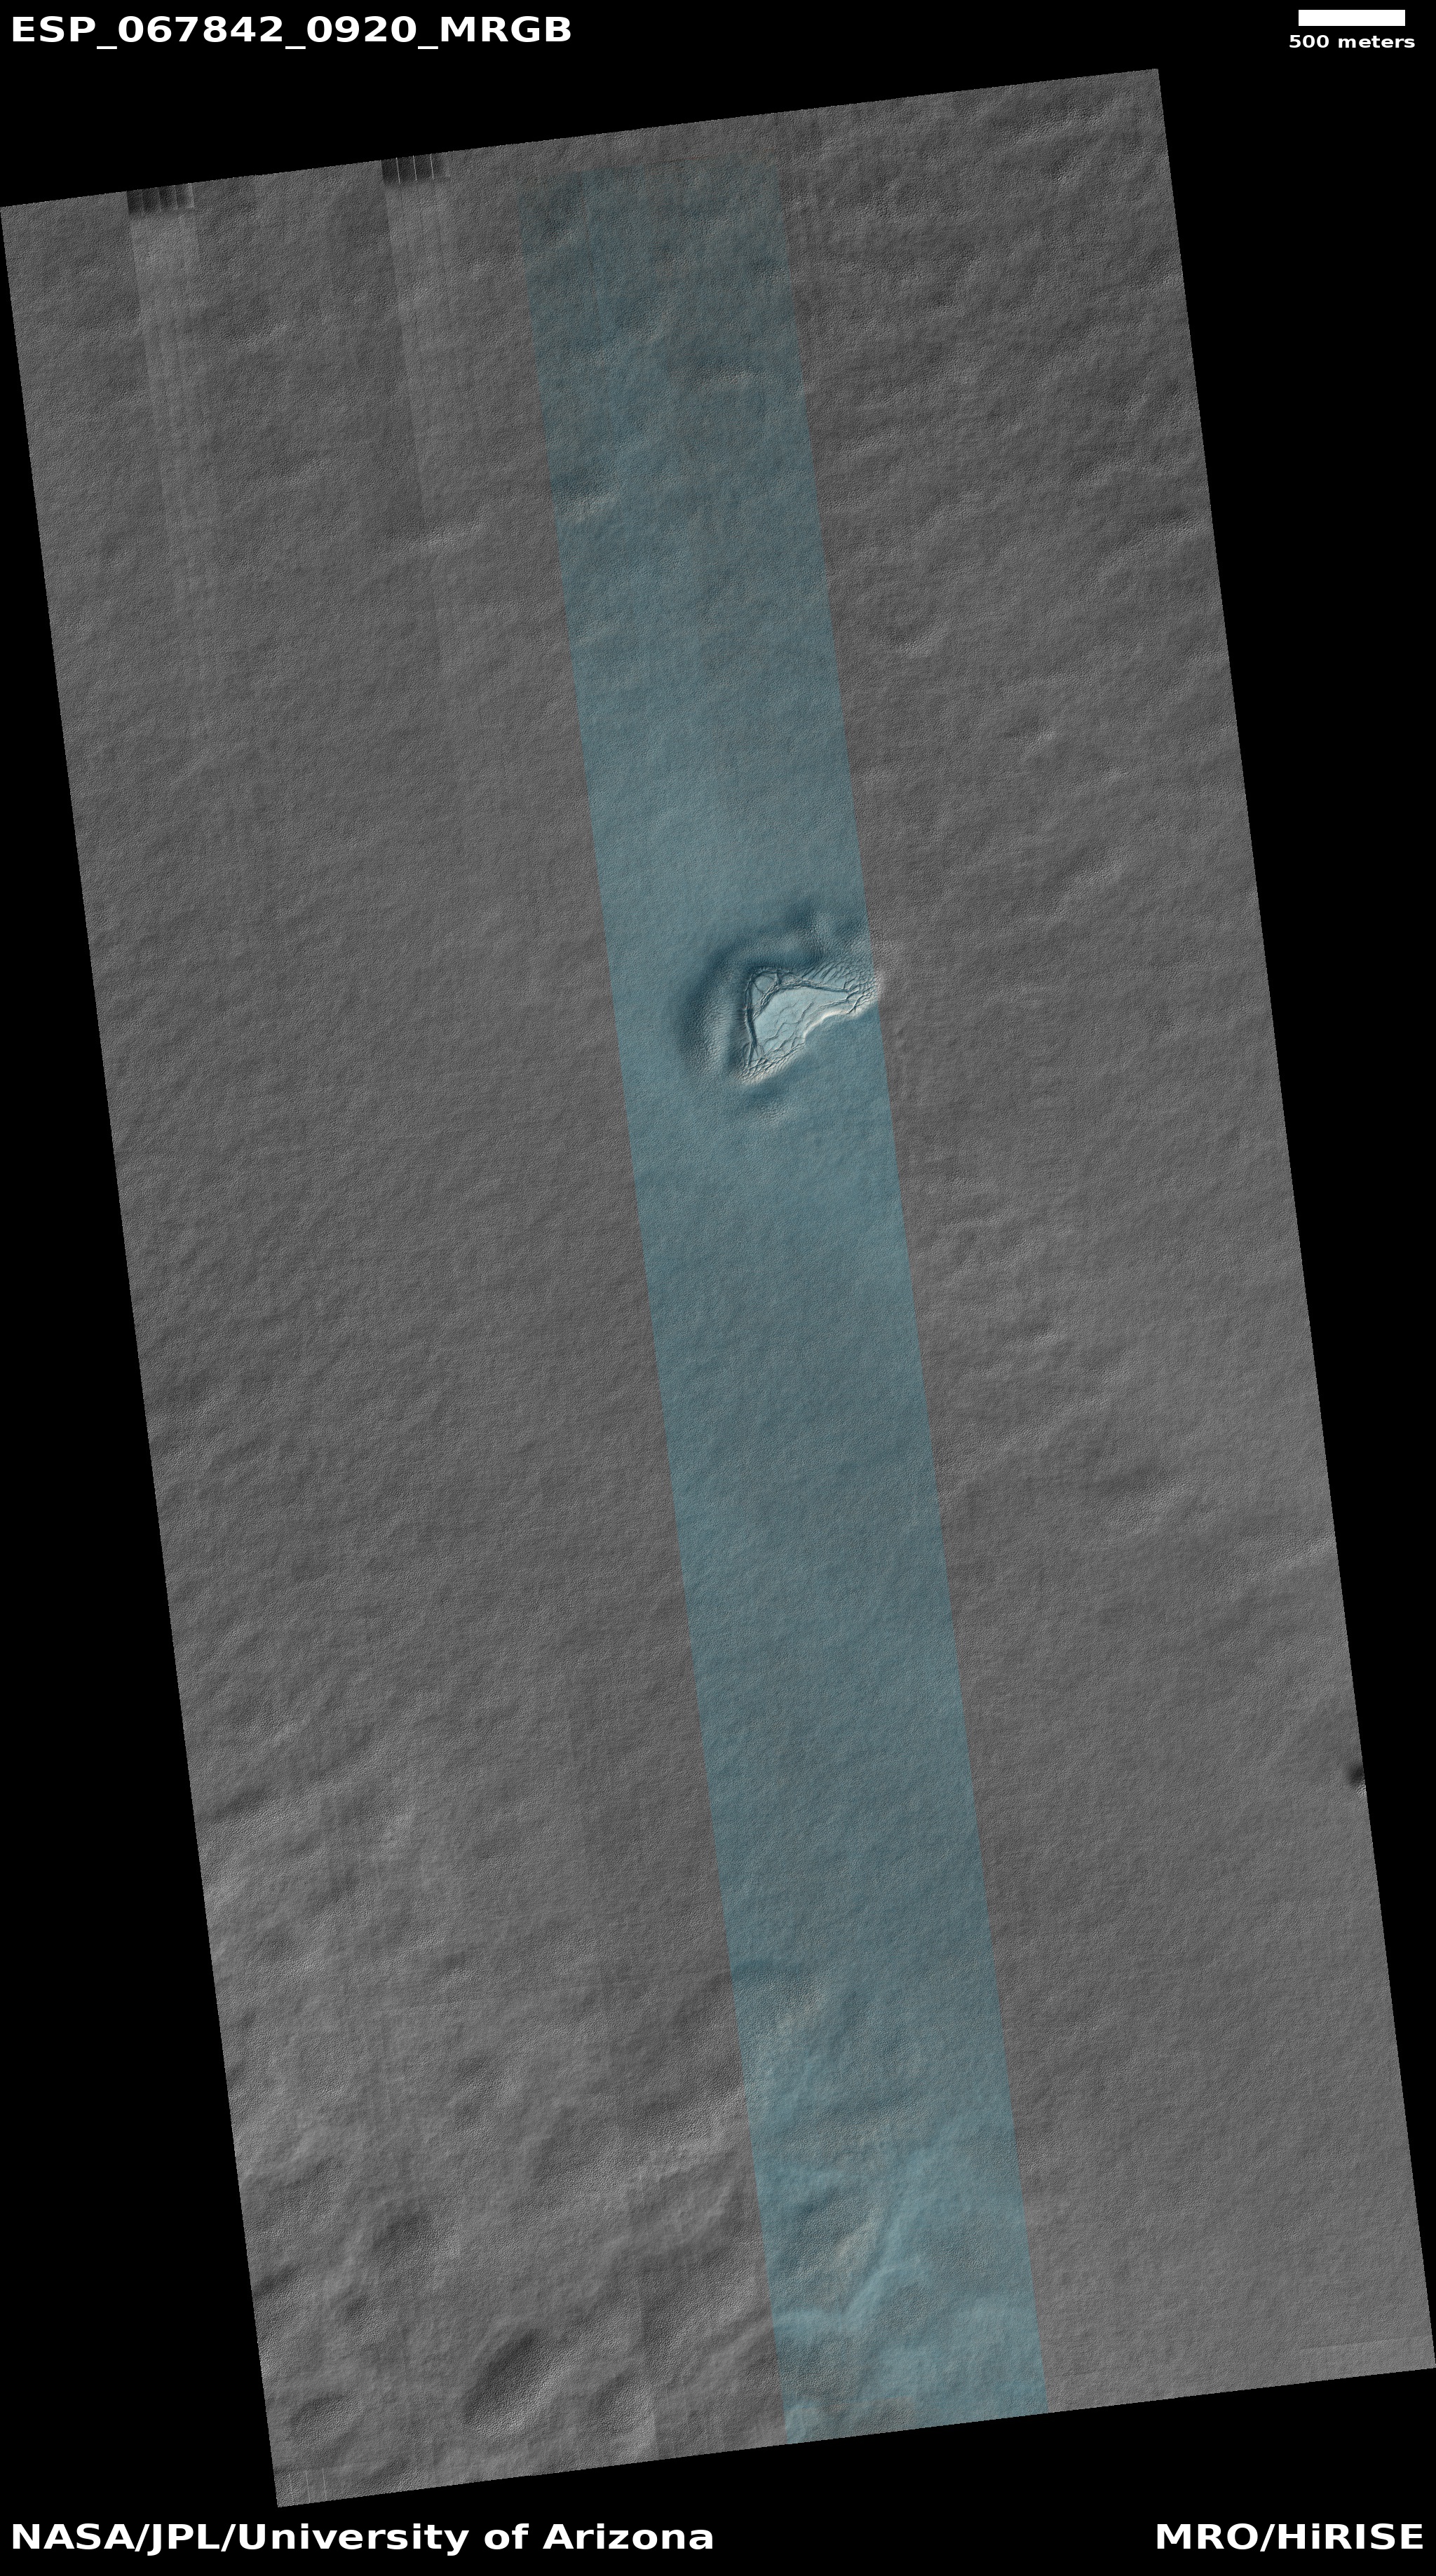
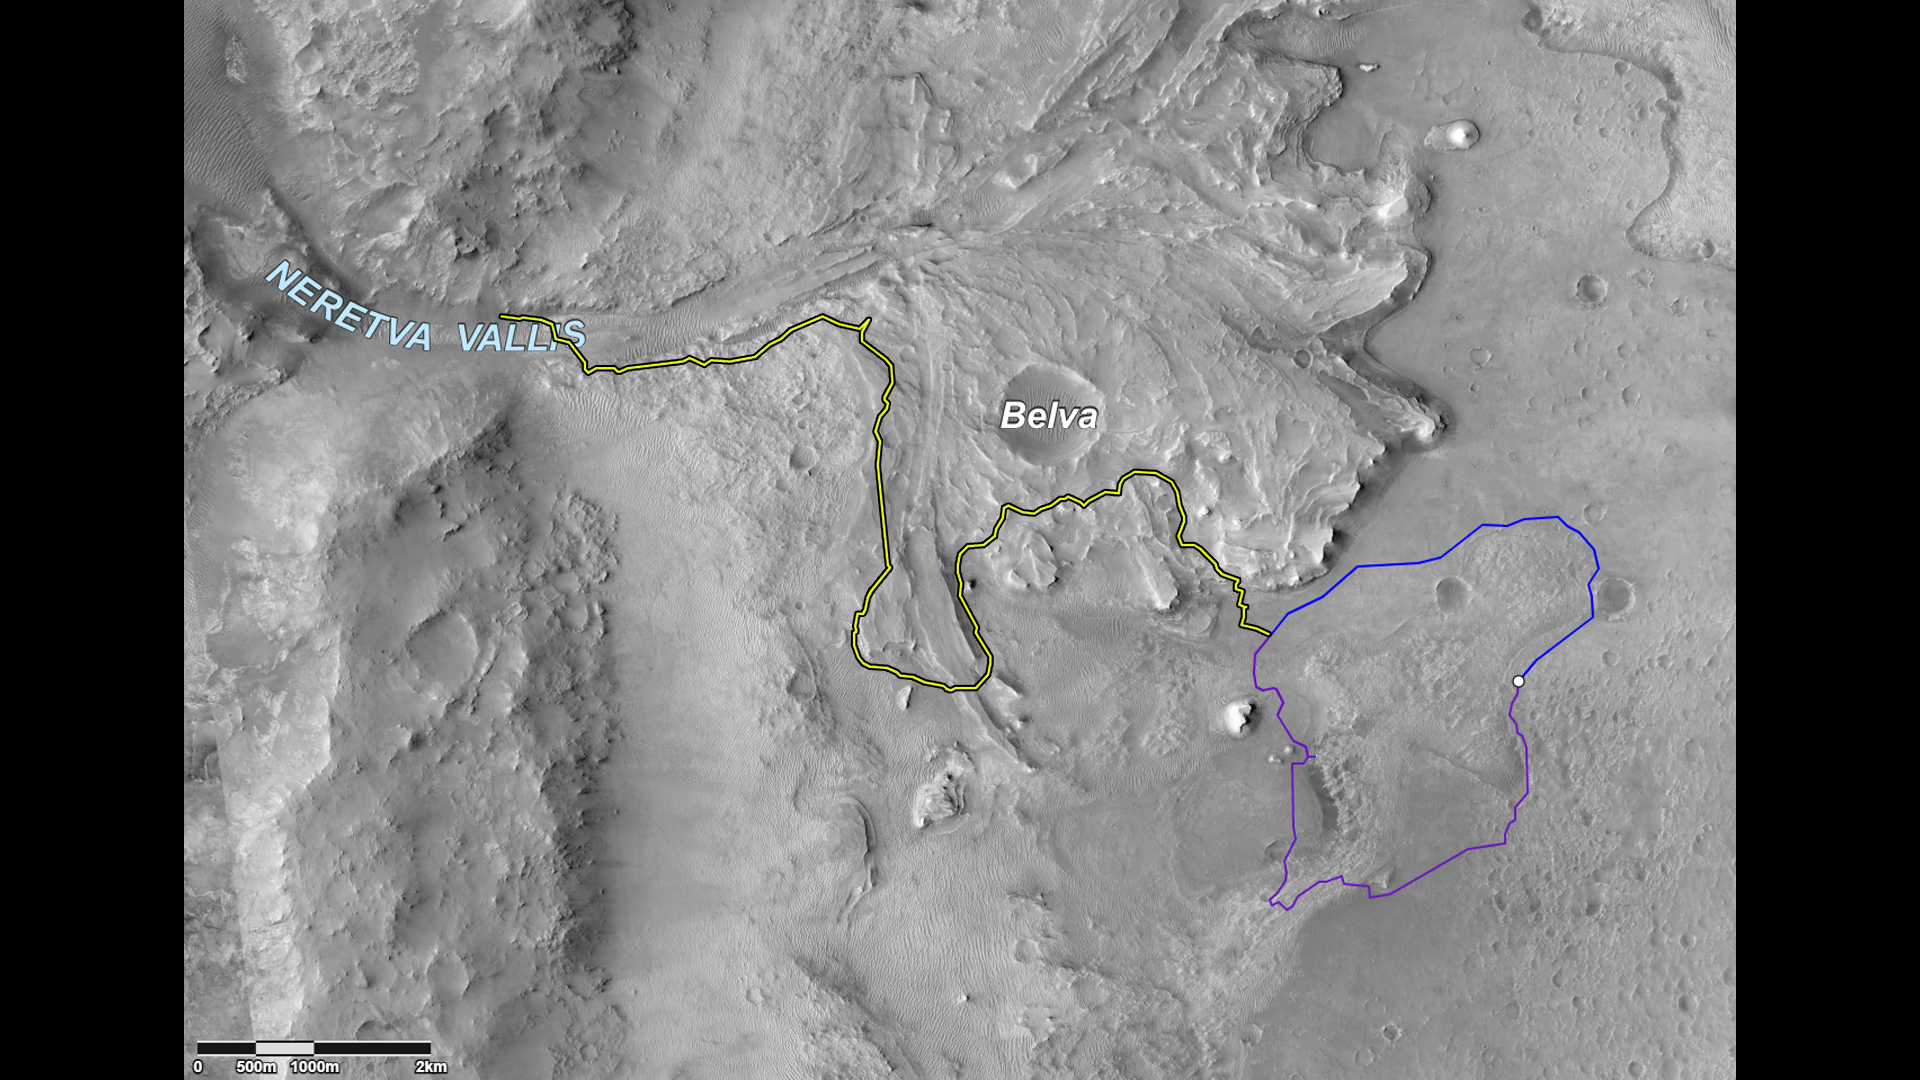
Interestingly, these ridges resemble the first “What the heck?” image I ever posted in 2019. That photo was located at about the same elevation as these ridges, but due west in the volcanic plains near Mars’s giant volcanoes and just off the western edge of the overview map below.
» Read more


